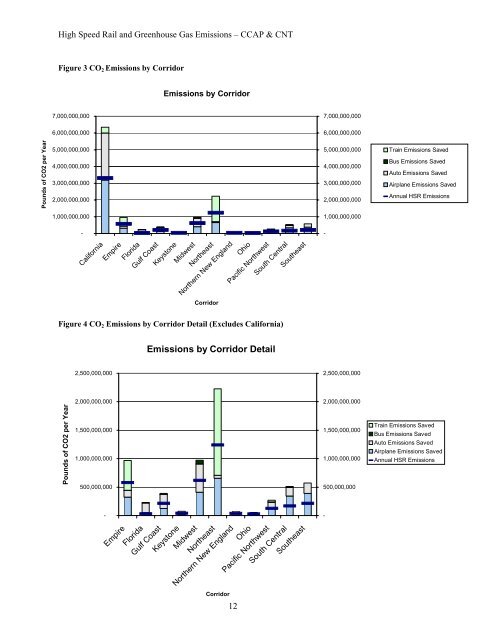
Pounds of CO2 per Year <strong>High</strong> <strong>Speed</strong> <strong>Rail</strong> and Greenhouse Gas Emissions – CCAP & CNT Figure 3 CO2 Emissions by Corridor 7,000,000,000 6,000,000,000 5,000,000,000 4,000,000,000 3,000,000,000 2,000,000,000 1,000,000,000 Figure 4 CO2 Emissions by Corridor Detail (Excludes Cali<strong>for</strong>nia) Pounds of CO2 per Year - 2,500,000,000 2,000,000,000 1,500,000,000 1,000,000,000 500,000,000 - Emissions by Corridor Cali<strong>for</strong>nia Empire Florida Gulf Coast Keystone Midwest Northeast Northern New England Ohio Pacific Northwest South Central Southeast Corridor Emissions by Corridor Detail Empire Florida Gulf Coast Keystone Midwest Northeast Northern New England Ohio Pacific Northwest South Central Southeast Corridor 12 7,000,000,000 6,000,000,000 5,000,000,000 4,000,000,000 3,000,000,000 2,000,000,000 1,000,000,000 - 2,500,000,000 2,000,000,000 1,500,000,000 1,000,000,000 500,000,000 - Train Emissions Saved Bus Emissions Saved Auto Emissions Saved Airplane Emissions Saved Annual HSR Emissions Train Emissions Saved Bus Emissions Saved Auto Emissions Saved Airplane Emissions Saved Annual HSR Emissions
<strong>High</strong> <strong>Speed</strong> <strong>Rail</strong> and Greenhouse Gas Emissions – CCAP & CNT Analysis and Discussion Our modeling shows that high speed rail, if built as planned, will generate substantial greenhouse gas savings in all regions. The size of the emissions savings is dependent on the number of high speed rail passengers projected to be diverted from other modes and the rail technology used. Emissions savings are also greater when passengers are diverted primarily from air and automobiles, which generate more emissions per passenger than high speed rail technologies; conventional rail and bus generate fewer emissions per passenger than high speed rail (See Table 1). Total Ridership Current projections show that passengers would take 112 million trips on high speed rail in the U.S. in 2025, traveling more than 25 billion passenger miles. A transportation system that includes high speed rail would look very different from today’s intercity travel network. There would be 29 million fewer automobile trips and nearly 500,000 fewer flights. In some regions, such as the Midwest, the impact on air travel is likely to be modest; our analysis shows just a 7 percent decrease in flights from today’s levels based on projected diverted airline passengers in the Midwest. In other areas, the impact of high speed rail may be much greater. The Empire corridor has projections of 2.3 million air passengers switching to high speed rail, but we found only 38,000 current annual direct flights between airports in the Empire corridor. Similarly, the number of passengers projected to switch to Cali<strong>for</strong>nia’s high speed rail system from air is 19 million, a volume that would result in 114 percent of today’s 192,000,000 annual direct flights in the corridor being cancelled. It may be that passenger projections in these corridors overestimate the number of travelers switching from air, in which case the emissions savings in these corridors would be overestimated as well. If one accounts <strong>for</strong> projected growth in air travel, as well as indirect flights and flights from outside the corridor, which were not included in our model, this level of mode switching is not impossible. It is worth further study to see if such high levels of mode shifting are likely. Such changes in ridership would have fundamental impacts on the transportation system. To draw so many air passengers to rail will require that high speed rail ticket prices be competitive with air and that service be as convenient and time-efficient. Cali<strong>for</strong>nia’s Big Impact The projected impacts of Cali<strong>for</strong>nia’s high speed rail system seem to be on a completely different scale than the other corridors. The emissions savings in Cali<strong>for</strong>nia are estimated to be approximately equal to the combined total savings from all other corridors. This is due to both the high projected ridership of the Cali<strong>for</strong>nia high speed rail corridor (42 million passengers in 2020) and the large percentage of passengers projected to switch from air to rail (45.8 percent). Only the Northeast corridor, which connects major population centers including New York and Washington, DC, comes close to the Cali<strong>for</strong>nia system in terms of projected ridership—it is estimated to have 25 million riders in 2020. In some respects, the Cali<strong>for</strong>nia system, as it is currently planned, represents what will be the second generation of high speed rail in many of the other corridors. While areas like the Pacific Northwest may increase ridership sooner with an incremental approach to high speed rail that uses existing rail routes, the success of a new high speed rail system like Cali<strong>for</strong>nia’s could prove the value of faster trains with higher upfront capital costs. The Unknown Impact of Bus and Conventional <strong>Rail</strong> We primarily relied on local corridor passenger projections <strong>for</strong> our analysis. Un<strong>for</strong>tunately, a number of the corridors do not estimate ridership by passengers diverted from intercity buses, or do so on a very limited basis. One explanation given <strong>for</strong> this is that intercity bus ridership data is proprietary to the private 13