High Speed Rail - Center for Neighborhood Technology
High Speed Rail - Center for Neighborhood Technology
High Speed Rail - Center for Neighborhood Technology

Create successful ePaper yourself
Turn your PDF publications into a flip-book with our unique Google optimized e-Paper software.
<strong>High</strong> <strong>Speed</strong> <strong>Rail</strong> and Greenhouse Gas Emissions – CCAP & CNT<br />
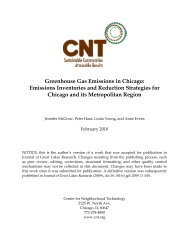
Figure 1 U.S. Potential <strong>High</strong> <strong>Speed</strong> <strong>Rail</strong> Corridors 5<br />
Methodology<br />
Using passenger projections and diversion rates, we calculated the carbon dioxide (CO2) emissions saved<br />
from passengers switching to high speed rail from other modes—air, conventional rail, automobile and<br />
bus—and subtracted the estimated emissions generated by high speed rail to estimate high speed rail’s net<br />
emissions impact. A more detailed description of this <strong>for</strong>mula is available in Appendix C.<br />
Passenger Projections<br />
Most of the high speed rail corridors have created planning documents <strong>for</strong> their proposed systems. We<br />
used these studies to model the potential greenhouse gas impacts of high speed rail. Our model used each<br />
corridor’s projected passenger levels, as well as in<strong>for</strong>mation on the transportation modes those passengers<br />
were diverted from (air, automobile, bus, conventional rail, or whether passengers were induced to travel<br />
based on the availability of high speed rail). We initially intended to use current travel patterns to build<br />
our estimates <strong>for</strong> future travel patterns given the availability of high speed rail, but we found that most of<br />
5<br />
Map of potential high speed rail does not include existing Northeast high speed rail between Washington, New York and<br />
Boston.<br />
5