High Speed Rail - Center for Neighborhood Technology
High Speed Rail - Center for Neighborhood Technology
High Speed Rail - Center for Neighborhood Technology

Create successful ePaper yourself
Turn your PDF publications into a flip-book with our unique Google optimized e-Paper software.
<strong>High</strong> <strong>Speed</strong> <strong>Rail</strong> and Greenhouse Gas Emissions – CCAP & CNT<br />
Appendix B<br />
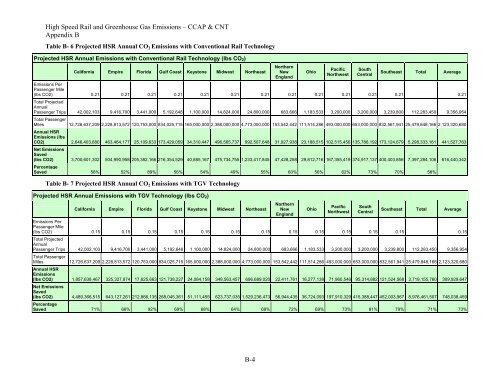
Table B- 6 Projected HSR Annual CO2 Emissions with Conventional <strong>Rail</strong> <strong>Technology</strong><br />
Projected HSR Annual Emissions with Conventional <strong>Rail</strong> <strong>Technology</strong> (lbs CO2)<br />
Cali<strong>for</strong>nia Empire Florida Gulf Coast Keystone Midwest Northeast<br />
B-4<br />
Northern<br />
New<br />
England<br />
Ohio<br />
Pacific<br />
Northwest<br />
South<br />
Central<br />
Southeast Total Average<br />
Emissions Per<br />
Passenger Mile<br />
(lbs CO2) 0.21 0.21 0.21 0.21 0.21 0.21 0.21 0.21 0.21 0.21 0.21 0.21 0.21<br />
Total Projected<br />
Annual<br />
Passenger Trips 42,002,103 9,416,700 3,441,000 5,192,648 1,100,000 14,824,000 24,800,000 683,666 1,183,533 3,200,000 3,200,000 3,239,800 112,283,450 9,356,954<br />
Total Passenger<br />
Miles 12,726,637,209 2,228,813,572 120,753,000 834,025,715 165,000,000 2,388,000,000 4,773,000,000 153,542,442 111,514,286 493,000,000 653,000,000 832,561,941 25,479,848,166 2,123,320,680<br />
Annual HSR<br />
Emissions (lbs<br />
CO2) 2,646,403,680 463,464,177 25,109,633 173,429,059 34,310,447 496,565,737 992,507,648 31,927,938 23,188,515 102,515,456 135,786,192 173,124,679 5,298,333,161 441,527,763<br />
Net Emissions<br />
Saved<br />
(lbs CO2) 3,700,601,302 504,990,958 205,382,166 216,354,529 40,885,167 475,734,755 1,233,417,845 47,428,258 29,812,716 167,355,419 374,917,137 400,403,856 7,397,284,106 616,440,342<br />
Percentage<br />
Saved 58% 52% 89% 56% 54% 49% 55% 60% 56% 62% 73% 70% 58%<br />
Table B- 7 Projected HSR Annual CO2 Emissions with TGV <strong>Technology</strong><br />
Projected HSR Annual Emissions with TGV <strong>Technology</strong> (lbs CO2)<br />
Cali<strong>for</strong>nia Empire Florida Gulf Coast Keystone Midwest Northeast<br />
Northern<br />
New<br />
England<br />
Ohio<br />
Pacific<br />
Northwest<br />
South<br />
Central<br />
Southeast Total Average<br />
Emissions Per<br />
Passenger Mile<br />
(lbs CO2) 0.15 0.15 0.15 0.15 0.15 0.15 0.15 0.15 0.15 0.15 0.15 0.15 0.15<br />
Total Projected<br />
Annual<br />
Passenger Trips 42,002,103 9,416,700 3,441,000 5,192,648 1,100,000 14,824,000 24,800,000 683,666 1,183,533 3,200,000 3,200,000 3,239,800 112,283,450 9,356,954<br />
Total Passenger<br />
Miles 12,726,637,209 2,228,813,572 120,753,000 834,025,715 165,000,000 2,388,000,000 4,773,000,000 153,542,442 111,514,286 493,000,000 653,000,000 832,561,941 25,479,848,166 2,123,320,680<br />
Annual HSR<br />
Emissions<br />
(lbs CO2) 1,857,638,467 325,327,874 17,625,663 121,738,227 24,084,158 348,563,457 696,689,020 22,411,761 16,277,138 71,960,546 95,314,882 121,524,568 3,719,155,760 309,929,647<br />
Net Emissions<br />
Saved<br />
(lbs CO2) 4,489,366,515 643,127,261 212,866,135 268,045,361 51,111,455 623,737,035 1,529,236,473 56,944,435 36,724,093 197,910,329 415,388,447 452,003,967 8,976,461,507 748,038,459<br />
Percentage<br />
Saved 71% 66% 92% 69% 68% 64% 69% 72% 69% 73% 81% 79% 71% 73%