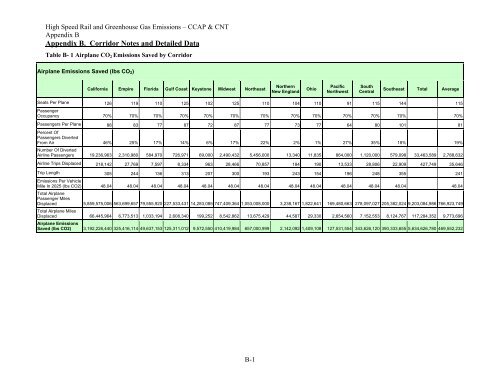
<strong>High</strong> <strong>Speed</strong> <strong>Rail</strong> and Greenhouse Gas Emissions – CCAP & CNT Appendix B Appendix B. Corridor Notes and Detailed Data Table B- 1 Airplane CO2 Emissions Saved by Corridor Airplane Emissions Saved (lbs CO2) Cali<strong>for</strong>nia Empire Florida Gulf Coast Keystone Midwest Northeast B-1 Northern New England Ohio Pacific Northwest South Central Southeast Total Average Seats Per Plane 126 119 110 125 102 125 110 104 110 91 115 144 115 Passenger Occupancy 70% 70% 70% 70% 70% 70% 70% 70% 70% 70% 70% 70% 70% Passengers Per Plane 88 83 77 87 72 87 77 73 77 64 80 101 81 Percent Of Passengers Diverted From Air Number Of Diverted 46% 25% 17% 14% 6% 17% 22% 2% 1% 27% 35% 18% 19% Airline Passengers 19,236,963 2,310,980 584,970 726,971 69,000 2,490,432 5,456,000 13,340 11,835 864,000 1,120,000 579,098 33,463,589 2,788,632 Airline Trips Displaced 218,142 27,769 7,597 8,334 963 28,466 70,857 184 190 13,533 28,806 22,909 427,749 35,646 Trip Length 305 244 136 313 207 300 193 243 154 196 248 355 241 Emissions Per Vehicle Mile In 2025 (lbs CO2) 48.04 48.04 48.04 48.04 48.04 48.04 48.04 48.04 48.04 48.04 48.04 48.04 48.04 Total Airplane Passenger Miles Displaced 5,859,575,006 563,699,657 79,555,920 227,533,431 14,283,085 747,409,364 1,053,008,000 3,238,167 1,822,641 169,480,663 278,097,027 205,382,024 9,203,084,986 766,923,749 Total Airplane Miles Displaced 66,445,964 6,773,513 1,033,194 2,608,340 199,252 8,542,862 13,675,429 44,587 29,330 2,654,560 7,152,553 8,124,767 117,284,352 9,773,696 Airplane Emissions Saved (lbs CO2) 3,192,226,440 325,416,114 49,637,153 125,311,012 9,572,550 410,419,984 657,000,999 2,142,092 1,409,108 127,531,554 343,626,120 390,333,655 5,634,626,780 469,552,232
<strong>High</strong> <strong>Speed</strong> <strong>Rail</strong> and Greenhouse Gas Emissions – CCAP & CNT Appendix B Table B- 2 Automobile CO2 Emissions Saved by Corridor Automobile Emissions Saved (lbs CO2) Cali<strong>for</strong>nia Empire Florida Gulf Coast Keystone Midwest Northeast B-2 Northern New England Ohio Pacific Northwest South Central Southeast Total Average Emissions Per Vehicle Mile In 2025 (lbs CO2) 0.85 0.85 0.85 0.85 0.85 0.85 0.85 0.85 0.85 0.85 0.85 0.85 0.85 Percent Of Passengers Diverted From Autos 42% 11% 69% 70% 5% 49% 2% 95% 86% 47% 44% 48% 47% Number Of Diverted Auto Passengers 17,598,881 1,074,212 2,374,290 3,582,927 55,000 7,222,253 496,000 646,974 1,011,921 1,504,000 1,408,000 1,565,709 38,540,167 3,211,681 Trip Length 301 207 136 130 150 130 193 225 94 139 205 221 178 Average Occupancy 1.60 1.60 1.60 1.60 1.60 1.60 1.60 1.60 1.60 1.60 1.60 1.60 1.60 Total Auto Passenger Miles Displaced 5,301,685,826 222,251,514 322,903,440 466,290,339 8,250,000 939,484,751 95,728,000 145,302,007 95,344,553 209,399,337 288,640,000 345,789,232 8,441,068,999 703,422,417 Total Miles Of Auto Trips Displaced 3,313,553,642 138,907,196 201,814,650 291,431,462 5,156,250 587,177,970 59,830,000 90,813,754 59,590,346 130,874,585 180,400,000 216,118,270 5,275,668,124 439,639,010 Auto Emissions Saved (lbs CO2) 2,808,767,913 117,746,117 171,070,269 247,034,884 4,370,748 497,727,461 50,715,516 76,979,215 50,512,371 110,937,192 152,917,920 183,194,880 4,471,974,488 372,664,541 Table B- 3 Bus CO2 Emissions Saved by Corridor Bus Emissions Saved (lbs CO2) Cali<strong>for</strong>nia Empire Florida Gulf Coast Keystone Midwest Northeast Northern New England Ohio Pacific Northwest South Central Southeast Total Average Seats Per Bus 50 50 50 50 50 50 50 50 50 50 50 50 50 Passenger Occupancy 70% 70% 70% 70% 70% 70% 70% 70% 70% 70% 70% 70% 70% Passengers Per Bus 35 35 35 35 35 35 35 35 35 35 35 35 35 Percent Of Passengers Diverted From Bus Number Of Diverted Bus 0% 1% 2% 2% 19% 0% 1% 7% 5% 9% 0% 4% Passengers 53,562 68,820 103,853 2,863,997 - 6,670 81,664 160,000 288,000 - 3,626,566 362,657 Bus Trips Displaced - 1,530 1,966 2,967 - 81,828 - 191 2,333 4,571 8,229 - 103,616 8,635 Trip Length 211 136 161 161 193 253 95 160 205 175 Bus Emission Per Vehicle Mile In 2025 (lbs CO2) 4.870 4.870 4.870 4.870 4.870 4.870 4.870 4.870 4.870 4.870 4.870 4.870 4.870 Total Bus Passenger Miles Displaced - 11,316,822 9,359,520 16,680,514 - 461,103,485 - 1,688,270 7,760,771 25,600,000 59,040,000 - 592,549,382 49,379,115 Total Bus Miles Displaced - 323,338 267,415 476,586 - 13,174,385 - 48,236 221,736 731,429 1,686,857 - 16,929,982 1,410,832 Bus Emissions Saved (lbs CO2) - 1,574,502 1,302,184 2,320,750 - 64,153,047 - 234,888 1,079,751 3,561,712 8,214,199 - 82,441,034 6,870,086