MT-003:Understand SINAD, ENOB, SNR, THD ... - Analog Devices
MT-003:Understand SINAD, ENOB, SNR, THD ... - Analog Devices
MT-003:Understand SINAD, ENOB, SNR, THD ... - Analog Devices

Create successful ePaper yourself
Turn your PDF publications into a flip-book with our unique Google optimized e-Paper software.
<strong>MT</strong>-<strong>003</strong><br />
TUTORIAL<br />
<strong>Understand</strong> <strong>SINAD</strong>, <strong>ENOB</strong>, <strong>SNR</strong>, <strong>THD</strong>, <strong>THD</strong> + N, and SFDR so<br />
You Don't Get Lost in the Noise Floor<br />
INTRODUCTION<br />
by Walt Kester<br />
Six popular specifications for quantifying ADC dynamic performance are <strong>SINAD</strong> (signal-tonoise-and-distortion<br />
ratio), <strong>ENOB</strong> (effective number of bits), <strong>SNR</strong> (signal-to-noise ratio), <strong>THD</strong><br />
(total harmonic distortion), <strong>THD</strong> + N (total harmonic distortion plus noise), and SFDR (spurious<br />
free dynamic range). Although most ADC manufacturers have adopted the same definitions for<br />
these specifications, some exceptions still exist. Because of their importance in comparing<br />
ADCs, it is important not only to understand exactly what is being specified, but the<br />
relationships between the specifications.<br />
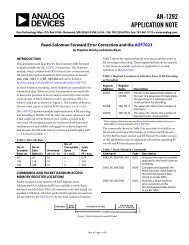
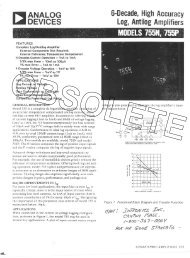
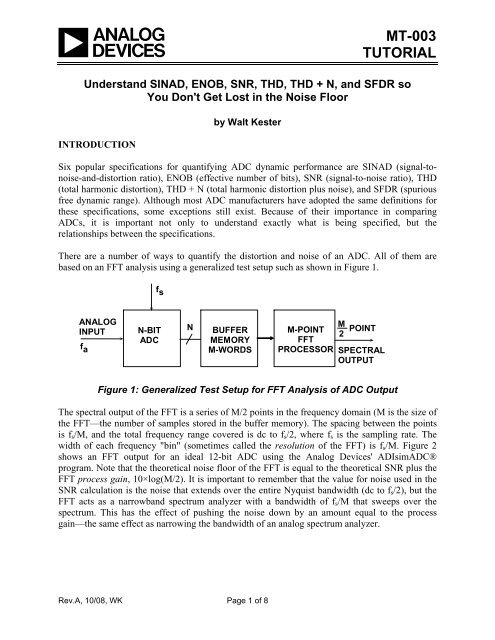
There are a number of ways to quantify the distortion and noise of an ADC. All of them are<br />
based on an FFT analysis using a generalized test setup such as shown in Figure 1.<br />
ANALOG<br />
INPUT<br />
f a<br />
f s<br />
N-BIT<br />
ADC<br />
N<br />
BUFFER<br />
MEMORY<br />
M-WORDS<br />
M-POINT<br />
FFT<br />
PROCESSOR<br />
M<br />
2 POINT<br />
SPECTRAL<br />
OUTPUT<br />
Figure 1: Generalized Test Setup for FFT Analysis of ADC Output<br />
The spectral output of the FFT is a series of M/2 points in the frequency domain (M is the size of<br />
the FFT—the number of samples stored in the buffer memory). The spacing between the points<br />
is fs/M, and the total frequency range covered is dc to fs/2, where fs is the sampling rate. The<br />
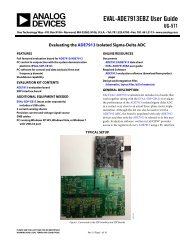
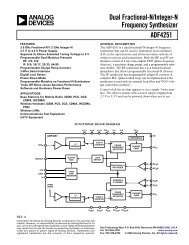
width of each frequency "bin" (sometimes called the resolution of the FFT) is fs/M. Figure 2<br />
shows an FFT output for an ideal 12-bit ADC using the <strong>Analog</strong> <strong>Devices</strong>' ADIsimADC®<br />
program. Note that the theoretical noise floor of the FFT is equal to the theoretical <strong>SNR</strong> plus the<br />
FFT process gain, 10×log(M/2). It is important to remember that the value for noise used in the<br />
<strong>SNR</strong> calculation is the noise that extends over the entire Nyquist bandwidth (dc to fs/2), but the<br />
FFT acts as a narrowband spectrum analyzer with a bandwidth of fs/M that sweeps over the<br />
spectrum. This has the effect of pushing the noise down by an amount equal to the process<br />
gain—the same effect as narrowing the bandwidth of an analog spectrum analyzer.<br />
Rev.A, 10/08, WK Page 1 of 8
<strong>MT</strong>-<strong>003</strong><br />
The FFT data shown in Figure 2 represents the average of 5 individual FFTs. Note that averaging<br />
a number of FFTs does not affect the average noise floor, it only acts to "smooth" the random<br />
variations in the amplitudes contained in each frequency bin.<br />
RMS QUANTIZATION NOISE LEVEL<br />
ADC FULLSCALE<br />
<strong>SNR</strong> = 6.02N + 1.76dB = 74dB<br />
10 log M<br />
2<br />
N = 12, M = 8192<br />
= 36dB<br />
DATA GENERATED USING ADIsimADC®<br />
FFT NOISE<br />
FLOOR = 110dB<br />
Figure 2: FFT Output for an Ideal 12-Bit ADC, Input = 2.111MHz,<br />
fs = 82MSPS, Average of 5 FFTs, M = 8192,<br />
Data Generated from ADIsimADC®<br />
The FFT output can be used like an analog spectrum analyzer to measure the amplitude of the<br />
various harmonics and noise components of a digitized signal. The harmonics of the input signal<br />
can be distinguished from other distortion products by their location in the frequency spectrum.<br />
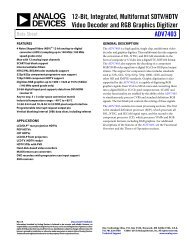
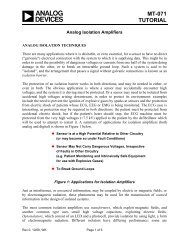
Figure 3 shows a 7-MHz input signal sampled at 20 MSPS and the location of the first 9<br />
harmonics. Aliased harmonics of fa fall at frequencies equal to |±Kfs ± nfa|, where n is the order<br />
of the harmonic, and K = 0, 1, 2, 3,.... The second and third harmonics are generally the only<br />
ones specified on a data sheet because they tend to be the largest, although some data sheets may<br />
specify the value of the worst harmonic.<br />
Harmonic distortion is normally specified in dBc (decibels below carrier), although in audio<br />
applications it may be specified as a percentage. It is the ratio of the rms signal to the rms value<br />
of the harmonic in question. Harmonic distortion is generally specified with an input signal near<br />
full-scale (generally 0.5 to 1 dB below full-scale to prevent clipping), but it can be specified at<br />
any level. For signals much lower than full-scale, other distortion products due to the differential<br />
nonlinearity (DNL) of the converter—not direct harmonics—may limit performance.<br />
Page 2 of 8
RELATIVE<br />
AMPLITUDE<br />
HARMONICS AT: |±Kfs ±nfa |<br />
n = ORDER OF HARMONIC, K = 0, 1, 2, 3, . . .<br />
3<br />
6<br />
HARMONICS<br />
4<br />
9 8 5 7<br />
1 2 3 4 5 6 7 8 9 10<br />
FREQUENCY (MHz)<br />
2<br />
f a<br />
= 7MHz<br />
HARMONICS<br />
f s = 20MSPS<br />
Figure 3: Location of Distortion Products: Input<br />
Signal = 7 MHz, Sampling Rate = 20 MSPS<br />
<strong>MT</strong>-<strong>003</strong><br />
Total harmonic distortion (<strong>THD</strong>) is the ratio of the rms value of the fundamental signal to the<br />
mean value of the root-sum-square of its harmonics (generally, only the first 5 harmonics are<br />
significant). <strong>THD</strong> of an ADC is also generally specified with the input signal close to full-scale,<br />
although it can be specified at any level.<br />
Total harmonic distortion plus noise (<strong>THD</strong> + N) is the ratio of the rms value of the fundamental<br />
signal to the mean value of the root-sum-square of its harmonics plus all noise components<br />
(excluding dc). The bandwidth over which the noise is measured must be specified. In the case of<br />
an FFT, the bandwidth is dc to fs/2. (If the bandwidth of the measurement is dc to fs/2 (the<br />
Nyquist bandwidth), <strong>THD</strong> + N is equal to <strong>SINAD</strong>—see below). Be warned, however, that in<br />
audio applications the measurement bandwidth may not necessarily be the Nyquist bandwidth.<br />
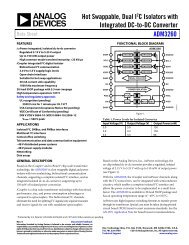
Spurious free dynamic range (SFDR) is the ratio of the rms value of the signal to the rms value<br />
of the worst spurious signal regardless of where it falls in the frequency spectrum. The worst<br />
spur may or may not be a harmonic of the original signal. SFDR is an important specification in<br />
communications systems because it represents the smallest value of signal that can be<br />
distinguished from a large interfering signal (blocker). SFDR can be specified with respect to<br />
full-scale (dBFS) or with respect to the actual signal amplitude (dBc). The definition of SFDR is<br />
shown graphically in Figure 4.<br />
Page 3 of 8
dB<br />
FULL SCALE (FS)<br />
INPUT SIGNAL LEVEL (CARRIER)<br />
SFDR (dBc)<br />
FREQUENCY<br />
SFDR (dBFS)<br />
Figure 4: Spurious Free Dynamic Range (SFDR)<br />
WORST SPUR LEVEL<br />
f s<br />
2<br />
<strong>MT</strong>-<strong>003</strong><br />
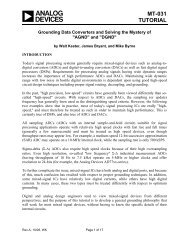
The <strong>Analog</strong> <strong>Devices</strong>' ADIsimADC® ADC modeling program allows various high performance<br />
ADCs to be evaluated at varioius operating frequencies, levels, and sampling rates. The models<br />
yield an accurate representation of actual performance, and a typical FFT output for the AD9444<br />
14-bit, 80-MSPS ADC is shown in Figure 5. Note that the input frequency is 95.111 MHz and is<br />
aliased back to 15.111 MHz by the sampling process. The output also displays the locations of<br />
the first five harmonics. In this case, all the harmonics are aliases. The program also calculates<br />
and tabulates the important performance parameters as shown in the left-hand data column.<br />
<strong>SINAD</strong> = 73.20dB<br />
<strong>SNR</strong> = 73.42dB<br />
<strong>THD</strong> = 86.31dB<br />
SFDR = 89.03dBc<br />
NOISE FLOOR = 109.67dB<br />
M = 8192<br />
Figure 5: AD9444 14-Bit, 80MSPS ADC fin = 95.111MHz, fs = 80MSPS, Average of 5<br />
FFTs, M = 8192, Data Generated from ADIsimADC®<br />
Page 4 of 8
<strong>MT</strong>-<strong>003</strong><br />
SIGNAL-TO-NOISE-AND-DISTORTION RATIO (<strong>SINAD</strong>), SIGNAL-TO-NOISE RATIO<br />
(<strong>SNR</strong>), AND EFFECTIVE NUMBER OF BITS (<strong>ENOB</strong>)<br />
<strong>SINAD</strong> and <strong>SNR</strong> deserve careful attention, because there is still some variation between ADC<br />
manufacturers as to their precise meaning. Signal-to-Noise-and-Distortion (<strong>SINAD</strong>, or S/(N + D)<br />
is the ratio of the rms signal amplitude to the mean value of the root-sum-square (rss) of all other<br />
spectral components, including harmonics, but excluding dc. <strong>SINAD</strong> is a good indication of the<br />
overall dynamic performance of an ADC because it includes all components which make up<br />
noise and distortion. <strong>SINAD</strong> is often plotted for various input amplitudes and frequencies. For a<br />
given input frequency and amplitude, <strong>SINAD</strong> is equal to <strong>THD</strong> + N, provided the bandwidth for<br />
the noise measurement is the same for both (the Nyquist bandwidth). A typical plot for the<br />
AD9226 12-bit, 65-MSPS ADC is shown in Figure 6.<br />
ANALOG INPUT FREQUENCY (MHz)<br />
Figure 6: AD9226 12-bit, 65-MSPS ADC <strong>SINAD</strong> and <strong>ENOB</strong><br />
for Various Input Full-Scale Spans (Range)<br />
The <strong>SINAD</strong> plot shows that the ac performance of the ADC degrades due to high-frequency<br />
distortion and is usually plotted for frequencies well above the Nyquist frequency so that<br />
performance in undersampling applications can be evaluated. <strong>SINAD</strong> plots such as these are very<br />
useful in evaluating the dynamic performance of ADCs. <strong>SINAD</strong> is often converted to effectivenumber-of-bits<br />
(<strong>ENOB</strong>) using the relationship for the theoretical <strong>SNR</strong> of an ideal N-bit ADC:<br />
<strong>SNR</strong> = 6.02N + 1.76 dB. The equation is solved for N, and the value of <strong>SINAD</strong> is substituted for<br />
<strong>SNR</strong>:<br />
<strong>SINAD</strong> −1.<br />
76 dB<br />
<strong>ENOB</strong> = . Eq. 1<br />
6.<br />
02<br />
Page 5 of 8
<strong>MT</strong>-<strong>003</strong><br />
Note that Equation 1 assumes a full-scale input signal. If the signal level is reduced, the value of<br />
<strong>SINAD</strong> decreases, and the <strong>ENOB</strong> decreases. It is necessary to add a correction factor for<br />
calculating <strong>ENOB</strong> at reduced signal amplitudes as shown in Equation 2:<br />
⎛ Fullscale Amplitude ⎞<br />
<strong>SINAD</strong>MEASURED<br />
− 1.<br />
76 db + 20log⎜<br />
⎟<br />
Input Amplitude<br />
<strong>ENOB</strong> =<br />
⎝<br />
⎠<br />
. Eq. 2<br />
6.<br />
02<br />
The correction factor essentially "normalizes" the <strong>ENOB</strong> value to full-scale regardless of the<br />
actual signal amplitude.<br />
Signal-to-noise ratio (<strong>SNR</strong>, or sometimes called <strong>SNR</strong>-without-harmonics) is calculated from the<br />
FFT data the same as <strong>SINAD</strong>, except that the signal harmonics are excluded from the<br />
calculation, leaving only the noise terms. In practice, it is only necessary to exclude the first 5<br />
harmonics, since they dominate. The <strong>SNR</strong> plot will degrade at high input frequencies, but<br />
generally not as rapidly as <strong>SINAD</strong> because of the exclusion of the harmonic terms.<br />
A few ADC data sheets somewhat loosely refer to <strong>SINAD</strong> as <strong>SNR</strong>, so you must be careful when<br />
interpreting these specifications and understand exactly what the manufacturer means.<br />
THE MATHEMATICAL RELATIONSHIPS BETWEEN <strong>SINAD</strong>, <strong>SNR</strong>, AND <strong>THD</strong><br />
There is a mathematical relationship between <strong>SINAD</strong>, <strong>SNR</strong>, and <strong>THD</strong> (assuming all are<br />
measured with the same input signal amplitude and frequency. In the following equations, <strong>SNR</strong>,<br />
<strong>THD</strong>, and <strong>SINAD</strong> are expressed in dB, and are derived from the actual numerical ratios S/N,<br />
S/D, and S/(N+D) as shown below:<br />
⎛ S ⎞<br />
<strong>SNR</strong> = 20log⎜<br />
⎟ , Eq. 3<br />
⎝ N ⎠<br />
⎛ S ⎞<br />
<strong>THD</strong> = 20log⎜<br />
⎟ , Eq. 4<br />
⎝ D ⎠<br />
⎛ S ⎞<br />
<strong>SINAD</strong> = 20log⎜<br />
⎟ . Eq. 5<br />
⎝ N + D ⎠<br />
Eq. 3, Eq. 4, and Eq. 5 can be solved for the numerical ratios N/S, D/S, and (N+D)/S as follows:<br />
N −<strong>SNR</strong><br />
/ 20<br />
= 10<br />
Eq. 6<br />
S<br />
D −<strong>THD</strong><br />
/ 20<br />
= 10<br />
Eq. 7<br />
S<br />
Page 6 of 8
N + D −<br />
= 10<br />
S<br />
<strong>SINAD</strong>/<br />
20<br />
<strong>MT</strong>-<strong>003</strong><br />
Eq. 8<br />
Because the denominators of Eq. 6, Eq. 7, and Eq. 8 are all equal to S, the root sum square of<br />
N/S and D/S is equal to (N+D)/S as follows:<br />
N<br />
S<br />
2 2<br />
1<br />
+ D ⎡<br />
⎛ N ⎞ ⎛ D ⎞<br />
⎤<br />
2 ⎡ −<strong>SNR</strong><br />
/ 20 2 −<br />
= ⎢⎜<br />
⎟<br />
⎢ S<br />
⎣<br />
⎝ ⎠<br />
Therefore, S/(N+D) must equal:<br />
and hence,<br />
+<br />
⎜<br />
⎝<br />
S<br />
⎟<br />
⎠<br />
⎥<br />
⎥⎦<br />
= 10<br />
⎢⎣<br />
⎜<br />
⎛<br />
⎝<br />
⎟<br />
⎞<br />
⎠<br />
+ ⎜<br />
⎛10<br />
⎝<br />
N + D ⎡ −<strong>SNR</strong><br />
/ 10 −<strong>THD</strong><br />
/ 10<br />
= 10 + 10 ⎤<br />
S ⎢⎣<br />
⎥⎦<br />
1<br />
−<br />
S −<strong>SNR</strong><br />
/ 10 −<strong>THD</strong><br />
/ 10<br />
= ⎡ 10 + 10 ⎤ 2<br />
N + D ⎢⎣<br />
⎥⎦<br />
1<br />
2<br />
<strong>THD</strong> / 20<br />
⎟<br />
⎞<br />
⎠<br />
2<br />
⎤<br />
⎥⎦<br />
1<br />
2<br />
, Eq. 9<br />
. Eq. 10<br />
, Eq. 11<br />
⎛ S ⎞ ⎡ −<strong>SNR</strong> / 10 −<strong>THD</strong><br />
/ 10<br />
<strong>SINAD</strong> = 20log⎜<br />
⎟ = −10log<br />
10 + 10 ⎤ . Eq. 12<br />
⎝ N + D ⎠ ⎢⎣<br />
⎥⎦<br />
Eq. 12 gives us <strong>SINAD</strong> as a function of <strong>SNR</strong> and <strong>THD</strong>.<br />
Similarly, if we know <strong>SINAD</strong> and <strong>THD</strong>, we can solve for <strong>SNR</strong> as follows:<br />
⎛ S ⎞ ⎡ −<strong>SINAD</strong>/ 10 −<strong>THD</strong><br />
/ 10<br />
<strong>SNR</strong> = 20log⎜<br />
⎟ = −10log<br />
10 −10<br />
⎤ . Eq. 13<br />
⎝ N ⎠ ⎢⎣<br />
⎥⎦<br />
Similarly, if we know <strong>SINAD</strong> and <strong>SNR</strong>, we can solve for <strong>THD</strong> as follows:<br />
⎛ S ⎞ ⎡ −<strong>SINAD</strong>/ 10 −<strong>SNR</strong><br />
/ 10<br />
<strong>THD</strong> = 20log⎜<br />
⎟ = −10log<br />
10 −10<br />
⎤ . Eq. 14<br />
⎝ D ⎠ ⎢⎣<br />
⎥⎦<br />
Equations 12, 13, and 14 are implemented in an easy to use design tool on the <strong>Analog</strong> <strong>Devices</strong>'<br />
website. It is important to emphasize again that these relationships hold true only if the input<br />
frequency and amplitude are equal for all three measurements.<br />
Page 7 of 8
SUMMARY<br />
Page 8 of 8<br />
<strong>MT</strong>-<strong>003</strong><br />
Because <strong>SINAD</strong>, <strong>SNR</strong>, <strong>ENOB</strong>, <strong>THD</strong>, <strong>THD</strong> + N, and SFDR are common measures of ADC<br />
dynamic performance, a complete understanding of them in the context of the manufacturers'<br />
data sheet is critical. This tutorial has defined the quantities and derived the mathematical<br />
relationship between <strong>SINAD</strong>, <strong>SNR</strong>, and <strong>THD</strong>.<br />
REFERENCES<br />
1. Walt Kester, <strong>Analog</strong>-Digital Conversion, <strong>Analog</strong> <strong>Devices</strong>, 2004, ISBN 0-916550-27-3,<br />
Chapter 6. Also available as The Data Conversion Handbook, Elsevier/Newnes, 2005,<br />
ISBN 0-7506-7841-0, Chapter 2.<br />
2. Hank Zumbahlen, Basic Linear Design, <strong>Analog</strong> <strong>Devices</strong>, 2006, ISBN: 0-915550-28-1.<br />
Also available as Linear Circuit Design Handbook, Elsevier-Newnes, 2008, ISBN-10:<br />
0750687037, ISBN-13: 978-0750687034. Chapter 6.<br />
Copyright 2009, <strong>Analog</strong> <strong>Devices</strong>, Inc. All rights reserved. <strong>Analog</strong> <strong>Devices</strong> assumes no responsibility for customer<br />
product design or the use or application of customers’ products or for any infringements of patents or rights of others<br />
which may result from <strong>Analog</strong> <strong>Devices</strong> assistance. All trademarks and logos are property of their respective holders.<br />
Information furnished by <strong>Analog</strong> <strong>Devices</strong> applications and development tools engineers is believed to be accurate<br />
and reliable, however no responsibility is assumed by <strong>Analog</strong> <strong>Devices</strong> regarding technical accuracy and topicality of<br />
the content provided in <strong>Analog</strong> <strong>Devices</strong> Tutorials.