Monitoring methane and nitrous oxide reduction by manure treatment
Monitoring methane and nitrous oxide reduction by manure treatment
Monitoring methane and nitrous oxide reduction by manure treatment

Create successful ePaper yourself
Turn your PDF publications into a flip-book with our unique Google optimized e-Paper software.
3 Evaluation of activity data<br />
Report 627<br />
In this chapter the availability, accuracy, traceability <strong>and</strong> frequency of actualization of the required<br />
activity data will be discussed.<br />
3.1 Amount of <strong>manure</strong> treated<br />
Recent data on the amount of <strong>manure</strong> treated in the Netherl<strong>and</strong>s are available from several sources.<br />
1) Monitor Renewable Energy (CBS, 2011).<br />
Quantitative data on the production of renewable energy is reported on an annual basis. Data are<br />
available on www.cbs.nl. Energy sources <strong>and</strong> calculation methodologies are described in the Protocol<br />
<strong>Monitoring</strong> Renewable Energy (AgentschapNL, 2010). Key sources of renewable energy are: wind<br />
energy, solar energy <strong>and</strong> energy from biomass. Within the source biomass co-digestion is<br />
distinguished. Co-digestion refers to production of biogas from digestion of <strong>manure</strong> together with other<br />
organic substrates. The monitor indicates that in 2009 1.5 Mton of wet biomass was digested, ample<br />
50% (0.8 Mton) of which was <strong>manure</strong>. This was 1-2% of the <strong>manure</strong> production in the Netherl<strong>and</strong>s.<br />
Data on the amount of digested <strong>manure</strong> <strong>and</strong> other organic substrates originates from an inquiry<br />
among farms in 2009 <strong>by</strong> CBS, with a 50% respons (van Bruggen, 2011b). This inquiry was carried out<br />
in favour of the monitoring of the <strong>manure</strong> market in the Netherl<strong>and</strong>s in 2010 (Luesink et al., 2011).<br />
Lacking data were estimated from the real electricity production data from the administration of CertiQ,<br />
that provides Source Guarantee certificates for green electricity (www.certiq.nl). These certificates are<br />
required for getting a subsidy, which is essential for profitable expoitation of the production facility.<br />
Therefore, the administration of CertiQ is a reliable <strong>and</strong> complete source of information concerning the<br />
amount of electricity produced from co-digestion. Quantitative data on the amounts of <strong>manure</strong> <strong>and</strong><br />
other substrates that are used is less accurate because they are partly based on an inquiry with 50%<br />
respons <strong>and</strong> partly calculated from electricity production data using assumptions for energy<br />
conversion efficiencies <strong>and</strong> caloric values of the substrates.<br />
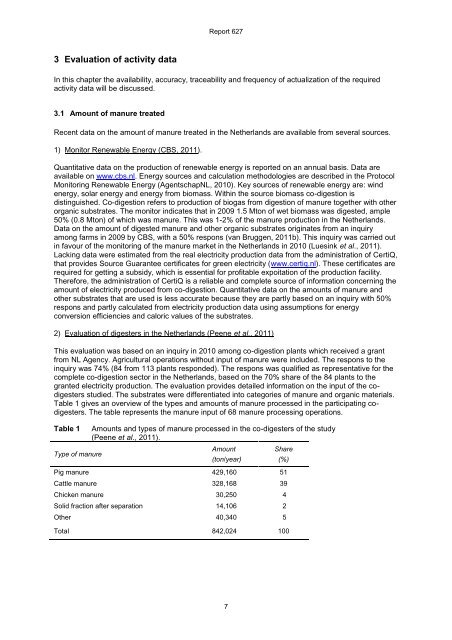
2) Evaluation of digesters in the Netherl<strong>and</strong>s (Peene et al., 2011)<br />
This evaluation was based on an inquiry in 2010 among co-digestion plants which received a grant<br />
from NL Agency. Agricultural operations without input of <strong>manure</strong> were included. The respons to the<br />
inquiry was 74% (84 from 113 plants responded). The respons was qualified as representative for the<br />
complete co-digestion sector in the Netherl<strong>and</strong>s, based on the 70% share of the 84 plants to the<br />
granted electricity production. The evaluation provides detailed information on the input of the codigesters<br />
studied. The substrates were differentiated into categories of <strong>manure</strong> <strong>and</strong> organic materials.<br />
Table 1 gives an overview of the types <strong>and</strong> amounts of <strong>manure</strong> processed in the participating codigesters.<br />
The table represents the <strong>manure</strong> input of 68 <strong>manure</strong> processing operations.<br />
Table 1 Amounts <strong>and</strong> types of <strong>manure</strong> processed in the co-digesters of the study<br />
(Peene et al., 2011).<br />
Type of <strong>manure</strong><br />
Amount<br />
(ton/year)<br />
7<br />
Share<br />
Pig <strong>manure</strong> 429,160 51<br />
Cattle <strong>manure</strong> 328,168 39<br />
Chicken <strong>manure</strong> 30,250 4<br />
Solid fraction after separation 14,106 2<br />
Other 40,340 5<br />
Total 842,024 100<br />
(%)