Practice Workbook, Grade 5 (PE) - East Penn School District
Practice Workbook, Grade 5 (PE) - East Penn School District
Practice Workbook, Grade 5 (PE) - East Penn School District

You also want an ePaper? Increase the reach of your titles
YUMPU automatically turns print PDFs into web optimized ePapers that Google loves.
Name<br />
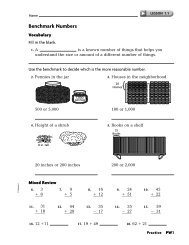
Choose the Appropriate Graph<br />
For 1–4, choose the best type of graph or plot for the data.<br />
Explain your choice.<br />
1. monthly high temperatures for a<br />
city over a 6-month period<br />
3. most popular athletic shoe brand<br />
in a class<br />
Draw the graph or plot that best displays each set of data.<br />
5. 6.<br />
Money Earned For Trip<br />
Week 1 2 3 4 5<br />
Amount $50 $40 $60 $80 $90<br />
Mixed Review<br />
For 7–8, use the table.<br />
7. What type of graph would<br />
you use to display the data?<br />
Explain.<br />
8. What number of pets do the most<br />
students own?<br />
PW42 <strong>Practice</strong><br />
LESSON 8.6<br />
2. heights of students in a class<br />
4. money spent on food each week<br />
over a 5-week period<br />
Favorite TV Network<br />
ABZ CAT DOG ROX CAN<br />
Sixth 510 20 20 30<br />
<strong>Grade</strong>rs<br />
Third<br />
<strong>Grade</strong>rs<br />
20 151530 5<br />
Pets Owned by Mr. Craig’s Students<br />
Number<br />
of Pets<br />
Number of<br />
Students<br />
9. 493,487 10. 946,493<br />
231,147<br />
<br />
0 1 2 3 4 5<br />
5 7 6 8 2 1<br />
128,518<br />
<br />
© Harcourt