Metal Casting
Metal Casting
Metal Casting

Create successful ePaper yourself
Turn your PDF publications into a flip-book with our unique Google optimized e-Paper software.
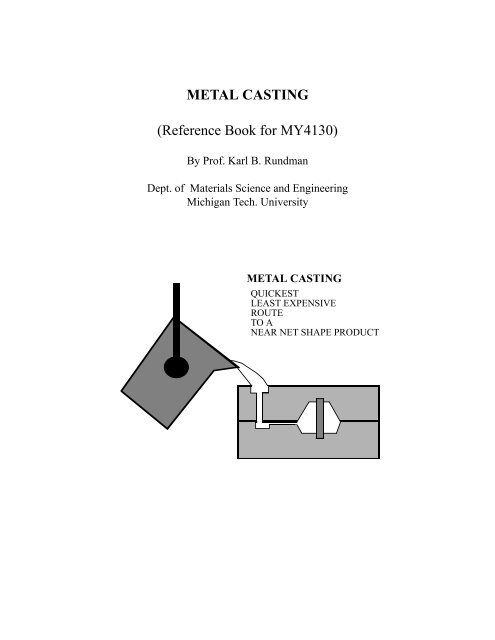
METAL CASTING<br />
(Reference Book for MY4130)<br />
By Prof. Karl B. Rundman<br />
Dept. of Materials Science and Engineering<br />
Michigan Tech. University<br />
METAL CASTING<br />
QUICKEST<br />
LEAST EXPENSIVE<br />
ROUTE<br />
TO A<br />
NEAR NET SHAPE PRODUCT<br />
-3
TABLE OF CONTENTS<br />
Page<br />
1. I. INTRODUCTION<br />
1. <strong>Metal</strong> <strong>Casting</strong>s, <strong>Metal</strong> <strong>Casting</strong> Process<br />
3. <strong>Metal</strong> <strong>Casting</strong> Design<br />
6. Pattern Design<br />
7. Rapid Prototyping<br />
10. II. SAND CASTING PROCESSES<br />
11. Sand Size Distribution<br />
11. Strength of Green Sand<br />
14. Permeability and Compactibility<br />
16. Temperature Dependence of Green Strength<br />
19. Chemically Bonded Molding and Core Sand<br />
22. Reclamation of Foundry Sand<br />
23. Sand Life Cycle<br />
24. Reclamation Systems<br />
26. III. OTHER CASTING PROCESSES<br />
26. Precision <strong>Casting</strong>; Cosworth Process<br />
27. Rheocasting & Thixocasting<br />
28. Lost Foam <strong>Casting</strong><br />
30. Die <strong>Casting</strong><br />
31. Squeeze <strong>Casting</strong><br />
32. Investment <strong>Casting</strong><br />
33. IV. MELTING OF METALS AND ALLOYS<br />
33. Energy and Material flow in Cupola Melting<br />
33. Cold Blast Cupola<br />
35. Heat of Combustion and Iron/Coke Ratio in Charge<br />
36. Energy of Melting and Energy Balance in Cupola<br />
39. V. FLUID FLOW AND GATING DESIGN<br />
39. Laws of Mass and Energy Conservation (Bernoulli’s Law)<br />
40. Velocity at Efflux Point (Mold Filling Time)<br />
41. Pressure at Intermediate Point in Gating System (Gas Aspiration)<br />
43. Number of Gates in System<br />
44. Fluidity of Molten <strong>Metal</strong>s<br />
45. VI. SOLIDIFICATION AND PROCESSING OF METAL CASTINGS<br />
45. Intrinsic and Extrinsic Factors<br />
46. Microscale-Dendritic Solidification<br />
46. Solidification on a Macroscale - Defect Production<br />
47. Controlled Thermal or Mechanical Treatment after <strong>Casting</strong><br />
47. Latent Heat of Solidification, Cooling Curves<br />
48. Steady State Heat Transfer Processes - Fick’s First Law<br />
49. VII. HEAT TRANSFER AND SOLIDIFICATION IN INSULATING MOLDS<br />
53. VIII. SHRINKAGE, RISER DESIGN<br />
53. Shrinkage in <strong>Metal</strong>s During Solidification<br />
-2
55. Macroshrinkage<br />
55. Microshrinkage<br />
56. Riser Design<br />
57. Calculation of Modulus of Riser and <strong>Casting</strong><br />
58. Location of Riser, Size and Shape of Riser<br />
60. Number of Risers<br />
61. <strong>Casting</strong> Yield<br />
62. IX. HEAT TRANSFER AND SOLIDIFICATION IN PERMANENT MOLDS<br />
63. Finite Element Analysis of Solidification - Die <strong>Casting</strong><br />
69. X. CONTINUOUS AND SEMI-CONTINUOUS CASTING<br />
69. Continuous <strong>Casting</strong> of Steel<br />
71. Semi-Continuous <strong>Casting</strong> of Al Alloys, Free Machining Brass<br />
72. Microstructure of Continuous and Semi-Continuous <strong>Casting</strong>s<br />
73. XI. SOLIDIFICATION, BINARY SYSTEM<br />
73. Equilibrium Solidification<br />
73. Non-equilibrium Solidification<br />
74. The Scheil Equation and Coring in Dendrites<br />
76. XII. ALUMINUM ALLOYS<br />
77. Aluminum <strong>Casting</strong> Alloys Processing<br />
77. Processing and Microstructure of Several Selected Al Si Base Alloys<br />
77. Alloy 356.2, Modification & Age Hardening<br />
79. Alloy 319.1, Grain Refinement with TiB<br />
80. Alloy KS281, Phosphorous as a Nucleation Agent for Proeutectic b.<br />
81. XIII. ADDITIVES TO MOLTEN METAL<br />
83. XIV. CAST IRON<br />
84. Phase Equilibria in Fe - C- Si System, Stable and Metastable Diagrams<br />
85. Gray Cast Iron, Section Size Effects and Inoculation, Chill Wedges<br />
91. Mechanical Properties of Gray Cast Iron<br />
95. Ductile Cast Iron, Production<br />
101. Microstructures of Hypereutectic Ductile Cast Irons<br />
103. Alloying of Cast Irons<br />
104. Mechanical Properties of Ductile Cast Irons<br />
106. Austempered Ductile Cast Iron<br />
110. Compacted Graphite Iron and Malleable Cast Iron<br />
114 XV. DEFECTS IN CASTINGS<br />
114. Gases in <strong>Metal</strong>s<br />
115. Hot Tears<br />
117. Residual Stresses in <strong>Casting</strong>s<br />
120. Residual Stress Measurements<br />
122. XVI. CAST STEEL<br />
122. Peritectic Reaction, Segregation of Alloy Elements During Solidification<br />
123. Segregation of Alloying Elements During Solidification of Steel<br />
125. Melting and Refining Steel<br />
126. Mechanical Properties of Cast Steel<br />
128. Weldability of Cast Irons and Steels<br />
130. Selective Surface Hardening of Cast Steels and Irons<br />
-1
131. XVII. CAST COPPER ALLOYS<br />
131. Brasses, Bronzes and Precipitation Hardening<br />
134. XVIII. HOMOGENIZATION OF CASTINGS<br />
139. XIX. ENVIRONMENTAL CONCERNS IN METAL CASTING<br />
140. Product Life Cycle and the Environmental Concern Envelope<br />
148. RCRA, Lead Flow in Foundries<br />
0
I. Introduction<br />
<strong>Metal</strong> <strong>Casting</strong>s<br />
<strong>Metal</strong> castings form integral components of devices that perform useful functions for<br />
human beings, an idea shown schematically below:<br />
ENERGY<br />
MATERIALS<br />
Design<br />
Engineer<br />
DEVICE<br />
<strong>Casting</strong><br />
I N F O R M A T I O N<br />
Pattern<br />
Maker<br />
The cast component has a shape, size, chemical composition and metallurgical microstructure<br />
which is determined by engineering decisions arrived at by:<br />
A. Design Engineers (Mechanical Engineers)<br />
B. Pattern Makers (Skilled craftsman, CAD)<br />
C. <strong>Casting</strong> Engineers ( <strong>Metal</strong>lurgical Engineers)<br />
D. Manufacturing Engineers (Mechanical, <strong>Metal</strong>lurgical Engineers)<br />
The engineering professionals that carry out this process work together, sharing information so<br />
that the casting will perform as intended in a timely and cost effective manner. It should be noted<br />
that the casting may only be a small part of the useful device (usually in more sophisticated<br />
devices like an automobile where there may be hundreds of components), or it may be the entire<br />
device (simple device like a frying pan).<br />
<strong>Metal</strong> <strong>Casting</strong> Process<br />
The metal casting process is the simplest, most direct route to a near net shape product,<br />
and often the least expensive. This process in its fundamental form requires a mold cavity of the<br />
desired shape and molten metal to pour into the mold cavity. Humans beings have been producing<br />
castings for thousands of years, most often pouring molten metal into molds made of sand. This is<br />
schematically shown below, a figure defining the basic components of a mold cavity (cope, drag,<br />
parting line, riser, sprue, pouring basin, etc.), as well as that part of the molten metal handling system<br />
known as a ladle. The production of molten metal and molds to make castings has traditionally<br />
been an art form, an expression of human creativity carried out both for aesthetic and<br />
practical reasons. The objective of metal casting has been to produce useful implements for<br />
human consumption as well as beautiful works of art. It is clear on examination of ancient art<br />
castings as well as modern industrial castings that their production requires significant skill as<br />
well as technological know how. The ancient artisan used traditions and learned skills passed<br />
down through the ages, as well as experience to produce acceptable castings. The modern pro-<br />
1<br />
<strong>Casting</strong><br />
Engineer<br />
USEFUL<br />
FUNCTION<br />
Manufacturing<br />
Engineer
ducer of industrial castings makes use of these same skills, but supplements them with an understanding<br />
of the fundamental principles of fluid flow, heat transfer, thermodynamics and<br />
metallurgical microstructural development.<br />
LADLE<br />
PARTING LINE<br />
<br />
<br />
<br />
<br />
SPRUE<br />
DRAG<br />
(Lower half of sand mold)<br />
These latter engineering skills are used to help design a system which will allow the metal caster<br />
to produce a sound (pore free) casting, free from defects (sand inclusions, slag, cracks, etc.), with<br />
the correct dimensions and combination of mechanical properties to satisfy the designer’s requirements<br />
for the intended application.<br />
Producing a “good” casting requires a design effort to:<br />
1. Create a gating system (pouring basin, sprue, runner) to bring molten metal into<br />
the mold cavity free from entrapped slag, sand or gases.<br />
2. Provide a riser which feeds liquid metal into the casting cavity as the liquid is<br />
cooling and solidifying (all liquid metals will shrink as they cool and most liquid<br />
metals will shrink as they solidify). The riser may have to provide up to 5 - 7% by<br />
volume for the casting as it solidifies.<br />
3. Control heat flow, Q in the above figure, out of the casting so that the last liquid<br />
to solidify is in the riser.<br />
4. Control the rate of heat flow so as to control the nature of the solidified product.<br />
Modern industrial castings are produced by a wide variety of processes, processes which<br />
are broadly defined in terms of: I. The type of mold material (sand, permanent, etc.); II. The manner<br />
in which the molten metal is introduced into the cavity (gravity, pressure, vacuum); III. The<br />
state of the metal (percent which is liquid); IV. The state of the mold cavity itself (air, vacuum,<br />
solid, gas).<br />
There are many examples of processes incorporating different combinations of the above<br />
which are illustrated in Table 1 below. Each process illustrated in this table can have many different<br />
variations within each category. For example sand casting can involve molds bonded with clay<br />
and water (so-called green sand mold) or the sand grains can be bonded with a chemical resin of<br />
some type(so-called chemically bonded sand); die casting can be high pressure, low pressure, etc.<br />
2<br />
MOLTEN METAL<br />
COPE (Upper half of sand mold)<br />
POURING<br />
BASIN CASTING CAVITY<br />
<br />
Q<br />
<br />
Q<br />
<br />
<br />
<br />
<br />
<br />
<br />
Q Q<br />
RUNNER<br />
CORE<br />
RISER
In addition, combinations of two different processes can be present in a given process, i.e. it is<br />
common to utilize semi-permanent molds in some processes, where the molds contain both metal<br />
and sand components. The combination selected for a given application depends upon the availability<br />
of processes, limited only by the creativity and engineering capability of the metal caster.<br />
<strong>Casting</strong><br />
Processes<br />
Table 1: <strong>Casting</strong> Processes, Mold and <strong>Metal</strong> Details<br />
I.<br />
Mold Material<br />
Sand <strong>Casting</strong> Sand( Bonded<br />
with clay and<br />
water or chemicals)<br />
II.<br />
Manner of Entry<br />
<strong>Metal</strong> <strong>Casting</strong> Design<br />
The principles of successful casting design involve a systematic blend of experience and<br />
engineering basics to allow the creation of a successful casting, from inception through production.<br />
The major components of the design process are outlined in the six steps listed below and<br />
described graphically and schematically in the figure shown.<br />
<strong>Casting</strong> Design Steps<br />
1. Physical Design of Part to be Cast<br />
3<br />
III.<br />
State of <strong>Metal</strong><br />
Gravity 100% Liquid Air<br />
Permanent Mold <strong>Metal</strong> Gravity 100% Liquid Air<br />
Die <strong>Casting</strong> <strong>Metal</strong> Pressure 100% Liquid Air<br />
IV.<br />
State of Mold<br />
Cavity<br />
Investment Ceramic Gravity 100% Liquid Air, Vacuum,<br />
Gas<br />
Lost Foam<br />
EPC<br />
Thixocasting<br />
Rheocasting<br />
Sand<br />
(Unbonded)<br />
Gravity 100% Liquid Styrofoam,<br />
PMMA<br />
<strong>Metal</strong> Pressure >50% Liquid<br />
Balance Solid<br />
Cosworth Sand Vacuum 100% Liquid Air<br />
V Process Sand(Unbonded<br />
with Vacuum<br />
and Enclosing<br />
Plastic Film)<br />
Centrifugal <strong>Metal</strong>, Graphite Centrifugal<br />
Forces<br />
Ingot - NOT<br />
Cast to Shape<br />
<strong>Metal</strong> or electromagnetic<br />
Field<br />
Air<br />
Gravity 100% Liquid Air<br />
100% Liquid Air, Gas Shroud<br />
Gravity 100% Liquid Air or Gas<br />
Shroud
Purpose of <strong>Casting</strong> (Size, Shape), Tolerances (manufacturing and engineering),<br />
Dimensional change in processes, Relationship of this Part to Others to Optimize<br />
its Design (Concurrent Engineering)<br />
2. Material Selection for Part to be Cast<br />
Mechanical and physical properties, castability, section size sensitivity, fluid flow<br />
properties<br />
3. Pattern Production For Molds and Cores<br />
Gating and Riser Design, Fluid flow and Heat Transfer<br />
4. <strong>Casting</strong> Process Selection, <strong>Casting</strong> Production<br />
Limitations due to metal cast, casting size, dimensional requirements<br />
Cost to Produce<br />
5. After <strong>Casting</strong> Processing<br />
Machining, heat treating, welding<br />
6. Evaluation of Cast Product<br />
The casting design process is an iterative procedure, requiring excellent communication in<br />
all steps of the process. This communication is illustrated through the use of arrows in the schematic<br />
below. Clearly the designer of the casting (often a mechanical engineer) needs to under-<br />
Evaluation<br />
(Mechanical & Physical Properties)<br />
CASTING DESIGN PROCESS ENVELOPE<br />
Part Design (Function - size & shape, relationship to other parts)<br />
<br />
Concurrent Engineering<br />
<br />
<br />
<br />
<br />
<br />
<br />
<br />
Material Selection and <br />
<br />
Fabrication <br />
<br />
Choice<br />
<br />
<br />
<br />
<br />
<br />
<br />
<br />
<br />
<br />
<strong>Casting</strong> Process <br />
<br />
<br />
Selection<br />
<br />
<br />
<br />
<br />
<br />
<br />
<br />
<br />
Solidification Simulation<br />
<br />
<br />
<br />
<br />
<br />
<br />
<br />
<br />
<br />
<br />
<br />
<br />
<br />
<br />
<br />
<br />
stand the fundamental material properties of the casting, its limitations as a material, and the<br />
limitations on the potential processes needed to produce that casting. General considerations by<br />
designers include: Minimize Section Size Changes; Eliminate Sharp Corners; Understand the<br />
Mechanical Property Requirements of the <strong>Casting</strong>, the Machining Requirements, Tolerancing, the<br />
Locating Requirements, the Handling Requirements, the Process Limitations, and How Statistical<br />
Methods Can Be Used in Process Control. It is important for the design engineer to always question<br />
the “old way” of making parts, to be aware of new technology so that the “design envelope”<br />
4<br />
Pattern & Tooling<br />
For Production in Foundry<br />
Costing the Job<br />
<br />
<br />
<br />
<br />
<br />
<br />
<br />
<br />
<br />
<br />
<br />
Fluid Flow Simulation<br />
<br />
<br />
<br />
Solidification <br />
Simulation<br />
<br />
<br />
<br />
<br />
Prototype Production<br />
<br />
<br />
<br />
<br />
<strong>Casting</strong> Production<br />
<br />
After <strong>Casting</strong> Processing (Machining, Welding, Heat Treatment)<br />
Final Part<br />
Final Part Shipped
can be stretched to its ultimate. Once the material to be cast has been selected and the casting process<br />
chosen, the designer will send drawings (CAD) to the foundry to answer the question, “Can<br />
this part be produced in a cost effective way as a casting?” Experienced pattern makers with the<br />
help of fluid flow and heat transfer experts (often metallurgical engineers) will proceed to lay out<br />
the requirements for the molds and the cores necessary to produce the part. At this point in the<br />
process, or even in the design stage, simulation of the solidification of the proposed part is a<br />
desirable activity. Modern computers are currently being used with powerful software<br />
packages to give a preview of solidification, illustrating in color and in real time the path of<br />
solidification in the casting. This methodology is important in reducing the time between<br />
design and prototype castings, in providing valuable insight to the designer and the person<br />
who does the gating and risering. Clearly a dialogue is needed between the pattern maker, the<br />
casting engineer, and the designer to produce tooling to make acceptable castings. This dialogue<br />
is illustrated as dashed lines on the above schematic. After the designer and pattern maker are satisfied<br />
that a viable casting is possible (a process enhanced by the ability of the participants to talk<br />
in the same computer language, and for each to have a working knowledge of the other’s problems),<br />
the foundry planning people will provide a cost estimate for the designer. Assuming that<br />
the cost estimate is within the realm of reality, patterns are produced for prototype castings. (If<br />
the cost is too high it will be necessary to return to the drawing board and ask more hard questions.)<br />
General considerations applied to the prototype castings by the casting engineer include:<br />
Evaluate Dimensional Accuracy; Quantify Microstructural Integrity (presence of required<br />
microconstituents, casting defects, porosity, shrinkage, other); Understand Response to Machining,<br />
Heat Treatment or Welding; Determine Mechanical Properties in Critical Sections. Rapid<br />
protoyping of castings is currently being used to reduce the time between design and cast<br />
parts. Stereolithography, Selective Laser Sintering, Fused Deposition Modeling, Laminated<br />
Object Manufacturing, Solid Ground Curing, and Direct Shell Production <strong>Casting</strong> are some<br />
of the methods used to produce patterns very quickly from the CAD models of the designer.<br />
These methods are described in a following section of this set of notes. It is also crucial that<br />
the casting engineer learn that dimensional tolerances are important and that he/she understand<br />
the source of the dimensional changes resulting from the casting process as well as the basic differences<br />
in achievable tolerances attained by different casting processes (i.e. lost foam vs green<br />
sand vs investment,etc.). Improvements in design can be suggested at this stage of the process as<br />
illustrated in the above schematic, improvements which produce a better casting while at the same<br />
time minimizing and reducing the cost and difficulty of production.<br />
Time Required to Complete the Design Process<br />
The time required to take a casting from the design stage through to satisfactory production<br />
will obviously depend upon many factors, but times ranging from 18 months (e.g., a new part<br />
produced by conventional processes or a minor change in an existing casting) to 5 years (e.g., a<br />
new part or combination of parts produced by a new process) is not uncommon. Clearly it is to<br />
everyone’s advantage to minimize this time, an effort aided by good communication between the<br />
various players in the drama, and in these times, wise use of solidification and fluid flow simulation,<br />
and rapid prototyping techniques. Two examples contrasting a new design with a redesign<br />
are given below.<br />
EXAMPLE: New Engine Design - Kohler - TH1416 Overhead Cam Engine (14 - 16 hp)<br />
Old Engine - Sand <strong>Casting</strong>s (Green Sand); 7 <strong>Casting</strong>s in Upper Half (2 cylinder<br />
Heads, 2 Cylinders, Upper Half of Block, Intake Manifold, Cam Housing), 4 in<br />
5
Lower Half (Lower Half of Block - Crank Housing, Stud Mounting Bosses, Oil<br />
Pump and Filter, Starter Housing). 319 Aluminum alloy (See section on kAl alloy<br />
castings for microstructure description)<br />
This engine had been produced for a number of years as 11 different sand castings<br />
and assembled to make a satisfactory engine.<br />
The need to reduce cost and still improve the product led the design team to<br />
consider new ways to produce castings. Enter the LOST FOAM process.<br />
New Engine - Replace the seven castings in the old design with one Lost Foam<br />
<strong>Casting</strong>. Replace the four castings in the old design with one Lost Foam <strong>Casting</strong>.<br />
In this process, 7 foam patterns are glued together to make one pattern for casting<br />
the upper half, and 4 foam patterns are glued together to make the lower half.<br />
These assemblies together with a sprue (the entry point for molten metal) then<br />
have sand compacted and vibrated around them prior to pouring the casting. This<br />
change from 11 separate castings to 2 castings eliminates many manufacturing<br />
steps, from machining to assembly. All of the gaskets and seals previously needed<br />
are eliminated. In this process even the oil passages are cast-in thereby eliminating<br />
the need to drill holes. 319 Aluminum alloy<br />
Time Line - There is a significant learning curve for the design team and the<br />
foundry which is producing the castings. This new design has been in process for<br />
about 3.5 years. Prototype castings have been produced and are being tested.<br />
EXAMPLE: Redesign of the Existing Head for a 3500 Series Caterpillar Engine, so that<br />
the engine would run cooler. Gray Cast Iron (See sections in these notes on gray<br />
iron describing the microstructure and properties)<br />
The designer came to the pattern shop with new ideas requiring larger water passages<br />
so that the engine would run cooler (Late 1994). Modifications of the pattern<br />
were made and prototype castings have been produced, with a very large reduction<br />
in the temperature at which the engine would run. It is expected that the new heads<br />
will be in production by late 1996.<br />
In this example the basic casting and the casting process remained the same, gray<br />
iron poured into green sand with suitable coring; thus a more rapid turn around<br />
time than the example of the change in casting process from green sand to lost<br />
foam.<br />
Pattern Design<br />
Pattern making is a time - honored skill which is an integral part of the casting process.<br />
Patterns are routinely produced from wood, plastics, and metals depending upon the complexity<br />
of the casting being produced, on the number of castings required and obviously on the capability<br />
of the pattern shop that is involved. The design of patterns must include the following components:<br />
1. An allowance for the solid state shrinkage that will always accompany the casting<br />
as it cools from the melting temperature to room temperature. This will depend upon the<br />
metal being cast, each of which will have its own unique coefficient of thermal expansion, α. For<br />
6
example, α for aluminum at 20 o C is 23.9 x 10 -6 in/in o C, for iron is 11.7 x 10 -6 in/in o C and that<br />
for copper is 16.5 x 10 -6 in/in o C (see page 50 - 51). Thus the linear dimensions of the pattern will<br />
always be larger than the casting by an amount determined by the linear expansion coefficient. Of<br />
course the expansion coefficients for each of the above materials will change somewhat with temperature<br />
and so the pattern maker will usually give a generous allowance to cover the temperature<br />
dependence of the expansion coefficient.<br />
2. Inclusion of a draft angle so that the pattern can be removed from the mold (or in<br />
the case of die casting or permanent mold casting, so the casting can be removed from the metal<br />
die) after the molding sand has been rammed around the pattern. These draft angles can vary from<br />
one casting to another but angles in the range 1 - 2 degrees are quite common.<br />
3. Inclusion of enough extra stock to allow for variations in casting dimensions due to<br />
mold preparation, pattern wear, etc. This amount will depend greatly upon the casting process<br />
being employed. For example the amount of “extra” stock will be typically greater for a sand casting<br />
than for a die casting. Machining and process tolerances are typically greater for sand castings<br />
than for permanent mold castings.<br />
Details on pattern making can be found in several publications form the American<br />
Foundry Society (AFS).<br />
Rapid Prototyping<br />
(Based on Dean Peters’ article in Foundry Management and Technology, June 1996)<br />
Rapid prototyping is a technology that allows the building of 3-D models (patterns or<br />
molds) by producing additive layer-by-layer CAT scan type slices of a pattern in plastics, waxes,<br />
or paper , or of CAT scan type slices of a mold in ceramics. “Perhaps no other technology since<br />
the invention of interchangeable parts and automated assembly lines has held as much promise for<br />
the compression of lead times for newly designed parts.”<br />
Some methods of accomplishing such useful work are described below:<br />
Stereolithography<br />
Stereolithography is the process by which three dimensional plastic objects are<br />
created directly from CAD data.<br />
A. Data received from a CAD file is “sliced” into thin, horizontal cross sections.<br />
B. Next, an ultraviolet, software-guided laser (HeCd), draws the first cross-section of the<br />
CAD design on the surface of a vat of ultraviolet sensitive photopolymer,or liquid<br />
plastic. Where the laser light touches the liquid photopolymer, it solidifies to the precise<br />
dimensions of the cross section.<br />
C. When the first layer is completed, an elevator within the system lowers the first solid<br />
plastic layer so the next layer can be applied, recoating the the solid layer with liquid<br />
photopolymer in preparation for the drawing of the next cross-section.<br />
D. The thickness of each layer ranges from 0.003 - 0.015 in.<br />
E. The process continues until the entire CAD file has been transformed into a solid<br />
model, prototype, or casting pattern.<br />
F. It is then removed from the vat and begins a brief final curing process after which it can<br />
7
Build<br />
Platform<br />
be sanded, plated, or painted.<br />
Cured Resin<br />
(Model)<br />
Scanning Mirror<br />
<br />
<br />
<br />
<br />
<br />
<br />
<br />
<br />
Laminated Object Manufacturing<br />
Laminated object manufacturing is a process by which three dimensional paper<br />
parts are produced by laser cutting of heat sensitive paper.<br />
A. A single beam laser cuts the outline of a part “slice” from a CAD file on a sheet of heat<br />
sensitive paper.<br />
B. Once the cross sectional outline is completed, another sheet of paper is layered on top<br />
of the first, and the configuration of the next slice is traced by the laser. Application of<br />
heat then bonds the second slice to the first, thereby producing the laminates.<br />
C. This cutting and laminating process is continued until the entire part is modeled.<br />
D. A prototype results with the approximate consistency of wood.<br />
Paper<br />
Take-up Roll<br />
X-Y Positioning<br />
Device<br />
<br />
<br />
<br />
<br />
<br />
Built-Up<br />
Part Block<br />
Optics<br />
<br />
<br />
<br />
<br />
<br />
<br />
<br />
<br />
8<br />
Laser<br />
<br />
<br />
Platform Lowers as Part is Built<br />
<br />
<br />
<br />
<br />
<br />
<br />
<br />
Platform<br />
<br />
<br />
Example Layer Outline and Crossshatck<br />
Laser<br />
Resin<br />
Support<br />
Lattice<br />
After Foundry, Sept 97<br />
Paper Supply Roll<br />
After Foundry, Sept 97
Selective Laser Sintering<br />
Selective laser sintering is a process by which three dimensional plastic objects<br />
are created directly from a CAD file.<br />
A. Data is received from a CAD file.<br />
B. A thin layer of heat-fusible powder (such as polystyrene, polycarbonate, polyamide) is<br />
deposited on the working platform of a sinterstation machine.<br />
C. The first cross section of the object is then traced out on the powder layer by a heatgenerating<br />
CO 2 laser. The temperature of the powder impacted by the laser beam is<br />
raised to the point of sintering, fusing the powder and particles and forming a solid<br />
mass.<br />
D. Another layer of powder is then deposited on top of the first, and the process is<br />
repeated until the finished prototype is complete.<br />
Fused Deposition Modeling<br />
Fused deposition modeling is a process by which three dimensional thermoplastic<br />
objects are built by depositing thermoplastic material in thin layers.<br />
A. Solid or surface data from a CAD file is mathematically sliced into horizontal layers.<br />
B. A temperature controlled head, driven by the CAD slices, extrudes a thermoplastic<br />
material (ABS, wax, polyamide) one layer at a time. The thermoplastic modeling<br />
medium is a 0.070 in. diameter filament that feeds into the temperature-controlled<br />
machine head, where it is heated to a semi-liquid state.<br />
C. The head extrudes and precisely deposits the material in thin layers onto a fixtureless<br />
base.The head is controlled by toolpath data that are downloaded to the FDM system,<br />
which operates on X, Y, and Z axes.<br />
D. As the material solidifies it fuses to the previously deposited layer.<br />
Solid Ground Curing<br />
Solid ground curing is a process by which photo-polymer resins are used to build<br />
up a 3D part.<br />
A. The process starts with a Unix-based cross section generation of CAD file data.<br />
B. An image of the first cross section is produced on an electrostatically charged erasable<br />
glass plate, forming a photo mask.<br />
C. A layer of photo-polymer resin is then spread on a flat work platform.<br />
D. An ultraviolet light projected through the photo mask solidifies the resin.<br />
E. The excess resin is then vacuumed away, and the solidified resin is surrounded by wax.<br />
F. The entire layer is then milled to a uniform thickness.<br />
G. This process (about 70 seconds per layer) is repeated until all cross sections are completed.<br />
H. The wax is then melted off to yield the completed prototype model.<br />
Direct Shell Production <strong>Casting</strong><br />
DSPC is a process in which a ceramic mold is produced by a layering process,<br />
thereby eliminating the need for a pattern.<br />
A. A mold is generated in a CAD file.<br />
9
B. A ceramic mold is built up by feeding ceramic powder to the CAD-generated slice in<br />
the shape of the mold cross section.<br />
C. The ceramic is followed closely by an ink jet printhead which deposits a liquid binder<br />
according to the part’s cross section.<br />
D. This is followed by another layer of ceramic and binder until the entire mold has been<br />
constructed.<br />
E. Once the mold is finished it can be poured with molten metal yielding the prototype<br />
casting directly.<br />
II. Sand <strong>Casting</strong> Processes<br />
Molding sands account for the production of the major quantity of castings. Sand is used in<br />
the ratio of as much as 10 tons of sand per ton of metal to as little as 1/4 ton of sand per ton of<br />
metal depending upon the type and size of casting and the molding method employed. The majority<br />
of castings are made in green sand molds, molds whose major components are sand (usually<br />
silica, SiO 2 ), clay such as bentonite, and water. The clay - water combination is responsible for<br />
the binding action between the sand grains, and can be present in various amounts from 5 to 50<br />
percent by weight. A typical green sand might contain 6 % clay and 3 % water, materials which<br />
are replenished as the molding sand is reconstituted and reused again and again. In the ideal<br />
world, the sand grains would be reused forever. In actual fact the sand grains themselves suffer<br />
some attrition due to mechanical, thermal, and chemical attack in the course of their use and so<br />
must be replaced on a consistent basis, usually through the production of cores. This “flow”of<br />
sand in a green sand foundry is illustrated below together with the flow of metal.<br />
Clay<br />
Water<br />
Molding Sand<br />
Preparation<br />
SAND AND MET AL FLOW<br />
Cores (New Sand)<br />
Mold Production<br />
Used Sand Molds<br />
Spent Sand<br />
Dust<br />
Clearly in a foundry which is at steady state (produces the same weight castings day in and day<br />
out) the amount of new sand added in cores must equal the spent sand and dust lost due to attrition<br />
or for other reasons. In fact in most foundries, perfectly good sand is landfilled every day so as to<br />
balance the flow of material into and out of a facility. In Michigan in 1991, approximately<br />
1,000,000 tons of sand was landfilled to produce about 1,000,000 tons of cast product. A little<br />
reflection by the reader will bring the realization that what comes into a volume (the Plant) must<br />
also leave, otherwise it is likely to get very crowded in a hurry (the law of continuity on a large<br />
scale).<br />
10<br />
Molten <strong>Metal</strong><br />
<strong>Casting</strong><br />
Operation<br />
Solid <strong>Metal</strong><br />
<strong>Casting</strong><br />
Returns
While silica is the molding media which is used in largest quantity, other sands are also utilized<br />
in the foundry for special applicatons, including chromite, olivine, garnet, carbon sands (petroleum<br />
cokes) and other refractory materials that can be obtained with a reasonable cost. Additives<br />
commonly used in molding sands includes cereal (finely ground corn flour) and wood flour (cob<br />
flour, cereal hulls) for improved flowability of sand and collapsibility after casting, sea coal (a finely<br />
ground coal) for improved surface finish, and many other materials which find use in special applications.<br />
Details on sand, additives, and testing of sands can be found in Principles of <strong>Metal</strong> <strong>Casting</strong> by<br />
Heine, Loper, and Rosenthal (1967), chapters 5 and 6, and in the AFS Sand and Core Testing Handbook.<br />
Sand Size Distribution<br />
The properties of molding sand depend strongly upon the size distribution of the sand that is<br />
used, whether it is silica, olivine, chromite, or other aggregate. A typical sand that could be used in a<br />
green sand foundry producing cast iron would have a sand size distribution which would be<br />
described by most of the sand residing in a size range which would be observed on four or five<br />
screens of a standard sieve size distribution. A typical distribution might look like the following:<br />
30<br />
25<br />
20<br />
15<br />
10<br />
5<br />
0<br />
10 100 1000<br />
AFS Mesh Size<br />
Details on desirable sand size distributions for specific casting situations and details on measurement<br />
of the size distributions can be found in the AFS literature.<br />
The Strength of Green Sand<br />
The strength of green sand is invariably determined with the aid of what is called a “standard<br />
rammed sample”, that cylindrical sample (when rammed 3 times in an AFS approved ramming<br />
device) which has dimensions of 2 inches in diameter by 2inches high. The strength of green sands<br />
depends upon a number of factors, including the clay and water content, the type of clay, the sand<br />
size distribution, the temperature of the sand, the amount and type of additive, the degree of mulling<br />
or mixing, the extent of compaction (number of rams of a testing machine), the adsorbed species (Na<br />
or Ca) etc. The data below indicates the effect of moisture for a four screen sand bonded with 7%<br />
western bentonite (montmorillonite clay with adsorbed Na + ) and 7% southern bentonite (montmoril-<br />
11<br />
Silica Sand
lonite clay with adsorbed Ca ++ ). The data points represent actual measured data in the MY 4130<br />
laboratory. It can be seen that the green compressive strength goes through an apparent maximum<br />
at about 3 wt % moisture.<br />
40<br />
35<br />
30<br />
25<br />
20<br />
15<br />
10<br />
5<br />
<br />
<br />
<br />
<br />
<br />
<br />
<br />
<br />
<br />
<br />
<br />
<br />
1 2 3 4 5 6 7<br />
Weight Percent Moisture<br />
Shear strength measurements are also used as an indicator of a green sand’s strength,<br />
where the 2” x 2” standard sample is sheared along the axis of the cylinder. Typically shear<br />
strength data is about one fourth that of compression results. This can be seen in the following<br />
laboratory data in which both green compression and green shear are plotted vs the number of<br />
rams:<br />
12<br />
"Four Screen Silica Sand"<br />
7 % Western Bentonite<br />
7 % Southern Bentonite
30<br />
25<br />
20<br />
15<br />
10<br />
5<br />
0<br />
Green Compression<br />
Green Shear<br />
Sand Data, 98<br />
1 10 100<br />
Number of Rams<br />
Perhaps the most sensitive strength measurement is the tensile measurement, because it is the<br />
binder which is being tested, pulled apart. The other strength tests, the compression and shear test,<br />
reflect not only the binder strength but also the interference of sand grains as they attempt to slide<br />
past one another under the shear stresses which are developed during the test. Unfortunately, the<br />
tensile test is a very difficult test to do in a consistent manner and is subject to very large scatter<br />
because of experimental inconsistencies. A careful study by Boenisch on the tensile strength of<br />
green sands as a function of the above variables has given a better perspective on the importance<br />
of the adsorbed species, especially where the warm strength (strength in the range 70 to 100 o C)is<br />
13
concerned. A schematic of the tensile strength vs moisture content for sand at room temperature<br />
containing 6% clay is given below.<br />
Tensile Strength in oz / in.<br />
40<br />
30<br />
20<br />
10<br />
0<br />
<br />
Density<br />
<br />
<br />
<br />
<br />
<br />
<br />
<br />
<br />
<br />
<br />
<br />
<br />
<br />
<br />
<br />
Strength<br />
<br />
<br />
<br />
<br />
<br />
<br />
<br />
<br />
<br />
<br />
<br />
<br />
Permeability<br />
<br />
0 2 4 6 8<br />
Weight Percent Moisture<br />
Permeability and Compactibility<br />
Two other properties of green sand molds which are quite important and measured routinely<br />
in an operating foundry are compactibility and permeability. Compactibility is a measure<br />
of the ability with which the clay-bonded sand can be packed around a pattern. It is a simple measurement<br />
in which loose sand is screened into a 2” diameter x 4” high cylinder and then a fixed<br />
pressure of 140 psi is impressed by a piston which slides into the cylinder (See AFS Mold and<br />
Core Sand Handbook for Details). This is a property which is very sensitive to the amount of<br />
moisture in the sand, and is represented below for a four screen sand tested in the MTU laboratory.<br />
14<br />
6% CLAY<br />
It can be seen that the strength<br />
increases to a maximum at about 3<br />
percent moisture for a 6 percent<br />
clay binder, then falls slowly out<br />
to 8 percent moisture. Increasing<br />
strength from 0 to 3 % reflects the<br />
taking on of water by the clay<br />
resulting in swelling of the clay<br />
particles,thereby pushing the sand<br />
particles apart, resulting in reduced<br />
density and increased permeability.<br />
At about 3% the clay becomes saturated<br />
with water; beyond this point<br />
the water merely fills space in the<br />
void volume, resulting in an<br />
increase in density and decrease in<br />
permeability and tensile strength..
50<br />
45<br />
40<br />
35<br />
30<br />
25<br />
20<br />
15<br />
Four Screen Silica - 7% Western Bentonite<br />
and 7% Southern Bentonite<br />
<br />
<br />
<br />
<br />
<br />
<br />
<br />
<br />
<br />
<br />
<br />
<br />
<br />
<br />
<br />
2 2.4 2.8 3.2 3.6<br />
Percent Moisture<br />
Permeability is a measure of the ease with which air can pass through the sand aggregate, a property<br />
which is very sensitive to the sand size distribution, mosture and clay content and degree of<br />
compaction. Again, details about this measurement can be obtained form the AFS Mold and Core<br />
Sand Handbook. Typical data for permeability vs % moisture and permeability vs number of rams<br />
for a four screen sand obtained at MTU are given below:<br />
180<br />
160<br />
140<br />
120<br />
100<br />
80<br />
60<br />
40<br />
<br />
<br />
<br />
<br />
<br />
<br />
<br />
<br />
<br />
<br />
<br />
<br />
Four Screen Silica Sand<br />
7% Western Bentonite, 7% Southern Bentonite<br />
<br />
<br />
<br />
<br />
<br />
<br />
2.5 3 3.5 4 4.5 5<br />
Percent Moisture<br />
It can be seen in the permeability vs. % moisture graph that as water is added, the permeability<br />
increases in a nearly linear manner due to the swelling action of the clay particles, thereby pushing<br />
the sand particles further apart and making more room for air passage. On the other hand,<br />
15
increasing the number of rams required to attain a 2” high specimen results in dramatic decrease<br />
in permeabillty, an apparent result of the closing off of some of the continuous air passages.<br />
180<br />
160<br />
140<br />
120<br />
100<br />
80<br />
60<br />
Sand Data, 98<br />
1 10 100<br />
Number of Rams<br />
Temperature Dependence of the Green Tensile Strength<br />
The profile of strength vs moisture shown above is interesting in that the strength appears to be a<br />
well-behaved function which relates directly to the ability of the clay particles to accomodate the<br />
water molecules into and onto the surface of the clay particles. In fact it is known that the water<br />
molecules effectively expand the hexagonal lattice of the clay by taking up residence between the<br />
basal plane layers of the structure. Measurements of the lattice spacing of the basal planes illustrated<br />
expansion in discrete steps corresponding to successive layers of water. At about 3 percent<br />
moisture the clay lattice cannot absorb any more water and so expansion ceases. As the sand heats<br />
16
up when in contact with the molten metal during casting, the strength properties will change dramatically<br />
as is illustrated in the schematic diagram below.<br />
No Sodium<br />
80 o C<br />
Percent Moisture<br />
Room Temperature<br />
The room temperature curve is typical of a sand bonded with Western Bentonite, whose clay mineral<br />
is predominantly montmorrilonite (Al 2 Si 5 O 5 (OH) 2 ). In addition the montmorrilonite has a<br />
significant quantity of adsorbed Na. It is thought that this adsorbed species plays an important role<br />
in maintaining the warm strength of green sand, a very important property in the short time that a<br />
casting is filling with molten metal and in the time before significant solidification has occurred.<br />
Boenisch and others have surmized that the bonding mechanism needed to explain the above temperature<br />
dependence requires two separate and distinct models of how the water is involved with<br />
the sand and the clay, a low moisture model involving polarized water molecules on both clay and<br />
sand and a high moisture model involving ionic bonds between the Na ions and the water molecules.<br />
The polar bonding at low moisture is referred to as rigid water bonding and the ionic water<br />
bonding at high moisture is referred to as bridge bonding. The polar bonds are thought to be quite<br />
weak and are very temperature dependent, while the ionic bonds are relatively strong and therefore<br />
less temperature dependent. Confirmation of the model comes when the adsorbed ionic species<br />
are removed from the clay by an ion exchange process; the result is the room temperature<br />
17<br />
95 o C<br />
Adsorbed Sodium
properties at high moisture dropping rapidly to zero as shown above.The two bonding models<br />
proposed are simply represented below:, where F represents a shear force<br />
F<br />
Sand<br />
Grain<br />
Rigid Water<br />
Bonding<br />
“Velcro Effect”<br />
Ionic Water<br />
Bonding<br />
Sand<br />
Grain<br />
F<br />
Clay<br />
Polar Bonds<br />
Rigid Water<br />
F<br />
“Bridge”<br />
F<br />
+<br />
Na+<br />
Clay<br />
Implications of the bonding in green sand molds for the quality of castings relates to events that<br />
occur in the short time while the metal is still molten, when any cracks or spalls in the sand surface<br />
could be filled with molten metal thereby resulting in defects on the surface of the casting.<br />
Defects produced at this time are affectionately called rattails, buckles and scabs. The scenario<br />
that promotes this situation is shown below:<br />
Dry Sand<br />
In Compression<br />
Molten <strong>Metal</strong><br />
When the molten metal hits the green sand surface, drying of the sand and evaporation of the<br />
water begins immediately.Water vapor is driven out into the cool green sand and condenses, raising<br />
the mean moisture content of the sand in the layer next to the dry warm sand. Of course, the<br />
dry sand is expanding as a result of the heating thereby putting the wet warm sand in tension. If<br />
the warm sand has no or little tensile strength the sand will fail making conditions ripe for buckling<br />
of the dry sand layer. If this happens before the molten metal has solidified the molten metal<br />
will penetrate the resulting buckle very quickly producing a surface defect on the casting.<br />
Surface defects on castings are, therefore, more prevalent when the warm wet strength of the sand<br />
is low. This condition occurs when the clay binder has insufficient quantity of the adsorbed spe-<br />
18<br />
Room Temperature Sand<br />
Warm, Wet Sand<br />
In Tension
cies which account for ionic bridge bonding, that portion of the bonding mechanism which is so<br />
important at high moistures and temperatures (see the Figure on the top of page 18).<br />
An example of the importance of bridge bonding occurred to a German foundry which experienced<br />
a rash of casting surface defects shortly after a change was made in the water supply for the<br />
foundry, a water supply which contained a large quantity of chloride ion content. It was eventually<br />
discovered that the chloride ion in the water supply was leaching the Na ion out of the binder,<br />
thereby reducing the bridge bonding capability. The sand strength was behaving in the manner<br />
predicted by the dotted line in the Figure on page 18.<br />
Chemically Bonded Molding and Core Sand<br />
A significant fraction of sand molds and virtually all cores are bonded chemically with<br />
from 1 -2 wt.% binder. The bulk of the binder materials are organic, although there are some inorganic<br />
binder systems as well. The three major categories of binders are I. Vapor Cured (Cold<br />
Box), II. No Bake, and III. Heat Cured. Details on each of these three categories are given below:<br />
I. Vapor Cured (Cold Box) - resin + sand + vapor<br />
Process - Mix resin with sand, Compact or Blow around room temperature pattern,<br />
React with Gas, Strip pattern from sand. Use about 1 - 1.5 % resin<br />
Examples:<br />
1. Sodium silicate + CO 2 gas (mid 50s)<br />
2. Furan + SO 2 gas (mid 70s)<br />
3. Phenolic Urethane + TEA or DMEA gas (early 70s)<br />
Advantages: No heat, rapid cure, good dimensional accuracy<br />
II. No Bake - Resin + sand + liquid catalyst<br />
Process - Mix resin with liquid catalyst, Compact or Blow around room temperature<br />
pattern, Strip Pattern, Wait for setting to be complete. 1 - 1.5 % resin<br />
Examples:<br />
1. Sodium silicate + liquid ester<br />
2. Phenolic Urethane + liquid amine<br />
3. Furan + phosphoric acid<br />
Advantages: no heat, higher strengths, good dimensional accuracy<br />
III. Heat Cured - (Hot Box) - resin + sand + heat<br />
Process - Sand is precoated with resin, Sand is blown or dropped onto hot pattern,<br />
Sand remains for a period of time until resin melts and bonding is complete, Pattern<br />
is stripped. Use about 2 - 3 % resin<br />
Examples:<br />
1. Oil Core - linseed oil - late 1600s<br />
2. Shell process - late 40s in Germany<br />
3. Furan and Phenolic<br />
Advantages: higher strength than cold box or no-bake, good dimensional accuracy.<br />
Chemically bonded cores and molds have in general much higher tensile strengths than<br />
green sand, typically in the range 100 - 500 psi, a strength which varies with amount of resin, type<br />
of resin, moisture level in core or mold,time after setting has begun, etc. The effect of the amount<br />
19
of resin on the tensile properties has been determined for a no-bake binder used at MTU called<br />
Novathane, a product of Ashland Chemical. This relationship is illustrated below:<br />
200<br />
160<br />
120<br />
Novathane<br />
0.7 0.8 0.9 1.0 1.1 1.2 1.3<br />
Weight Percent Resin<br />
The use of chemical binders for making molds has some obvious advantages; for example greater<br />
longevity of the mold and higher strengths . Because water is not a part of the bond in chemically<br />
bonded molds and cores, they do not have to be “poured off” immediately after preparation.<br />
Green sand will lose moisture with time, thereby shrinking and significantly affecting mold<br />
dimensions, not to mention the added possibility of having runouts on the parting line. Some<br />
chemically bonded sand molds have excellent longevity, can be kept on the shelf for extended<br />
periods of time and selected as needed. Unfortunately however, most chemically bonded sands<br />
will absorb some moisture from the air with time on the shelf, and become significantly weaker in<br />
the process. This is a much greater problem in the summertime than in the winter.<br />
The two to three orders of magnitude difference in tensile strength between green sand and chemically<br />
bonded sand can be understood by considering the nature of those bonds. Clay and water is<br />
extremely plastic (a result of the weak polar bonds), one sand grain sliding easily over another in<br />
response to a shear force. On the other hand, the chemical bond involves very strong directional<br />
bonding within the polymeric (or inorganic) chemical which has been formed in the reaction. As a<br />
result the plasticity of these types of bonds is very low compared to the clay-water bond. Of<br />
course, these high strengths are absolutely necessary for cores which almost always have much<br />
larger static stresses present than is observed in molds. Obviously the more intricate and smaller<br />
the core, the greater the need for strength. The amount of binder materials consumed in US found-<br />
20<br />
24 Hours after Stripping
ies over the last 35 years (and projected to the year 2000) is shown below. This graph gives an<br />
150,000<br />
100,000<br />
50,000<br />
Core Oil<br />
PUNB & PUCB<br />
Shell<br />
Other<br />
0<br />
Year 1960 1970 1980 1990 2000<br />
PUNB - Phenolic Urethane No Bake<br />
PUCB - Phenolic Urethane Cold Box<br />
From March, 1995 Foundry Management & Technology - Paul Carey<br />
indication of the importance of these binder materials in making cores and molds.Considering that<br />
the amount of resin used is about 1 - 2 % of the sand weight, the total amount of binder used in<br />
1990 (~130,000 tons) means that approximately 8.7 million tons of sand were used to bond cores<br />
and molds. The largest fraction is used in making cores, which in turn are largely used in green<br />
sand molds. This is consistent with the rough amount of sand delivered to landfills in 1990 of<br />
about 10 million tons. Recalling that axiom “What goes in must come out”, it is clear then that the<br />
majority of the sand ending up in landfills is a direct result of the addition of chemically bonded<br />
cores.<br />
The above figure illustrates the ebb and flow of technology in the relative amounts of the different<br />
kinds of binders used. Notice that the amount of oil core binder use (which made up the bulk of all<br />
binder used in 1960) is projected to almost disappear by the year 2000. The production of oil<br />
cores is time consuming, energy intensive and requires great care in handling; their production<br />
requires moving soft and easily deformed green cores into an oven to be cured. An excellent<br />
example of this proces can be observed at the Grede Foundry in Kingsford, MI, a frequent tour<br />
destination for the MY 4130 laboratory. The demise of oil cores has been replaced with other processes,<br />
most notably the use of phenolic urethane in cold processes (room temperature). This was<br />
in part a response to the energy crisis in the 1970s and 80s, where foundries worked hard to<br />
reduce their dependence on direct energy use to produce cores and molds. It is interesting to note<br />
that the shell process, which is heat activated and was discovered in the 1950s, is still an important<br />
player in the binder business. This is because shell molds and cores are much stronger than<br />
those produced by the cold process binders, and so have survived in many applications requiring<br />
higher strengths and good dimensional control. The shell process and the cold box phenolic urethane<br />
binder method can also be observed at the Grede foundry.<br />
21
Reclamation of Foundry Sand<br />
Reclamation of foundry sand means “to make like new”. As a result of the processes encountered<br />
by foundry sand before, during, and after the casting operation, many of the sand grains (both in<br />
the cores and the molds) are no longer as they were before the process began. As is true of most<br />
materials in service, sand experiences thermal, chemical, and mechanical inputs during its lifetime.<br />
Some of the specific examples of each of these are illustrated below:<br />
Thermal Stress - A sand grain close to the molten metal can experience severe thermal gradients<br />
from one side of the sand grain to another. The low thermal conductivity of this material means<br />
that fracture of the sand grain can occur due to the mismatch created when one side of the sand<br />
grain expands (hot side) while the cold side does not want to expand. Fractured sand grains mean<br />
that smaller particles are created, so-called fines, which are not desirable in a molding sand aggregate<br />
primarily because of the negative effect that fines have on the permeability of the sand. With<br />
silica sand, these problems of expansion and contraction are exaggerated because of the phase<br />
changes which silica sand goes through as it is heated to high temperatures.<br />
Chemical Change - The binders used to create aggregates that are bonded together before and<br />
after making castings can react with the sand grain or under the influence of heat be changed<br />
chemically so that the particular grain could be in a situation where it could no longer be readily<br />
bonded to other sand grains. The effectiveness of the binder would then be reduced. There are<br />
many specific examples of these kinds of situations between the clay binders used in green sands<br />
and the organic binders used to produce cores.<br />
Mechanical Stresses - The sand handling system provides a challenge for sand grains which are<br />
subjected to abrasion and impact by other sand grains. This happens primarily when the sand is<br />
being transported from one station to another within the foundry. This rough treatment can result<br />
in grain fracture or spalling which creates fines, and the problems the fines generate. The worst<br />
treatment comes in pneumatic systems where the grains are transported through tubes at high<br />
velocities, rubbing into and colliding with each other and the container. Transport on conveyors or<br />
in buckets minimizes this type of rough contact.<br />
An ideal sand handling system would, after the castings are produced, remove all of the fine particles<br />
in the system, scrub the unwanted chemical layers of of those grains that have been so<br />
affected, and take new sand into the system so that the proper sand size distribution is maintained.<br />
Unfortunately there are no ideal handling systems and each foundry must determine the quantity<br />
22
of new sand necessary to add to maintain the desirable properties of the sand. The effects of the<br />
above conditions on “Sandy the Sand” grain are shown below:<br />
Fresh Binder<br />
on Whole<br />
Sand Grain<br />
Happy Grain<br />
Reacted Binder<br />
on Fractured<br />
Sand Grain<br />
Sand Life Cycle<br />
A typical life cycle of foundry sand in a green sand foundry involves sand being transported<br />
through the process in the following way:<br />
1. Enter as new sand for core making<br />
2. Binder is combusted either completely or partially, freeing the sand grains to<br />
enter the green sand system to be reused over and over.<br />
3. Finally through attrition the sand grain leaves the system through the dust collector,<br />
or is purposely removed to make room in the system.<br />
This is illustrated in the following schematic<br />
Core Sand<br />
Core<br />
23<br />
Unhappy Grain<br />
Green Sand<br />
Molten <strong>Metal</strong> Mold<br />
“Shaken Out” <strong>Casting</strong><br />
Adhering Sand<br />
Removed in Cleaning<br />
Room and Sent to<br />
“Shaken Out” Sand<br />
Landfill or<br />
Reclamation
The “shaken out” sand contains sand in a variety of conditions depending upon the severity of the<br />
interactions (chemical, mechanical, thermal) within the sandhandling and prcessing system.<br />
These various components include:<br />
1. Green sand unaffected by the heat of the casting process (that sand removed from<br />
the immediate vicinity of the casting). This component would likely be the largest component<br />
and would include the warm wet sand illustrated in the sketch on page 18.<br />
2.Core sand in which the binder has been combusted to the extent that the sand<br />
grain is no longer bonded to its neighbors. This component will contain all degrees of combustion<br />
from sand which has been made “like new” by the heat of the process to grains which are still<br />
covered with partially combusted binder, or uncombusted binder which has fractured in handling<br />
or at shakeout. This component is likely to be the second largest component of the “shaken out”<br />
sand.<br />
3. Green sand in the immediate vicinity of the casting, the “heat affected sand”. This<br />
clay bonded sand will to a large extent have had its binder destroyed by the heat from the casting<br />
process. This component will also likely be quite large, again depending upon the casting size and<br />
shape.<br />
4. Core butts, those parts of the cores which have not been affected enough by the<br />
heat or mechanical handling during and after shakout to disintegrate. These chunks can<br />
make up a significant part of the shaken out sand, again depending upon the size of the cores, and<br />
especially upon the temperature of the metal poured (iron is much hotter than aluminum and<br />
therefore would be expected to better break down the cores in the casting).<br />
5. Dust and fines resulting from thermal and mechanical stresses of the process. This<br />
would make up a small fraction of the weight of the shakeout sand and would be removed in the<br />
dust collection system.<br />
In most green sand systems the core butts (No. 4 above) are screened out and sent to the landfill<br />
and the dust (No.5 above) is removed in baghouses or wet scrubbing systems. This leaves all of<br />
the remaining sand to reenter the green sand system for reuse where clay and water is added to<br />
newly bond the core sand component (which has no clay binder) and the burnt green sand component<br />
(which needs new binder). Unfortunately the component of burnt core sand which has not<br />
had the binder completely combusted does not readily accept the clay water binder and neither<br />
does the sand containing the burnt clay. Thus, unless a significant fraction of the green sand feed<br />
stock is removed from the system and new sand is added the properties of the green sand will<br />
diminish with time and casting quality will decrease. Most operating foundries will therefore<br />
simultaneously add new sand to the system and landfill a certain fraction of used system sand.<br />
This is an expensive process, especially when it costs more to “throw away” sand than it does to<br />
buy it new.<br />
Reclamation Systems<br />
At this point in time most foundries continue to landfill large quantities of sand,but<br />
because of the ever rising costs to landfill are seriously considering reclamation to make their<br />
throw away sand “like new”, to be used in the production of cores. This desire on the part of<br />
foundries has spawned a large number of companies which build reclamation systems. The bulk<br />
of these systems rely on thermal and mechanical methods to scrub or clean the sand grain surfaces.<br />
Chemical methods involve liquids, and handling large quantities of liquids simply generates<br />
a new environmental problem. As a result there are no foundries that anticipate cleaning sand<br />
grains chemically.<br />
24
Mechanical systems currently available involve vibrating screens, rapidly rotating impellers<br />
which throw sand against metal or rubber surfaces, and pneumatic systems which scrub sand<br />
grains against one another in a series of tubes. The objective in all of these processes is to separate<br />
one sand grain from another,to remove the spent binder from the surface of the grains, and to<br />
return the sand grain to the system ready for another coat of new binder.<br />
Thermal systems are designed to combust the sand grain surface layers (especially effective<br />
with partially or uncombusted organic core and mold binders), removing them to the atmosphere<br />
or a scrubber system to capture obnoxious combustion gases.<br />
Combinations of mechanical and thermal systems can be used to maximize the recovery<br />
of sand.<br />
These systems are designed to handle that portion of the sand system which was formerly<br />
thrown away, which includes core butts and the excess sand removed from the system to maintain<br />
sand quality. Unfortunately this latter component contains a significant quantity of sand which<br />
does not need reclamation, and a good fraction which does need reclamation goes merrily on its<br />
way to green sand processing. This dilemma results from the current shakeout practice which is<br />
designed to mix all of the above sand components together at the point of shakeout. Clearly a better<br />
way in principle would be to separate and segregate these components at shakeout. Consider<br />
an alternate system to the one on page 23 below:<br />
Core Sand<br />
Core<br />
This is truly an ideal system, one which design engineers should strive to develop.<br />
25<br />
Green Sand<br />
Molten <strong>Metal</strong> Mold<br />
<strong>Casting</strong> With Core<br />
and Burnt Green Sand<br />
Burnt Sand<br />
and Core Sand<br />
Sand<br />
Unaffected Sand<br />
Goes Direct To<br />
Reuse in System<br />
Reclamation<br />
Dust to Baghouse<br />
or Alternate Use
III. Other <strong>Casting</strong> Processes<br />
Precision <strong>Casting</strong> Processes<br />
This term implies near net shape (or as close as possible) and are designed to minimize or<br />
eliminate machining after casting. In general, because of the required tight dimensional tolerances<br />
these processes have molds which are very rigid; they can include permanent molds or very hard<br />
expendable molds. Processes which are considered to be precision casting processes include<br />
investment casting, die casting, permanent molding processes and the Cosworth process. Die casting<br />
and permanent molding processes involve using permanent molds together with either gravity<br />
casting(permanent molding) or pressure assisted casting (die casting). Investment casting and the<br />
Cosworth process utilize disposable molds produced with aggregate ceramic materials which are<br />
used only once.<br />
Investment casting has been used for centuries and the process is well known(see previous handout).<br />
Mold making is a time consuming process which necessarily drives up the cost of the product<br />
casting. In addition, removal of the casting from the mold and core assembly is often times<br />
difficult and time consuming as well. In some instances the fired refractory coating has to be<br />
removed by dissolution in caustic media.<br />
Cosworth Process<br />
The Cosworth process (referred to as the precision sand process) is a new process to produce aluminum<br />
alloy castings, developed in the mid 70’s to meet highly specialized needs of Formula One<br />
racing cars manufactured by Cosworth Engineering,Ltd. in England. In this process, molten metal<br />
COSWOR TH PROCESS<br />
Electric<br />
Holding<br />
Furnace<br />
& Pump<br />
Furan-bonded Zircon Sand Mold<br />
is pumped with an electromagnetic pump up into the mold from the bottom of the mold in a very<br />
controlled manner. Benefits include:<br />
1.Improved levels of accuracy and integrity<br />
2.Very little porosity<br />
26<br />
Inert Gas<br />
Controlled<br />
Bottom Filled<br />
Mold Using<br />
Electromagnetic<br />
Pump
3. Excellent surface detail<br />
4. Excellent mechanical properties<br />
5. Virtually no cleaning and finishing costs<br />
6. Minimum machining<br />
7.High casting yield<br />
The high casting yield results from the minimal gating system. Minimum porosity results from the<br />
controlled manner in which the molten metal enters the mold and the presence of an inert atmosphere<br />
over the molten metal.<br />
Rheocasting and Thixocasting<br />
Other casting processes which are innovative and have potential for future development include<br />
Rheocasting and Thixocasting.<br />
RHEOCASTING<br />
In rheocasting, the alloy is<br />
heated into the liquid phase<br />
• eld and then cooled back into<br />
the two phase liquid plus solid<br />
region, where it is stirred and<br />
subsequently injected as a slurry<br />
into a die.<br />
Liquid<br />
Solid<br />
As Stirred<br />
α<br />
α<br />
l +α<br />
Advantages of rheocasting include greatly reduced die wear because of the much lower injection<br />
temperatures, minimum shrinkage and greatly refined microstructural scale. Practical limitations<br />
include use with low melting point metals and those alloys with a wide freezing range. In addition<br />
specialized stirring equipment is needed to maintain liquid properties prior to injecting.<br />
In THIXOCASTING the alloy is heated only into the two phase region (to B)until it contains<br />
about 50 % solid and liquid. At this point the charge can still be handled as a solid, the liquid-solid<br />
mixture holding together by surface tension forces. This volume can then be placed into a die and<br />
then subjected to forces which result in the solid-liquid mixture flowing in response to those<br />
forces. It is said to be thixotropic(like catsup). Advantages include low energy costs for melting,<br />
minimization of shrinkage problems,distortion is kept to a minimum because of reduced temperature<br />
gradients, etc.<br />
27<br />
A<br />
B<br />
INJECTION<br />
l<br />
α + β<br />
l+β<br />
α + β<br />
β<br />
α<br />
As Solidi• ed
Lost Foam or Evaporative Pattern <strong>Casting</strong><br />
The lost foam process is an economical method of producing complex, close-tolerance castings,<br />
and in recent years has been growing in popularity by casting designers. Lost foam castings are<br />
Gating<br />
<strong>Casting</strong><br />
and Gating<br />
Pattern<br />
Assembly<br />
Refractory<br />
Coated<br />
Assembly<br />
Pattern in<br />
Vibrated Sand<br />
<strong>Casting</strong><br />
in Sand<br />
made (see above schematic) by preparing a pattern of polystyrene or polymethyl methacrylate,<br />
attaching it to a suitable gating system, coating the whole assembly with a refractory slurry (silica<br />
or alumina), and burying it in a bed of unbonded sand vibrated and jolted around the pattern. After<br />
this the molten metal is poured into the mold, vaporizing the pattern and replacing it with molten<br />
metal which subsequently solidifies. The sand is then removed and the casting retrieved.<br />
The patterns are dimensionally precise and often very complex. In principle there is no need for<br />
cores, thereby saving dramatically on space and materials in the foundry. The foam patterns are<br />
often assembled into clusters of castings (depending upon the casting) and dried before embedding<br />
in sand.<br />
The loose sand is vibrated to compact around the foam pattern, a critical step which has two purposes;<br />
the unbonded sand is transported into and around the nooks and crannies within the pattern<br />
and it is tightly packed to form a dimensionally stable aggregate which must remain without significant<br />
shifting during the casting process. Vibration parameters of significance are duration,<br />
direction, frequency, and amplitude.<br />
In principle both of the pattern materials mentioned will first melt and then vaporize when the<br />
molten metal is poured into the foam, releasing combustion products into the loose sand, where<br />
some of them promptly condense. Other products escape into the atmosphere where they are captured<br />
by the ventillation system and put through scrubbers. Unfortunately the actual sequence of<br />
28
events that occurs when metal hits foam is quite complex, depending upon the temperature of the<br />
molten metal and the foam being used. The two common foams used are described structurally<br />
and chemically below. It should be noted that the polystyrene contains a relatively stable benzene<br />
ring as a part of the monomer, a factor which inhibits combustion. On the other hand the PMMA<br />
has less carbon, does not contain a benzene ring and in addition contains oxygen, which aids in<br />
combustion. The net result is that the PMMA has less carbon deposition defects than the polystyrene.<br />
POL YSTYRENE POL YMETHYL METHACR YLA TE<br />
(Styrofoam®)<br />
(Plexiglass)<br />
H<br />
H<br />
H H<br />
C C<br />
H<br />
C<br />
C C<br />
C<br />
C<br />
H<br />
C<br />
H<br />
H<br />
92.3 % C<br />
7.7 % H<br />
Benzene ring inhibits combustion<br />
Recently one manufacaturer of marine engines has added a pressure chamber to their lost foam<br />
line. After pouring the casting the mold is inserted into a pressure chamber, the lid is closed and<br />
pressure is applied during the time that the casting is solidifying. This mechanical action reduces<br />
shrinkage porosity and refines the cast structure resulting in much improved fatigue properties.<br />
ADVANTAGES OF LOST FOAM PROCESS<br />
(Oct.,1990 , Foundry Management and Technology)<br />
1. Design freedom. Just about any shape is fair game. 2. <strong>Casting</strong> configuration flexibility. Thin<br />
walls, zero draft, backdrafts, undercuts & keyways. 3. Cast-in metal inserts are easily added to the<br />
pattern. 4.Prototype casting development time and cost usually greatly reduced. 5.Complex parts<br />
made in production quantities can become very cost competitive. 6.Coring required in most complex<br />
castings is no longer needed. 7.As-cast surfaces of most foam castings are quite acceptable.<br />
8. Parting lines and associated costs to grind them off are eliminated. 9. Machining costs reduced<br />
or eliminated because of tight tolerances and near net shape result. 10. Practically all metals and<br />
alloys can be cast by the process. 11.<strong>Casting</strong> quality is easily controlled by use of SPC techniques.<br />
CHALLENGES FOR LOST FOAM<br />
1. Emission problems associated with “blowing” foam patterns and with gases produced in the<br />
casting process. 2. Stability of foam patterns over time; i.e. shelf life. 3. Deformation of patterns<br />
during compaction. 4. Uniform vaporization of foam during casting and removal of combustion<br />
products. 5. Removal of refractory coating from casting surface.<br />
29<br />
H<br />
H<br />
H<br />
H<br />
C C<br />
C<br />
O<br />
C<br />
H<br />
O<br />
H<br />
55.8 % C<br />
7.0 % H<br />
37.2 % O<br />
Oxygen atoms aid combustion
DIE CASTING<br />
Die casting is a process whereby molten metal (usually a low melting point material like<br />
Al, Zn or Mg alloys) is injected under pressure into a permanent mold (usually a high melting<br />
point ferrous metal, a hot worked tool steel such as H-13 [0.35C, 1.5 Mo, 5 Cr, 1 V] or H-21 [0.35<br />
C, 9 W, 3.5 Cr] hardened to 45 - 48 RC).<br />
The pressure die casting process had its origin in typecasting (alloys of lead, antimony and<br />
tin) machines, which had reached a high level of automation and mechanical efficiency by the<br />
mid 1800s {Barton, “Die <strong>Casting</strong>: Past, Present, and Future.” Engineers Digest, 35, 9, 53 - 59<br />
(1974)}.<br />
The bulk of the die castings produced today are done by the Hot Chamber Process (mostly<br />
Zn base alloys) and the Cold Chamber Process (mostly Al base alloys). Schematic diagrams of<br />
these processes are illustrated below and are adapted from sketches of A.J. Clegg in his text “Precision<br />
<strong>Casting</strong> Processes”.<br />
COLD CHAMBER PRESSURE DIE CASTING<br />
Aluminum, Copper Base Alloys<br />
Plunger<br />
<strong>Metal</strong> In<br />
Shot Sleeve<br />
Die Set<br />
(Tool Steel)<br />
Fixed Platen Moving Platen<br />
HOT CHAMBER PRESSURE DIE CASTING<br />
Zinc Base Alloys<br />
In the hot chamber process, a significant part of the metal delivery system is in constant<br />
contact with the molten metal, thereby creating the opportunity for solution (dissolving) of the<br />
delivery system in the metal to be cast. Because of this tendency, the hot chamber machine is used<br />
exclusively for the production of the low melting point zinc base alloys. In the cold chamber<br />
machine, each “shot” is ladled into the shot sleeve prior to injection of the metal thereby minimizing<br />
the deterioration of the metal delivery system. Thus aluminum and copper base alloys are produced<br />
in the cold chamber machine.<br />
Because of the intimate contact between the molten metal and the high conductivity die<br />
sets, the castings solidify very rapidly in comparison to sand castings, often requiring only a few<br />
seconds between “shots”. Cores made of a water soluble salt are occasionally inserted into the die<br />
cavity before the shot and then dissolved in water after casting. Very complex castings (marine<br />
engine blocks) can be produced by this process.<br />
30<br />
Plunger<br />
Port<br />
Die Cavity<br />
Holding Furnace<br />
Molten<br />
<strong>Metal</strong>
Squeeze <strong>Casting</strong><br />
Squeeze casting is a hybrid machine casting process which combines features of forging<br />
and casting in one operation. Many die castings are produced in which there is no possible way to<br />
eliminate microshrinkage, situations in which the rate of solidification and the tortuosity of the<br />
paths available around the dendrites is such that fluid flow to feed shrinkage is nearly impossible.<br />
In these instances the casting is then left with the microshrinkage as inevitable defects, defects<br />
which can significantly reduce the fatigue properties and ductility of these materials.<br />
In the squeeze casting process described schematically below, the press force effectively squeezes<br />
out the shrinkage porosity that otherwise would not be able to be removed by risering practice, the<br />
movable punch exerting a force on the casting while it is solidifying.<br />
Press Movement<br />
Movable Punch<br />
Squeeze - Cast<br />
Component<br />
Molten <strong>Metal</strong><br />
Stationary Die Half<br />
Ejector Pin<br />
In addition to eliminating shrinkage porosity, the process also alters the solidification structure,<br />
breaking up dendrites,thereby refining the structure, and even reducing the dendritic arm spacing<br />
because of the improved heat transfer properties associated with the intimate contact between the<br />
dies and the casting. In normal die or permanent mold castings this intimate contact is lost<br />
because of the casting shrinking away from the die interface as cooling occurs.<br />
31<br />
Press Force<br />
During Solidi• cation<br />
Press Open Press Closed
Investment <strong>Casting</strong> (Lost Wax Process) -<br />
Text from “Foundry Management and Technology”,(1989)<br />
In investment casting, a ceramic slurry is poured around a disposable pattern (normally of<br />
modified paraffin waxes, but also of plastics) and allowed to harden to form a disposable mold.<br />
The pattern is destroyed when it melts out during the firing of the ceramic mold. Later molten<br />
metal is poured into the ceramic shell mold, and, after the metal solidifies, the shell mold is broken<br />
up to remove the casting. The flow and process diagram schematic is shown as follows:<br />
Wax Pattern<br />
Investment of<br />
Slurry on Pattern<br />
Drying<br />
(Removes Moisture,<br />
Developes Strength)<br />
More Investment of<br />
Slurry on Pattern<br />
Drying<br />
More Investment of<br />
Slurry on Pattern<br />
Drying<br />
Up to 7<br />
Cycles of<br />
Investment<br />
&Drying<br />
This gives<br />
7 Layers of<br />
Investment<br />
Advantages of the investment casting process include:<br />
1. Mass Production of Complex Shapes is possible.<br />
2. Reproduction of fine details is possible, with tighter dimensional tolerances than usually<br />
acheived by other commercial casting processes.<br />
3. The process is adaptable to practically any metal.<br />
4. Parts do not vary in dimension across parting lines.(Parting lines are not normally present.)<br />
5. The process is adaptable to the melting and pouring of alloys that must be poured in a vacuum<br />
or under an inert atmosphere.<br />
6. The process permits close control of microstructure - grain size, grain orientation, directional<br />
solidification - that determines the mechanical properties of the cast part.<br />
The investment process creates a significant amount of spent waxes and ceramic shells. Much of<br />
the wax can be reused in gating and riser parts where precision is not required. The same is true<br />
32<br />
Melting &<br />
Removing Wax<br />
Firing<br />
Fired Ceramic<br />
Coating<br />
Pouring <strong>Metal</strong><br />
into Hot, Fired<br />
Ceramic Shell<br />
Knockout<br />
<strong>Casting</strong> &<br />
Remove<br />
Ceramic<br />
Investment<br />
<strong>Casting</strong>
for the spent ceramic molds, which can be crushed and reused in some of the outer layers where<br />
precision is not required.<br />
IV. Melting of <strong>Metal</strong>s and Alloys<br />
Melting is accomplished in metal casting facilities by combustion of fossil fuels or by the<br />
use of electrical energy. The most common melting furnaces in foundries include the cupola (cast<br />
iron), electric induction (cast iron, steel, aluminum), electric arc (cast iron and steel), and gas fired<br />
crucible furnaces(aluminum and other non-ferrous). The cupola, a stack furnace described in the<br />
next section, utilizes metallurgical coke as the fuel. Electric induction furnaces provide power to<br />
the metal charge by inducing eddy currents in that charge with a high power, high frequency alternating<br />
current. Electric arc furnaces heat directly by striking an arc between graphite electrodes<br />
and the charge in the furnace. Gas fired crucible furnaces usually involve combustion of natural<br />
gas immediately outside a crucible containing the charge. Because of the complexity of the melting<br />
process in a cupola and because a large fraction of the cast iron produced in the world is<br />
melted in cupola’s, the next section will treat in detail the melting process and energy transfer in<br />
modern cupola melting. Details on the other melting furnaces can be found in other texts on the<br />
subject.<br />
Energy and Material Flow in Cupola Melting<br />
The diagram on page 34 depicts schematically the inputs and outputs of material and<br />
energy associated with melting in a cupola furnace for the production of hot metal (cast iron). Significant<br />
energy inputs include coke combustion, electricity for air injection, and natural gas combustion<br />
for combustion air preheating and/or combustion of excess CO in an afterburner.<br />
Significant energy outputs include molten iron with adequate superheat, slag at the same temperature<br />
as the iron, heat losses by conduction through the walls, and exhaust heat losses “up the<br />
stack”.<br />
The diagram illustrates two methods to preheat combustion air (to create a hot blast) entering the<br />
cupola; the recuperative method (Alternate I) which makes use of the hot exhaust gases to preheat<br />
intake air, and the direct heating of intake air with natural gas (Alternate II).The chemical reactions<br />
shown represent the major exothermic (EX) and endothermic (EN) reactions occurring<br />
within the cupola at approximately the position shown.<br />
Cold Blast Cupola<br />
In a cold blast cupola, air (23% by weight O 2 and 77% by weight N 2 ) is blown into the<br />
tuyeres at a blast rate (units of cubic feet per minute, cfm) determined by the rate of charge flow<br />
and the required hot metal temperature. The iron charge, often containing equal amounts of scrap<br />
steel (of composition approximately 0 - 0.4 wt. % carbon and 0.3 wt. % silicon) and cast iron<br />
returns (containing carbon in the range 3 - 3.6 wt. % and silicon in the range of 2 - 3 wt. %), is<br />
added at the charge door together with limestone (flux) and coke, which (1) provides fuel for the<br />
melting process, and (2) provides carbon to bring the scrap steel composition up to the range 3 -<br />
3.6 wt.% carbon. In addition silicon is added to bring the silicon content of the steel charge component<br />
up to that of cast iron; this is usually in the form of silicon carbide (SiC) or ferrosilicon<br />
(FeSi). It is assumed from here on that the only source of carbon in the charge (other than that in<br />
the steel and iron) is in the coke.This mix is charged into the cupola at a rate balanced with the<br />
blast rate so that preheating, melting, and superheating of the charge occurs giving hot metal at the<br />
desired chemical composition and temperature at the tap hole (at the base of the furnace).<br />
33
The major heat-generating reaction within the cupola is ):<br />
C + O 2 -> CO 2 (Exothermic with 14550 BTU/ pound carbon).<br />
It is thought that CO is generated by reduction of CO 2 by the reaction<br />
CO 2 + C -> 2CO,<br />
but for heat balance purposes the reaction<br />
2C + O 2 -> 2CO (Exothermic with 4350 BTU/pound carbon)<br />
is used. It can be seen that the most efficient use of carbon would be to combust completely to<br />
CO 2 . Unfortunately this situation would result in excess oxidation and thus loss of expensive silicon<br />
additions as well as Fe (and other more expensive elements as well) in the manner:<br />
Si + O 2 -> SiO 2 and<br />
Fe + CO 2 -> CO + FeO .<br />
Therefore to avoid large losses of Si and Fe, the blast is kept deficient in O 2 so that a significant<br />
amount of CO is generated to provide a reducing atmosphere within the cupola.<br />
Natural Gas<br />
Charge<br />
(Ambient Temp)<br />
Iron Units<br />
Coke (Fuel & Carbon)<br />
Limestone<br />
Silicon Units<br />
CaCO 3 -> CaO + CO 2 (EN)<br />
Fe + CO 2 -> FeO + CO (EX)<br />
CO2 + C -> 2CO (EN)<br />
C + O 2 -> CO 2 (EX)<br />
C solid -> C melt<br />
Hot <strong>Metal</strong><br />
2600-2800 o F<br />
Slag<br />
Tuyere<br />
Afterburner<br />
Preheating<br />
Zone<br />
Calcination<br />
Zone<br />
Iron Melt<br />
Zone<br />
Steel Melt<br />
Zone<br />
Flame Zone<br />
Coke<br />
Bed<br />
Tuyere<br />
34<br />
Alternate I<br />
Hot Blast<br />
Heat Loss<br />
Hot Blast<br />
Cold Blast<br />
Hot Blast<br />
Natural Gas<br />
Recuperator<br />
Exhaust Gas<br />
Hot Air<br />
Forced Air<br />
Blower<br />
Hot Air<br />
Preheater<br />
Alternate II<br />
Hot Blast<br />
Air<br />
KWH<br />
Air
Heat of Combustion and Iron/Coke Ratio in Charge<br />
The iron to coke ratio (Fe/Coke) will typically vary in the range 6/1 to 11/1, depending<br />
upon cupola size, availability of hot blast, coke breeze injection or any combination of these factors.<br />
Clearly a bigger Fe/Coke ratio means less fuel per ton of iron and therefore potentially less<br />
heat available for melting. For illustrative purposes let us assume a charge with 2000 pounds of<br />
iron units (1/2 iron returns and 1/2 scrap steel). The weight of coke, carbon in coke, carbon available<br />
as fuel (CA), and ratio of available carbon to iron (C*) is given in Table 2 below for Fe/Coke<br />
ratios of from 6 -> 11.<br />
Table 2: Coke and Carbon Availability with a 50 % Returns - 50% Steel Mix.<br />
Iron/Coke Ratio (1 ton Fe) 6 7 8 9 10 11<br />
Coke (Lb/Ton Fe) 333 285 250 222 200 182<br />
C (0.9 Coke) (Lb / Ton Fe) 300 257 225 200 180 164<br />
C as Fuel, CA(Lb./ Ton Fe)1 268 225 193 168 148 132<br />
C* = CA / Fe (Lb C / Lb Fe) 0.134 0.1125 0.0965 0.084 0.074 0.066<br />
1. Assuming that 32 pounds of Carbon are needed to carburize the scrap steel in the charge.<br />
Table 3 includes the energy availability from this carbon (in million BTU per ton of iron) for combustion<br />
to CO 2 , to CO, and to three combinations with different CO/CO 2 ratios (volume percent<br />
of combustion gas, including nitrogen).<br />
Table 3: Energy Availability For Different Fe/Coke and CO/CO 2 Ratios<br />
Iron/Coke Ratio 6 7 8 9 10 11<br />
Pounds carbon Available Per Ton Fe, CA 268 225 193 168 148 132<br />
Million BTU per Ton FE: MBTU = 4350(1 + 2.344[CO 2 / CO + CO 2 ]) x CA x 10-6<br />
C + O 2 -> CO 2 (14550 BTU/# Carbon) 3.9 3.27 2.81 2.44 2.15 1.92<br />
CO/CO 2 = 6.6/17 (11694 BTU/# Carbon) 3.13 2.63 2.25 1.96 1.73 1.54<br />
CO/CO 2 = 11.6/14 (9930 BTU/# Carbon) 2.66 2.23 1.92 1.67 1.47 1.31<br />
CO/CO 2 = 18.2/10 (7961 BTU/# Carbon) 2.13 1.79 1.54 1.34 1.18 1.05<br />
2C + O 2 -> 2CO (4350 BTU/# Carbon)* 1.16 0.98 0.84 0.73 0.64 0.57<br />
*From selected combustion data published by Whiting Met . Equipt. Systems Co<br />
35
The air required in CFM (cubic feet per minute) to combust the carbon to produce the above CO/<br />
CO 2 ratios and to satisfy a melt rate of 20 tons per hour is given in Table 4 below. .<br />
Table 4: Blast Rate to Produce 20 Tons Iron Per Hour<br />
Iron/Coke Ratio 6 7 8 9 10 11<br />
Available Carbon / Fe Ratio, C* 0.134 0.112 0.096 0.084 0.074 0.066<br />
Blast Rate in Cubic Feet Per Minute (CFM) for a Melt Rate of 20 Tons /Hour<br />
CFM = 2.519 x 10³ x ( 1 + [CO2 / CO + CO2]) x TPH x C*<br />
CO/CO 2 = 6.6/17 11587 9727 8344 7263 6398 5706<br />
CO/CO 2 = 11.6/14 10434 8760 7514 6541 5762 5139<br />
CO/CO 2 = 18.2/10 9121 7657 6402 5718 5037 4493<br />
Table 4 above shows that the blast rate to achieve a given CO/CO 2 combustion ratio necessarily<br />
decreases as the amount of coke available for combustion decreases. Of course, most cupolas will<br />
have a blast rate fixed by the equipment available; i.e. the electric motor present with the blast fan<br />
may generate 7000 cfm, or perhaps 8000 cfm. A given foundry may be interested in how the CO/<br />
CO 2 ratio would change with a variation in Fe/Coke ratio for their specific situation of blast rate<br />
and melt rate.<br />
Energy of Melting and Energy Balance in Cupola<br />
The minimum energy requirement of a cupola is to provide enough heat to preheat, melt, and<br />
superheat the charge adequately. The theoretical requirement to heat a ton of iron (4.3 wt. % carbon)<br />
to 2750 o F is approximately 1.06 million BTU (See the figure below). Clearly there will be<br />
significant energy losses in the exhaust gases, in the slag, and through the sidewalls of the cupola.<br />
It would be the goal of the foundry to minimize these losses through proper control of blast rate,<br />
melt rate, Fe/Coke ratio, etc. A large fraction of lost combustion energy goes into the exhaust<br />
gases. Estimates of these losses are in the range of the amount required to heat the iron: i.e. Svoboda’s<br />
Foundry Energy Conservation Workbook estimates 40% in melted iron, 35% in latent heat<br />
in stack gas (unburned CO), 13% in sensible heat in stack gas, and 12% other (slag, sidewalls).<br />
The latent heat fraction will obviously increase as the amount of CO in the effluent increases.<br />
Consider, for example, a foundry with a Fe/coke ratio of 8/1 and a blast rate of 6402 cfm. By<br />
Tables 2 and 3 this corresponds to an energy production rate of approximately 1.54 MBTU / Ton<br />
(20 Ton/Hour). The exhaust gas contains 18.2 wt. % CO, an amount which if combusted to CO 2<br />
would yield an extra 1.27 MBTU. This latent heat amounts to about 45 % of the potential energy<br />
in the blast (approximately 2.81 MBTU/Ton); the energy in the molten metal is about 38 % of this<br />
potential energy. The remaining 17 % then is due to sensible heat losses in the stack gases, losses<br />
in the slag, heat losses through the sidewall, etc.<br />
The heat needed in melting one ton of iron, the maximum amount of heat available, the<br />
latent heat in exhaust gases for a CO/CO 2 ratio of 11.6/14, and the potential waste heat lost as sensible<br />
heat in gases, slag, etc. are illustrated below for different Fe/coke ratios. It will be noted that<br />
the efficiency of the cupola increases as the Fe/coke ratio increases; i.e. the amount of waste heat,<br />
36
either as latent heat or sensible heat decreases. Of course, one has to remember that the blast rate<br />
must decrease to maintain a fixed CO/CO 2 ratio as Fe/coke ratio increases.<br />
1.4<br />
1.2<br />
1.0<br />
0.8<br />
0.6<br />
0.4<br />
0.2<br />
0<br />
1.06 MBTU at 2750 o F<br />
TEMPERATURE ( o 0 400 800 1200 1600 2000 2400 2800 3200<br />
F)<br />
37<br />
Fe - 4.3 C Iron<br />
Heat Content of Iron vs. Temperature for Pure Fe and Fe - 4.3 C<br />
4.0<br />
3.5<br />
3.0<br />
2.5<br />
2.0<br />
1.5<br />
1.0<br />
0.5<br />
0<br />
CO/CO 2<br />
11.6/14<br />
LATENT<br />
HEAT IN CO<br />
HEAT LOSSES<br />
IN CUPOLA<br />
HEAT CONTENT IN IRON AT 2750<br />
Pure Fe<br />
MAXIMUM HEAT CONTENT IN BLAST<br />
C + O 2 -> CO 2<br />
5 6 7 8 9 10 11 12<br />
TONS IRON PER TON COKE
Homework Problem . (Optional; extra credit)<br />
a. Determine the blast rate in cfm needed to produce a CO/CO 2 ratio of 11.6/14 at 9 tons of iron<br />
per ton of coke for cupolas producing iron at the rate of 20 TPH and 40 TPH.<br />
b. Determine the Tons Fe / Tons Coke ratio needed to produce a CO/CO 2 value of 11.6/14 for a<br />
blast rate of 6800 cfm and a melt rate of 16 TPH.<br />
c. Estimate the cupola efficiency in b. above.<br />
d. Estimate the cfm and the tons Fe / tons coke ratio needed to increase the efficiency of the<br />
cupola in b. above to 45%.<br />
38
V. Fluid Flow and Gating Design (After Flinn)<br />
A major factor in making a good casting is the ability to get the metal from the container<br />
into the mold with a minimum of turbulence, slag, entrapped sand or other materials in the mold<br />
or molten metal system which could get swept into the mold cavity. Accomplishing this task<br />
consistently requires a basic understanding of fluid flow principles as well as the insight provided<br />
by experience. The following material follows the method outlined in R. Flinn’s book on <strong>Metal</strong><br />
<strong>Casting</strong>. Consider the following simple fluid flow system.<br />
<br />
h 1<br />
1<br />
*<br />
Molten<br />
<strong>Metal</strong><br />
<br />
<br />
* 2<br />
h<br />
<br />
<br />
2<br />
*<br />
3<br />
Exit or<br />
(Efflux Point)<br />
Pouring Basin Mold<br />
Sprue<br />
Law of Conservation of Mass<br />
Along a line of flow matter is conserved so that<br />
A 2 v 2 = A 3 v 3<br />
where A 2 and A 3 are the cross sectional areas at points 2 and 3 and v 2 and v 3 are the fluid velocities<br />
at points 2 and3.<br />
Law of Conservation of Energy (Bernoulli’s Law)<br />
Energy, E, along a line of flow in a fluid can be expressed as:<br />
E = h + v 2 /2g + P/ρ + z<br />
where:<br />
E = energy in units of length (for ease of calculation)<br />
h = Potential Energy or Head<br />
v 2 /2g = Kinetic Energy<br />
z = Catch-all term Containing Energy Losses due to Friction, Turbulence, Heat Loss<br />
h = distance, in.<br />
v = velocity, in/sec<br />
g = acceleration of gravity, 384 in / sec 2<br />
P = Pressure, lbs / in 2<br />
ρ = Density, lbs / in 3<br />
Ideally the catch-all term z is equal to zero. However it will become clear from homework related<br />
to laboratory experimentation that it is a very significant item indeed. Bernoulli’s Law states that<br />
energy is conserved along a line of flow, so that at any two points:<br />
E 1 = E 2<br />
39<br />
Notes:<br />
1. Pouring Basin Remains Full at all Times<br />
2. Liquid <strong>Metal</strong> is Leaving at Efflux Point<br />
3. Assume pouring Basin is Impermeable
and therefore h1 + v 2<br />
1 /2g + P1 /ρ = h2 + v 2<br />
2 /2g + P2 /ρ<br />
In gating systems in sand molds the dependent variables of velocity, v, and pressure, P, are critical<br />
parameters which are important to control in filling a mold cavity quickly and cleanly. Examples<br />
of how velocity and pressure calculations can be utilized in gating design are given below.<br />
Velocity at the Efflux Point<br />
The velocity of flow within a gating system will determine the time required to fill a mold<br />
cavity. Using Bernoulli’s Law at points 1 and 3 gives:<br />
h1 + v 2<br />
1 /2g + P1 /ρ = h3 + v 2<br />
3 /2g + P3 /ρ.<br />
Using the convention that the head is measured relative to the Efflux point, then h3 = 0. Assuming<br />
that the system is operating in normal conditions of 1 atmosphere, then the free surfaces at points<br />
1 and 3 require that P1 = P3 = 14.7 lbs /in2 . Finally the assumption is always made that the pouring<br />
basin remains full so that at point 1, v1 = 0 in / sec. Therefore Bernoulli’s Law reduces for points<br />
1 and 3 to:<br />
v3 = (2gh) 1/2<br />
or v3 = 27.1 (h) 1/2<br />
This velocity would also represent the velocity at the ingate in a so-called “pressurized” gating<br />
system, a system in which the smallest cross sectional area (the choke) occurs at the ingate. In<br />
this situation, then, the above velocity equation can be used to estimate mold cavity filling time,<br />
tF .<br />
tF = (Volume of <strong>Casting</strong>) / (vi Ai )<br />
A typical gating system contains a pouring basin, a downsprue, a sprue well, a runner (usually in<br />
the drag), and ingates (usually in the cope on the parting line of the casting). This system is illustrated<br />
below for a riserless casting together with a calculation which uses the above velocity relationship<br />
to estimate casting filling time.<br />
9”<br />
Pouring Basin Downsprue<br />
COPE<br />
<br />
Mold Cavity<br />
(Entirely in Drag)<br />
DRAG<br />
6 in. x 8 in. x 2 in.<br />
Sprue<br />
Base Sprue Well Drag Runner<br />
(Area, AS ) (Area, AR )<br />
The above ratio of sprue base area to runner cross sectional area to ingate area is called the gating<br />
ratio, a common way to quantitatively describe gating systems. Filling times for just such a cast-<br />
40<br />
Ingate(Area, Ai )<br />
AS : AR : Ai = 1 in 2 : 2 in 2 : 0.5 in 2<br />
Problem: Assuming Bernoulli’s Law holds<br />
with no losses due to friction,etc., compute<br />
the filling time of the casting given.<br />
Solution: Because the ingate represents<br />
the smallest cross sectional area of the<br />
system, and because the ingate is always<br />
at atmospheric pressure, the velocity at the<br />
ingate is constant and given by:<br />
v i = 27.71 (9) 1/2 or v i = 83.13 in/sec<br />
The time required to fill the casting is then<br />
t F = <strong>Casting</strong> Volume / v i A i<br />
t F = 96 /( 83.13 x 0.5) = 2.31 sec
ing has been experimentally measured at Michigan Tech for a number of years in which the head<br />
(Distance from top of pouring basin to the parting line) and the ingate cross sectional area were<br />
independently varied to control flow rates.These data will be introduced in homework to follow.<br />
Pressure at Intermediate Point in Gating System<br />
It is important to keep the actual pressure within a flowing liquid in a sand mold above<br />
atmospheric pressure. If the pressure in the molten metal drops below 1 atmosphere then air can<br />
be draw in or “aspirated” into the metal stream, thereby increasing the opportunity for defects<br />
within the casting. These defects could include the formation of metal oxides or gas porosity, a<br />
particularly troublesome problem in aluminum alloy castings which absorb hydrogen so readily in<br />
the liquid state. Consider the situation in the simple pouring basin sketch on page 39. Let us<br />
assume that the downsprue has the same cross sectional area at points 2 and 3. From the law of<br />
continuity then v2 = v3 . Writing Bernoulli’s Law at points 2 and 3 gives:<br />
h2 + v 2<br />
2 /2g + P2 /ρ = h3 + v 2<br />
3 /2g + P3 /ρ.<br />
Solving for P2 subject to the straight-sided sprue constraint gives:<br />
P2 = P3 - h2ρ .<br />
Thus it can be seen that the pressure at point 2 is less than 1 atmosphere; gas aspiration will occur<br />
at this point in the system.<br />
Problem: It will be left to the student to show that relief of gas aspiration in the downsprue<br />
can be achieved by building a taper into the sprue.<br />
Students in an experiment conducted in the MY423 laboratory in the fall of 1994 (term<br />
version of MY 4130) measured filling times in 2 x 6 x 8 inch Y-block castings (The entire casting<br />
was in the drag similar to the schematic shown on page 28) poured under conditions in which<br />
head and ingate area were varied independently. The results of that experiment are tabulated<br />
below<br />
41
:<br />
<strong>Casting</strong><br />
Number<br />
Head, h<br />
in.<br />
Table 5: Filling Time Data, Fall 1998 - 01 (MY423 - MY 4130)<br />
Ingate<br />
Area<br />
in 2<br />
Measured<br />
<strong>Casting</strong><br />
Filling<br />
Time<br />
t F (sec)<br />
Measured<br />
Riser<br />
Filling<br />
Time<br />
t F (sec)<br />
Homework Problem Using the data in the above table, compute the ideal filling time of the<br />
casting, assuming no friction or turbulence losses in the gating system. Plot measured and ideal<br />
calculated filling times (ordinate) vs. the independent parameter (h) 1/2 (A i ) on the abscissa.<br />
Include best lines through the data. Estimate from fluid flow principles the real velocity profile<br />
across the ingate area. Discuss the magnitude of the difference observed between measured and<br />
calculated filling times.<br />
42<br />
<strong>Casting</strong><br />
Number<br />
Head, h<br />
in.<br />
Ingate<br />
Area<br />
in 2<br />
Measured<br />
<strong>Casting</strong><br />
Filling<br />
Time<br />
t F (sec)<br />
1 - 98 4 0.049 47 91.7 19 9 0.049 27 34.4<br />
2 9 0.11 15 19.6 20 6.25 0.049 32.9 42.8<br />
3 4 0.11 24 79 21 9 0.11 15 15.5<br />
4 9 0.196 12 12 22 9 0.09 21 21<br />
5 4 0.196 17 33 23 - 01 4 0.11 28 51<br />
6 9 0.11 17.7 19.3 24 4 0.196 26 29<br />
7 - 99 4 0.11 19 20 25 6.25 0.196 11.5 24<br />
8 9 0.11 17 17 26 6.25 0.11 23 42<br />
9 4 0.196 18 46 27 9 0.11 15 31<br />
10 6.25 0.196 15 32 28 6.25 0.11 20.5 42<br />
11 4 0.049 47 85 29 - 02<br />
12 6.25 0.049 38 46 30<br />
13 6.25 0.11 21 31<br />
14 9 0.11 21 22 32<br />
15 - 00 4 0.11 49 66 33<br />
16 9 0.11 16.9 18 34<br />
17 4 0.196 27 35<br />
18 6.25 0.196 11 12 36<br />
Measured<br />
Riser<br />
Filling<br />
Time<br />
t F (sec)
Number of Gates in System<br />
The number of gates needed to fill a casting<br />
cavity in an acceptable time is determined by the<br />
size of the casting as well as the casting complexity,<br />
both factors which are dealt with using experience<br />
and a certain amount of common sense. Consider a<br />
plate casting (30 in. x 20 in. x 4 in.) which needs to<br />
be filled uniformly and quickly. The simplest gating<br />
configuration is shown , in which one gate is<br />
attached to a short runner leading from the sprue<br />
well.While this method would seem to be the most<br />
straightforward way to fill the mold, it becomes<br />
clear when considering the basics of heat transfer<br />
that the metal that is required to pass the length of<br />
the plate could conceivably solidify before the end<br />
of the plate is reached. In fact it is likely that this<br />
casting would contain some cold shuts, defects in<br />
which the metal does in fact solidify followed by<br />
more liquid thereby leaving an interface between<br />
successive volumes of metal.This is illustrated<br />
above by the dashed lines on the sketch. In fact<br />
many cold shuts may appear within one casting. The<br />
solution to this problem is one in which a gating system<br />
is constructed so that the metal enters the cavity<br />
at the same time from several gates located at convenient<br />
places around the plate . A better gating scenario<br />
is illustrated above (See gates A 1 , A 2 , and A 3<br />
in the sketch) in which several gates are positioned<br />
on either side of the plate casting. The dimensions<br />
of these gates are adjusted so that metal flow rate<br />
from each is nearly equivalent, so that no opportunities<br />
arise to allow the development of the cold shuts<br />
which occurred in the poor gating configuration. Uniform metal flow will require that A 1 > A 2 ><br />
A 3 because of momentum effects of the molten metal rushing down the runner (It would just as<br />
soon continue in a straight line if possible). The gating system above also contains sand traps (ST)<br />
at the ends of the long runners which would be the place to which the first metal in the runners<br />
would be found. This first metal would most likely contain loose sand from the molding process<br />
in addition to being the coldest metal into the system. The remaining metal will have the benefit<br />
of traveling through a gating system in which heat has already been added to the molding sand<br />
and therefore will not be expected to cool down as much. Many other design features are possible<br />
to add to gating systems to accomplish the goal of delivering molten metal in a timely way, free<br />
from entrapped sand, slag or other foreign material supplied either by the mold, by the metal, or<br />
even created during the pouring operation. Details of these features can be found in texts dealing<br />
specifically with gating design, i.e. from the American Foundrymen’s Society (AFS).<br />
43<br />
POOR<br />
BETTER<br />
Side<br />
A 1<br />
<br />
<br />
Top<br />
<br />
<br />
<br />
<br />
<br />
<br />
<br />
<br />
<br />
<br />
<br />
A 2<br />
A 3<br />
ST<br />
ST
Fluidity of Molten <strong>Metal</strong>s<br />
The fluidity of molten metals is property which describes the ease with which molten<br />
metal can fill a mold cavity. It is a property which depends upon the freezing range of the molten<br />
alloy in question, ∆T, and the degree of superheat (T P - T L , pouring temperature - liquidus tem-<br />
perature) of the metal when it enters the mold. In a qualitiative sense, the higher the fluidity the<br />
smaller the section size that can be successfully filled before solidification occurs. The common<br />
way to measure a given cast metal’s fluidity is by casting a fluidity spiral tube, a 60” long spiral<br />
molded into sand into which the metal is poured with a constant head of 4 inches. The length to<br />
which the metal penetrates the spiral is a measure of the fluidity of the molten material. For<br />
details see the text “Principles of <strong>Metal</strong> <strong>Casting</strong>” by Heine, Loper, and Rosenthal. A schematic of<br />
fluidity vs superheat and alloy content is given in the figure below.<br />
Fluidity (Inches)<br />
60<br />
40<br />
20<br />
0<br />
0<br />
<br />
<br />
<br />
<br />
<br />
<br />
<br />
<br />
<br />
<br />
<br />
<br />
<br />
<br />
<br />
<br />
<br />
<br />
<br />
<br />
<br />
<br />
Pure <strong>Metal</strong>s<br />
Eutectics<br />
<br />
<br />
<br />
<br />
<br />
<br />
<br />
<br />
<br />
<br />
<br />
<br />
<br />
<br />
<br />
<br />
Superheat, T P - T L<br />
It can be seen in this figure that the fluidity of pure metals and eutectics, with a freezing fange of<br />
zero, is the greatest. Alloys with large freezing ranges have reduced fluidities. The above figure<br />
shows that all metals and alloys will have increasing fluidity with increasing superheat. Gray cast<br />
iron is one of the most fluid casting alloys. Empirical fluidity spiral data from many experiments<br />
on gray cast iron gives the expression<br />
Fluidity (in.) = 14.9 x CF + 0.05T - 155<br />
where T is the pouring temperature in o F, and CF is the composion of the iron and is<br />
equal to<br />
CF = %C + 1/4 x % Si + 1/2 x % P.<br />
Thus for a eutectic iron of composition 3.5 % C, 2.4 % Si, 0.04 %P, the fluidity is given by<br />
Fluidity = 14.9 x 4.12 + 0.05 (2600) - 155 = 36.39 in.<br />
As the pouring temperature increases the fluidity increases (at 2700 the fluidity is 41.39 in.) and<br />
as the composition decreases (increasing the temperature range over which solidification occurs)<br />
to a hypoeutectic value (say 3.2% C, 2.1% Si, 0.04 %P) the fluidity decreases to ~ 30.8 in. Again<br />
details about the fluidity of gray cast irons can be found in Heine, Loper and Rosenthal.<br />
Clearly the fluidity needed to fill a mold cavity will depend upon the section size of the<br />
casting being produced. Thin sections will naturally require higher fluidities to successfully be<br />
filled before solidification, and therefore higher superheat temperatures. Conversely chunky castings<br />
will require less fluidity and therefore less superheat for successful filling.<br />
44<br />
<br />
<br />
Increasing ∆T
VI. Solidification, Processing of <strong>Metal</strong> <strong>Casting</strong>s<br />
Intrinsic and Extrinsic Factors<br />
The process of solidification, the change of liquid to solid metal after pouring into the<br />
mold, is the defining event in the life cycle of a casting. The times involved in this activity may<br />
be as short as seconds or as long as hours depending upon the casting process and the size of the<br />
casting. The chemical composition of the metal being cast, the manner in which solidification<br />
occurs, and the subsequent solid state treatment determines the ultimate microstructure and therefore<br />
properties (mechanical and physical) of the casting. It is the duty of the metal casting engineer<br />
to control the solidification event to the best of his/her ability so that the microstructure of<br />
the final proaduct can be controlled to optimize the properties desired. The ultimate physical and<br />
mechanical properties of the cast metal will depend upon both intrinsic and extrinsic factors<br />
present in each casting event and in the processing events subsequent to casting. These terms and<br />
what they mean for the casting and its properties are defined in the accompanying Table 6 below.<br />
Intrinsic<br />
Factors<br />
Extrinsic<br />
Factors<br />
Table 6:<br />
- Chemical Composition<br />
- Cooling Rate During Solidification<br />
- Heat and Mechanical Treatment after<br />
Solidification<br />
- <strong>Metal</strong> cleanliness<br />
- Additives for Microstructure Control<br />
- <strong>Casting</strong> Design<br />
- Riser and Gating Design<br />
- Solidification Rate Control<br />
- Temperature Control Subsequent to<br />
Solidification<br />
Illustration of the significance of intrinsic and extrinsic factors in determining the tensile properties<br />
of a casting (Ultimate Tensile Strength and Percent Elongation) is shown below:<br />
Ultimate Tensile Strength<br />
0 0<br />
Percent Elongation<br />
45<br />
Intrinsic<br />
These factors determine the ultimate<br />
microstructure and properties of the casting<br />
These factors represent an attempt by<br />
designers, metal casting engineers and<br />
other processing engineers to control the<br />
processes to attain the ultimate properties<br />
promised by the intrinsic factors<br />
(Homogeneous and Uniform Matrix)<br />
Reduction in tensile properties due to<br />
breaks in the homogeneous and uniform<br />
matrix microstructure (defects) resulting<br />
from lack of control of the Extrinsic<br />
factors in processing.<br />
<br />
<br />
<br />
<br />
<br />
<br />
<br />
<br />
<br />
<br />
<br />
<br />
<br />
<br />
<br />
*
It can be seen in this schematic illustration that the ultimate goal is to produce a casting with a<br />
matrix microstructure which is homogeneous and uniform throughout. Departure from homogeneity<br />
and uniformity results in reduced strength and ductility. Achievement of the optimum goal<br />
is difficult because of the nature of solidification on a microscale and because of the complexity<br />
of controlling the manner of solidification on a macroscale. From an engineering point of view,<br />
optimization of microstructure and properties of a casting is more practically achieved by concentration<br />
on controlling the manner of solidification on a macroscale in addition to controlling solidification<br />
on a microscale and subsequent heat treatment.<br />
Microscale - Dendritic Solidification<br />
Most metals and alloys will solidify by the formation and growth of dendrites of one phase<br />
in which alloy segregation occurs within the dendrite and second phase growth occurs external to<br />
the dendritic structure. This subject has been treated in great detail in many texts published on the<br />
solidification of liquid metals and will not be treated extensively in this work. As indicated<br />
above, most solidification events involve the production of dendrites followed by the precipitation<br />
of a second phase or phases in between dendrite arms. The reasons why dendrites form is defined<br />
by the kinetic and thermodynamic factors which allow atom rearrangement in a convenient way<br />
in an acceptable period of time. The structure and chemical makeup of typical dendrites during<br />
solidification is shown schematically below. The exact distribution of alloy elements segregated<br />
into and external to the dendrites, and the magnitude of the SDAS (secondary dendrite arm spacing)<br />
is determined precisely by the alloy composition and the rate at which the heat is removed<br />
from the solidifying volume. Once the alloy composition and the size of the casting and mold<br />
material is selected, the solidifying material produce a dendritic base into which other phases or<br />
reaction products may be interspersed (eutectics, peritectics, inclusions, porosity, etc.).<br />
Segregation of Alloy Elements<br />
Between Arms<br />
Segregation or Coring<br />
Within Dendrite Arms<br />
Porosity<br />
(Gas, Shrinkage)<br />
<br />
<br />
<br />
<br />
<br />
<br />
Primary Dendrite Arm<br />
Solidification on a Macroscale - Defect Production<br />
Production of a homogeneously solidified dendritic structure without casting defects<br />
requires control of the practical manner in which molten metal is brought into the casting cavity<br />
46<br />
Secondary Arms<br />
SDAS Inclusion<br />
(Slag, Sand)
and into which heat is removed. Lack of directional control of heat and metal flow responding to<br />
shrinkage during solidification, or insufficient attention to metal cleanmliness or mold design can<br />
result in typical defects shown schematically above. Design factors such as casting shape, riser<br />
design, and gating design are used by the engineering team to minimize defects. This text is<br />
largely about presenting material important in helping to make informed engineering decisions<br />
about the extrinsic factors used to control macroscale solidification events.<br />
Controlled Thermal or Mechanical Treatment After <strong>Casting</strong><br />
Many castings are used in the as-cast condition, so that the process selected by the design<br />
team and casting engineers determines the casting’s final properties. However, as mechanical and<br />
physical requirements become more stringent for cast products, more castings will be subjected to<br />
heat treatment, surface chemical modification, mechanical deformation, or combinations of these<br />
treatments (HIPping, or thermomechanical processing).<br />
In general, thermal treatment can only alter the microstructure of the matrix material; i.e.<br />
it is an intrinsic factor. Thermal treatment cannot eliminate, reduce or otherwise change the<br />
defects produced during casting. Thus a reduced ductility as a result of negative extrinsic factors<br />
during casting will result in a reduced ductility in the heat treated condition. Heat treatment cannot<br />
overcome the negative effect of defects introduced during casting.<br />
In recent years hot isostatic pressing (HIPping, a thermomechanical treatment) of some<br />
cast products has been used to reduce the negative effects of shrinkage porosity, a process in<br />
which a combination of high temperature and pressure are effective in closing and therefore eliminating<br />
shrinkage porosity in castings. This elimination of voids in the casting can dramatically<br />
increase the ductility and fatigue resistance of castings.<br />
Latent Heat of Solidification and Cooling Curves in a Pure <strong>Metal</strong><br />
Consider a pure metal which is slowly cooled from the liquid state to its melting point,<br />
T m . At T m the solid begins to form releasing the latent heat of solidification. This latent heat is,<br />
thermodynamically, an enthalpy term, which is a consequence of entropy change accompanying<br />
the transition from liquid to solid. This relationship will be derived from first principles below.<br />
Define G l , H l , and S l as the Gibbs Free Energy, Enthalpy, and Entropy respectively of the<br />
liquid. Similarly, let G s , H s , and S s be the same quantities for the solid.<br />
By Definition:<br />
G l = H l - TS l and G s = H s - T S s<br />
These are shown graphically as follows:<br />
G l o<br />
G s o<br />
T o<br />
Tm Temperature -><br />
47<br />
G s<br />
G l<br />
Assume that the H and S val ues<br />
are constants for both solid and liquid
The slopes of each line represents the entropies of each phase. Note that the entropy of the disordered<br />
liquid is greater than the entropy of the orderly crystal structure of the solid. At the melting<br />
point, Tm , the solid and liquid are in equilibrium and therefore:<br />
G s = G l ,<br />
and H s - T m S s = H l - T m S l ,<br />
and H s - H l = T m (S s - S l ) = Latent Heat of Solidification.<br />
Notice that for T > T m , G l < G s and therefore the liquid is the stable state.<br />
Notice that for T < T m , G s < G l and therefore the solid is the stable state.<br />
Suppose that the liquid is supercooled to To. At this temperature there will be a driving<br />
force,(G s o - Gl o ), which favors the nucleation and growth of the solid. In most real systems the<br />
solid will nucleate heterogeneously at a temperature close to T m and then growth will proceed at<br />
T m until the liquid is exhausted. A thermocouple placed into such a system will experience a cooling<br />
curve similar to the one shown schematically below:<br />
T m<br />
Recallescence<br />
Undercooling<br />
t S<br />
Time -><br />
Steady State Heat Transfer Processes - Ficks First Law<br />
During a casting event heat must be extracted through the mold walls before solidification<br />
is complete. The rate of heat transfer and therefore solidification time, t S , will depend upon the<br />
thermal properties of the mold material and of the interface. Consider, first, a simple one - dimensional<br />
steady state process. The diagram below illustrates this with a refractory wall (30 cm thick)<br />
which has constant temperatures of 1400 and 300 o C on opposite sides.<br />
300 o C<br />
WALL<br />
30 cm<br />
x<br />
48<br />
Undercooling necessary to provide driving<br />
force for the nucleation event.<br />
Recallescence resulting from input<br />
of latent heat of solidi• cation<br />
tS = Solidi• cation Time<br />
1400 o C
Assume a steady state condition, that is, at any distance x from the wall the temperature<br />
remains constant with time. Heat will flow from the high temperature side to the low temperature<br />
side of the wall at a rate dependent upon the following:<br />
1. Thermal conductivity, K<br />
2. Temperature Gradient, ∆T/∆x<br />
3. Area of Wall, A<br />
4. Time, t<br />
The Total Heat Flow = AKt (∆T/∆x)<br />
Flux of Heat = Total Heat Flow/Area.Time = J = K(∆T/∆x) FICK’S FIRST LAW<br />
Example Problem:<br />
Assume K = 1 W m -1 o C -1<br />
Assume K is temperature independent<br />
Therefore J = 1x1100 / 0.3 = 3666.7 (Watts / m 2 )<br />
Obviously heat flow in a mold following a casting event is not a steady state process and<br />
therefore Fick’s First Law alone is not adequate to describe the situation. However, recall that at<br />
any given point, at any time in any situation FFL will define the flux, J, at that point in time. This<br />
knowledge will be used to define the flux at the mold-metal interface, a changing flux which can<br />
then be integrated to determine t S in a given casting.<br />
VII. Heat Transfer and Solidification in Insulating Molds<br />
Chvorinov’s Rule<br />
At some time, t, after pouring a pure metal into an insulating mold (sand or ceramic) at<br />
some pouring temperature T P , the temperature along a line perpendicular to the mold - metal interface<br />
would be expected to look like the diagram below:<br />
T P<br />
T m<br />
T 0<br />
<strong>Metal</strong> (High K) Sand Mold (Low K)<br />
<br />
Distance From Interface<br />
δT/δt = αM ( δ 2 T/δx 2 )<br />
where αM = thermal dif fusivity of mold<br />
= K M / ρMC M<br />
Thermal Conductivity<br />
Density<br />
Heat Capacity<br />
49
In this situation, the high thermal conductivity of the metal results in the temperature of the metal<br />
at the interface dropping to T m instantly upon pouring and staying there until solidification is<br />
complete. Of course, intimate contact between the metal and mold means that the mold at the<br />
interface will also remain at T m until solidification is complete.<br />
The solution to the above equation subject to the boundary conditions that T = T m at x = 0<br />
and T = T 0 at x = oo for small t gives:<br />
This equation can be used to predict the solidification time, t S .<br />
The flux of heat at the interface at time t is given by<br />
J = -KM (dT/dx)| x=0<br />
dT<br />
---dx<br />
Expanding the erf function in the form:<br />
⎧ x ⎫<br />
Txt ( , ) = T0 + ( Tm – T0) ⎨1– erf ----------------- ⎬<br />
⎩ 2 αMt ⎭<br />
x = 0<br />
erf( u)<br />
and differentiating gives at x = 0, the interface,<br />
( Tm – T0) d ⎛ x ⎞<br />
= ----- 1 – erf⎜-----------------<br />
⎟<br />
dx ⎝2αMt⎠ =<br />
2<br />
------ ⎛ u u u<br />
u – -------- + -------- – -------- + ⎞<br />
π⎝<br />
3.1! 5.2! 7.3! ⎠<br />
J<br />
=<br />
K ( T − T )<br />
M m 0<br />
πα M t<br />
The total heat, Q, through the interface of area A :(the total surface area of the casting) up to the<br />
time , t, is given by:<br />
t<br />
2AK( Tm – T0) Q A∫Jdt -----------------------------------t<br />
παM 0<br />
0.5<br />
= =<br />
50<br />
x = 0
The total heat liberated befofe solidification is a sum of the superheat, Q S , and latent heat of solidification,<br />
Q F , where:<br />
Q F = ρ <strong>Metal</strong> ∆H F V <strong>Metal</strong> ,<br />
Q S = ρ <strong>Metal</strong> V <strong>Metal</strong> (T P - T m )C <strong>Metal</strong> ,<br />
where T P is the pouring temperature.<br />
The time necessary for this amount of heat to pass through the interface would correspond to the<br />
solidification time, t S , and therefore:<br />
and therefore:<br />
t =<br />
S<br />
For a given metal and mold poured at a temperatureT P we can separate a mold constant B S and the<br />
V/A ratio to give Chvorinov’s Rule,<br />
t S = B S (V/A) 2<br />
Q + Q<br />
S F<br />
=<br />
2 2<br />
πα ρ V<br />
M <strong>Metal</strong> <strong>Metal</strong><br />
2AK M<br />
Πα M<br />
51<br />
0.5<br />
( T − T ) t<br />
m 0 S<br />
∆H + C ( T − T )<br />
F <strong>Metal</strong> P m<br />
4A 2 2<br />
K ( Tm − T )<br />
M 0<br />
2<br />
2
The Constants needed to utilize Chvorinov’s Equation for a variety of materials are given below:<br />
Material<br />
Thermal<br />
Conduct.<br />
K<br />
W m -1 o C -1<br />
Density<br />
ρ<br />
g cm -3<br />
(mg cm -3<br />
o C -1 )<br />
Problem<br />
1.Using Chvorinov’s Rule determine the solidification times of sand castings of Al, Cu, and Fe<br />
poured into molds with mold cavity dimensions of 10 cm x 10 cm x 10 cm and then of 20 cm x 20<br />
cm x 2.5 cm, with superheats of 10, 100, and 200 C o .<br />
2. Discuss the practical implications of the results in 1. above. Any surprises?<br />
52<br />
Table 7:<br />
Specific Heat<br />
C<br />
J kg -1 o C -1<br />
Heat of<br />
Fusion<br />
∆H F<br />
J kg -1<br />
Melt<br />
Temp<br />
T m<br />
o C<br />
Expansion<br />
Coeff. (68F)<br />
α<br />
10 -6 o C -1<br />
Sand (SiO2 ) 1.5 2.32(bulk)<br />
1.6 (Mold)<br />
1117 22.2<br />
Al (liq) 94.03 2.385<br />
9-.280<br />
1080 395995 660 -6.5<br />
Al (sol) 20C 238 2.7 917 23.9<br />
Fe (liq) 7.015<br />
(-.883)<br />
795 272090 1536 -3.5<br />
Fe (sol) 20C 78.2 7.87 456 11.7<br />
Cu (Liq) 165.6 8.0<br />
(-0.801)<br />
495 211812 1085 -4.2<br />
Cu(Sol)20C 397 8.96 386 16.5<br />
Notes W = Watts<br />
m = meter<br />
mg = milligrams<br />
J = Joules<br />
kg = kilogram<br />
Assume<br />
Temp Independent<br />
Solidif.<br />
Volume<br />
Change<br />
%
VIII. Shrinkage, Riser Design<br />
Risers are used in the production of castings for the purpose of providing molten metal for<br />
the solidifying and shrinking casting. Riser design in sand castings requires, at a minimum, that<br />
the riser solidify after the casting. A casting and riser are shown schematically in a sand mold<br />
below. The desired situation after solidification would result in all the shrinkage within the riser as<br />
illustrated.<br />
Shrinkage in <strong>Metal</strong>s During Solidification<br />
The shrinkage that occurs during solidification of metals (that ideally all ends up in the<br />
shrinkage cavity in the riser shown above) results from three distinct contributions which are<br />
illustrated below for an alloy in a eutectic systemwhich solidifies over a temperature range (most<br />
alloys do not solidify at one temperature).<br />
T P<br />
T L<br />
T S<br />
COPE<br />
CASTING RISER<br />
Pouring Temperature<br />
Liquidus Temperature<br />
Solidus (Eutectic) Temperature<br />
Wt. Pct Alloy Element<br />
The total amount of shrinkage experienced during solidification may be quite large, especially for<br />
aluminum alloys, which can shrink 6.5% during the change in state (See the table on pg. 52 for<br />
more information about shrinkage for Al, Cu, and Fe in the solid and liquid).<br />
Problems:<br />
1. Estimate the total percentage change in volume for solidification of Al, Cu, and Fe, each<br />
poured with 200 C o superheat. Note for pure metals that there is no contribution from component<br />
II. (Hint; You need to use the variation in densities in the liquids (defined as mg cm -3 o C -1 in<br />
parenthesis in the density column in the table on pg. 52)).<br />
2. Plot Total Volume Percentage Change vs. Superheat Temperature from 0 to 200 C o superheat<br />
for all three metals in problem #1 above. Any surprises?<br />
53<br />
DRAG<br />
Shrinkage<br />
Parting Line<br />
SHRINKAGE COMPONENTS<br />
I. Thermal Contraction of L from T P to T L<br />
II. Thermal Contraction of Liquid and Solid<br />
from TL toTS III. Change in State from Liquid to Solid from<br />
TL to TS and at TS
Solidification Shrinkage Types<br />
Shrinkage porosity can appear within a casting in a number of ways depending upon the<br />
solidification temperature range (T L - T S ) and the effectiveness of risering. The type of shrinkage<br />
observed in castings can be broadly separated into two classes, macroshrinkage and microshrinkage.<br />
Macroshrinkage defects can be seen by the unaided eye and microshrinkage defects require a<br />
microscope to observe. There are two types of shrinkage within each class, shrinkage which can<br />
be observed externally on the casting surface and shrinkage which is observed internally after sectioning.<br />
Schematic examples of each of these defects is shown below:<br />
<strong>Casting</strong><br />
Surface<br />
External<br />
Microshrink<br />
Revealing<br />
Dendrites on Surface<br />
External Macroshrink Internal Macroshrink<br />
<strong>Casting</strong> <strong>Casting</strong><br />
These diagrams illustrate the nature of shrinkage porosity which is observed within castings. Ideally,<br />
of course, effective riser design would be able to eliminate or reduce the incidence of these<br />
defects within the casting. Usually proper riser design will prevent the incidence of the macroshrinkage<br />
class, but it is possible that no amount of risering will eliminate microshrinkage.<br />
Shrinkage porosity within the casting results in lower strengths because the effective cross sectional<br />
area of the casting is reduced, and reduced ductility because of the incidence of preexisting<br />
voids.Understanding the reason why these types of shrinkage occur is helpful to the designer in<br />
eliminating or minimizing this degradation caused to mechanical and physical properties. The<br />
presence of each of these types of shrinkage can be understood by considering the process that is<br />
involved during solidification, a process which includes the following list of events.<br />
Solidification Begins by Dendrite Nucleation on Mold Wall<br />
Shrinkage Associated With Liq -> Sol Results in Local Vacuum<br />
54<br />
Internal Microshrink Between<br />
Dendrite Arms<br />
Primary Dendrite Primary Dendrite<br />
Eutectic<br />
Product<br />
Eutectic<br />
Product
A Local Vacuum Translates to a Pressure Gradient Between Exterior and Interior<br />
Pressure Gradient Results in Liquid Flow Within <strong>Casting</strong> Toward Solidifying Zone<br />
Macroshrinkage<br />
Poor Riser Design - Riser Solidifies Before <strong>Casting</strong><br />
Shrinkage<br />
(Vacuum)<br />
Atmospheric Pressure = P Vacuum Pressure = P 0 = 0<br />
P<br />
Microshrinkage<br />
Presence of Dendrites Makes Fluid Flow Difficult<br />
P<br />
Internal Macroshrinkage results when the riser does not adequately feed the casting, but the casting<br />
has established a solid shellagainst the mold wall which is able to resist deformation due to the<br />
stresses generated by the pressure dif<br />
shrinkage within the casting.<br />
ference . The result is the retention of a lar ge macro-<br />
Shrinkage<br />
(Vacuum)<br />
Partly Solidi• ed Completely Solidi• ed<br />
P0 Shrinkage<br />
(Vacuum)<br />
Liquid<br />
Partly Solidi• ed<br />
Liquid<br />
P 0<br />
Solid<br />
Solid<br />
External Macroshrinkage results when the solid shell is not strong enough to resist the shear stresses<br />
generated by the pressure dif ference. The result is the surface collapses into the vacuum created by<br />
the density dif ferences resulting from solidi• cation.<br />
Internal microshrinkage is a very common defect in castings where there is an abundance<br />
of dendrites, where the dendrite arms are long and intertwined. Under these conditions the ability<br />
of the fluid to flow into these volumes to take up shrinkage as it is occurring is significantly<br />
reduced. This problem is exaggerated as the solidification temperature range, T L - T S , increases,<br />
and it is also usually more prevalent in castings which solidify more slowly. In these situations<br />
where the dendritic structure makes particularly tortuous paths for fluid flow, even proper risering<br />
will not eliminate the microshrinkage voids between the dendrite arms. External microshrinkage<br />
is quite often observed in those situations where solidification is occurring rather uniformly<br />
throughout the solidifying metal, and where significant fluid flow is still possible between the<br />
55<br />
P<br />
Completely Solidi• ed<br />
P<br />
P 0<br />
P
dendrite arms. In these situations (a good example are powders formed by atomization in water or<br />
air), the pressure gradient generated between the inside of the solidifying powder particle and the<br />
surface results in the liquid between the dendrites being sucked into the center of the particle leaving<br />
the dendrites exposed on the surface.<br />
In those situations where microporosity can not be avoided in the cast state, the integrity<br />
of the casting can by increased by HIPping (Hot Isostatic Pressing), a procedure where the casting<br />
is subjected to high pressure at an elevated temperature to physically squeeze the pores closed.<br />
This is an expensive procedure which is used only in those situations where processing cost is of<br />
minor concern.<br />
Riser Design<br />
Riser design in sand mold castings requires, as a minimum, that the riser solidify after the<br />
casting, i.e.:<br />
t S (Riser) > t S (<strong>Casting</strong>)<br />
Thus by Chvorinov’s Rule,<br />
B S (R){V/A} R 2 > BS (C){V/A} C 2<br />
where B S (R) and B S (C) are the mold constants for the riser and casting respectively, and (V/A) R<br />
and (V/A) C are the volume to area ratios of the riser and casting respectively. It is useful to define<br />
the ratio (V/A) as the modulus, M, so that,<br />
(V/A) R = M R (Modulus of Riser), and (V/A) C = M C (Modulus of <strong>Casting</strong>)<br />
Thus for successful riser design,<br />
B S (R) (M R ) 2 > B S (C) (M C ) 2<br />
It is clear on studying this equation that any of the terms present could, in principle, be varied<br />
independently to insure that t S (R )> t S (C). However, there are two most likely situations encountered<br />
in practice, situations defined below:<br />
I. B S (R) = B S (C), and then M R > M C becomes the criterion that must be met to insure<br />
that the riser solidify after the casting. This is by far the most common situation encountered in<br />
practice, the situation in which the riser and the casting are molded into the same sand. In practice<br />
it has been observed that M R > 1.1 M C is usually sufficient to effectively feed the solidifying casting.This<br />
situation is illustrated below:<br />
COPE<br />
B S (C)<br />
B S (R)<br />
CASTING RISER<br />
56<br />
DRAG<br />
Parting Line<br />
B S (R) = B S (C)
II. B S (R) > B S (C), such that M R < M C and still the inequality t S (R) > t S (C) is obeyed.<br />
This is the situation when an insulating riser sleeve is molded around the riser cavity. This allows<br />
a much smaller riser to be utilized thereby increasing casting yield (see page 59 for a definition of<br />
casting yield). This is illustrated below:<br />
COPE<br />
CASTING<br />
Calculation of Modulus of Riser and <strong>Casting</strong><br />
A given casting modulus can be determined by measuring the volume and surface area independently.<br />
For simple shapes this is relatively straightforward as indicated by the examples below:<br />
BAR<br />
Because of the large inequalities in the bar modulus, the term 2wt is insignificant compared to<br />
2L(w + t), and thus an estimate of the bar modulus becomes:<br />
M = wt / 2(w + t) = Cross Sectional Area of the Bar / Perimeter of the Bar<br />
PLATE<br />
CUBE<br />
t<br />
t<br />
B S (C)<br />
w<br />
L<br />
W<br />
V = LWt<br />
A = 2(L W + Wt + Lt)<br />
M = LWt / 2(L W + Lt + Wt)<br />
a<br />
L<br />
a<br />
RISER<br />
a<br />
57<br />
DRAG<br />
V = Lwt<br />
A = 2L(w + t) + 2wt<br />
M = Lwt / [2L(w + t) + 2wt]<br />
V = a 3<br />
A = 6a 2<br />
Riser Sleeve (Insulator)<br />
BS (R)<br />
Parting Line<br />
B S (R) > B S (C)<br />
M = a/6<br />
A bar is defined as a shape in<br />
which the length, L, is much<br />
greater than the width, w, or<br />
thickness, t. i.e. L>>w, L >> t,<br />
and w = t.<br />
A plate is de• ned as a shape<br />
in which the lengt,L, and<br />
width, W, are similar and<br />
much greater than the<br />
thickness, t.<br />
i.e. L = W > > t<br />
Using logic similar to bar above, because<br />
LW >> Lt + Wt, we can neglect latter.<br />
Thus an estimate of Plate Modulus is<br />
M = t / 2
Location of Riser, Size and Shape of Riser<br />
A riser or risers will be appropriately attached to the section of casting with the largest<br />
modulus. An example of a step bar is shown below:<br />
4”<br />
12”<br />
A<br />
1/4”<br />
This casting is represented by 3 plates with moduli<br />
M A = 0.25 / 2 = 0.125 in.<br />
M B = 0.5 / 2 = 0.25 in.<br />
M C = 1.0 / 2 = 0.5 in.<br />
Since M B > 1.1 M A and M C > 1.1 M B , then the B section of the casting acts as a riser for A and<br />
thus the C section will act as a riser for B.<br />
There fore a riser will be needed only to successfully feed the heaviest section of the casting, section<br />
C. Choices include a top riser at point T or a side riser at point S on the large end of the step<br />
bar. Both choices will be effective feeders, the actual one chosen being determined by a number of<br />
other practical factors. More often the side mounted riser is chosen for ease of removal.<br />
Riser Shape-<br />
The most efficient shape for a riser is a sphere, a shape which minimizes the surface area<br />
to volume ratio thereby maximizing V/A. However, practical molding considerations favor cylindrical<br />
shapes with a height approximately 2 times the diameter (h = 2d).For this h/d ratio it can be<br />
shown that (A good student exercise) the moduli of the top and side mounted risers are:<br />
Top Riser, M R = 2d / 9<br />
Side Riser, M R = d / 5<br />
58<br />
1/2”<br />
B<br />
4”<br />
T<br />
S<br />
C<br />
4”<br />
1”
Thus a side riser on the step bar requires a riser with a modulus M R = d/5 = 1.1M C = 0.55 in.<br />
A schematic side view of the casting would look like this.<br />
This is an adequate size riser for this casting. However it is important to make sure the riser connection<br />
is large enough so that it does not solidify before the casting. Because of the complexity<br />
of the heat transfer situation near the gate connection, they are often arrived at by trial and error.<br />
The effectiveness of a riser is also determined by whether the riser is considered “hot” or “cold”.<br />
Hot and cold risers are defined in terms of their relationship to the gating system of the casting.<br />
This is illustrated in the top view of a system containing both a hot and a cold riser.<br />
Base of<br />
Down Sprue<br />
A<br />
All Molten <strong>Metal</strong> Entering The<br />
<strong>Casting</strong> Passes Through the “HOT”<br />
Riser Thereby Heating and Making<br />
It More Ef fective<br />
Runner<br />
Riser 1<br />
“HOT”<br />
Path of <strong>Metal</strong> Flow<br />
B<br />
<strong>Casting</strong><br />
Clearly from a fundamental heat transfer point of view the cold riser needs to be larger than the<br />
hot riser to accomplish feeding equivalent casting section sizes. Risers are also classified as blind<br />
or open, these varieties being defined in the sketch below:<br />
59<br />
d<br />
h<br />
2.75” 5.5”<br />
C Riser Connection<br />
The Molten <strong>Metal</strong> that Enters<br />
The “COLD” Riser Has Already<br />
Passed Through the <strong>Casting</strong>, is<br />
only a portion of the <strong>Metal</strong> Entering<br />
the <strong>Casting</strong> and is therefore Colder<br />
Riser 2<br />
“COLD”<br />
OPEN RISER (Open to Atmosphere) BLIND RISER (Surrounded by Sand)
Number of Risers-<br />
The number of risers needed to effectively feed a casting depends upon casting geometry<br />
and feeding distance required. This can be illustrated by considering the two bar castings shown<br />
below:<br />
t = 4”, w = 4”<br />
t = 4”, w = 4”<br />
R R<br />
16”<br />
oooooooooooooo ooooooooooooo<br />
The modulus of both bars is given by the estimate, M C = Cross Sectional Area (4x4) / Perimeter<br />
(16) = 4x4 / 16 = 1 The minimum requirement is that one riser with a modulus, M R = 1.1 would<br />
be sufficient. Using the top riser formula for a riser with h = 2d, M R = 2d / 9, gives a cylindrical<br />
riser with d = 4.95” and h = 9.9”. Common sense would tell one that the best position for the riser<br />
in each case would be in the middle of each bar at the positions marked R on the sketch. Thus the<br />
riser on the short bar would be required to feed all of the shrinkage in the 16 inch bar, while the<br />
same riser on the long bar would be required to feed 100 inches. While this may be satisfactory<br />
for the short bar, common sense again tells us that it is likely that the long bar would contain some<br />
shrinkage along the centerline of the bar, perhaps not near the riser or at the ends of the bar but in<br />
the mid regions indicated on the sketch with o’s. In fact, sectioning the bar along the centerline<br />
would reveal a situation similar to the sketch for the long bar. Apparently each riser and each bar<br />
end is effective at promoting a sound (NO VOIDS) casting immediately adjacent to either the bar<br />
end or the riser. The sound distance from the riser along the bar is said to be the Riser Effect, RE<br />
shown on the sketch, and the sound distance from the end of the bar is said to be the end effect,<br />
EE, both of which are shown on the above sketch of the 100” bar.<br />
Work on steel bar castings has shown that the gradient in temperature along the centerline, dT/dx,<br />
is a critical parameter in relating to whether voids form or not. It was shown from steel bars which<br />
60<br />
100”<br />
RE EE
were instrumented with thermocouples along the centerline that voids were likely when dT/dx fell<br />
below a certain amount.. This is shown schematically below:<br />
AT SOME TIME, t, AFTER POURING<br />
It can be seen in the above figure that the gradient, dT/dx, is greatest at the end of the bar in contact<br />
with the cold mold and at the riser in contact with the hot reservoir of molten metal. It was<br />
observed that when dT/dx at any time was less than a critical minimum value, (dT/dx) C , that<br />
shrinkage voids formed at the centerline. Of course, the longer the distance between the end of<br />
thebar and the riser, the more likelihood of voids. This then explains in a more rigorous way why<br />
the voids show up in the long bar on the previous page and not in the short bar.<br />
Thus each end of the bar and each riser is responsible for producing sound material. Selection of<br />
the number of risers needed then requires that the RE and EE for each material be known and then<br />
the risers positioned so that the RE and EE overlap, or at least butt together. For steel bar type<br />
castings it has been determined that RE = 1.5 t and EE = 2 t. Thus for a bar with t = 4”, the RE =<br />
6” and the EE = 8”, and then the farthest distance that a riser can be placed from the end of a bar<br />
and still result in a sound bar would be the distance RE + EE = 14”. The contribution to sound bar<br />
castings from each riser would then be the riser diameter plus 2RE (feeding in both directions).<br />
For the 4” bar above, then, the maximum distance fed for each riser is 4.95 + 12 = 16.95”. Determination<br />
of the number of risers needed for the 100” bar is determined as follows:<br />
No. of Risers = (100 - 2EE) / (2RE + d) = 4.96, or 5 risers distributed uniformly along the<br />
length with the end risers 14 inches from the end of the bar.<br />
<strong>Casting</strong> Yield<br />
(dT/dx) 1<br />
(dT/dx) 2<br />
The casting yield is defined as the ratio :<br />
<strong>Casting</strong> Yield (CY) = Weight of <strong>Casting</strong>s Shipped x 100%<br />
Weight of <strong>Metal</strong> Poured<br />
It is obvious that the goal for a metal casting plant would be to make casting yield as high as possible.<br />
It is also obvious that the riser size and number of risers has a big impact on the casting<br />
yield. It is common practice for metal casting plants to have overall casting yields of between 40<br />
and 80%. Maximization of the yield will involve reducing the number and size of the risers as an<br />
61<br />
Riser<br />
(dT/dx) 3<br />
Instrumented<br />
Centerline
important contributor. Of course, reducing the size of the gating system will also have a significant<br />
effect on casting yield. Two of the most common ways to increase yield are (1) to add insulating<br />
riser sleeves so that B S (R)can be increased (see earlier discussion) and (2) to add “chills”<br />
to the mold to induce stronger thermal gradients (dT/dx) thereby extending the end effect, or to<br />
actually add end effects in between risers. This effect of ”chills”, usually blocks of iron or other<br />
metal set into the mold, is illustrated below:<br />
EE + t RE RE + EE RE + EE RE EE<br />
“CHILLS”<br />
The actual increase in length of sound casting due to chills varies from one material to the next,<br />
but for steel bars a chill on the end of the bar will increase the EE by the bar thickness,t, while<br />
chills placed between risers will add at least an EE in either direction.<br />
IX. Heat Transfer and Solidification in Permanent Molds<br />
Heat transfer between liquid metal and a permanent mold can also be described mathematically<br />
in much the same way as was done for heat transfer in insulating molds. The major difference<br />
here is that the mold material has a much larger thermal conductivity than sand, and so the<br />
solidification will be much more rapid. In the insulating mold the rate of transfer in the sand was<br />
the rate limiting step. In permanent molds the rate limiting step is at the interface between the<br />
metal and mold, where heat is transfered between the solidifying metal and the permanent mold, a<br />
mold which is usually coated with a mold wash or may quickly develop an air gap. The parameter<br />
which defines the transfer of heat between metal and mold in these cases is called the heat transfer<br />
coefficient, h. The model describing this event is illustrated below:<br />
Molten <strong>Metal</strong><br />
x - 0<br />
Permanent Mold<br />
Heat Flow Rate Across Interface<br />
dQ = - Ah[T m - T0 ]dt<br />
+ x<br />
Distance<br />
Notice in this schematic that the temperature drops discontinuously at the mold - casting interface.<br />
Heat flow within the casting and in the mold is very rapid (High Thermal Conductivity) compared<br />
62
to the relatively slow transfer across the interface. Thus the rate of heat removal and therefore<br />
solidification rate depends on the heat transfer coefficient, h, across the interface. The total heat<br />
flow in time t is then given by integrating the above expression, giving:<br />
and therefore for the solidification time,t S :<br />
Using the relationships for Latent Heat and Superheat given earlier, and solving for t S gives:<br />
Writing an expression which is a similar to Chvorinov gives:<br />
t S = B S (V/A),<br />
t S<br />
Q S<br />
Q = − Ah T − T<br />
m 0<br />
=<br />
[ ]t<br />
−Ah<br />
T − T t<br />
m 0 S<br />
ρ<strong>Metal</strong> ∆HF + C<strong>Metal</strong> Tp – Tm [ ( ) ]<br />
------------------------------------------------------------------hT<br />
( m – T0) V ⎛ <strong>Metal</strong>⎞<br />
=<br />
⎜---------------- ⎟<br />
⎝A<strong>Metal</strong>⎠ where B S is a mold constant and V/A is the modulus of the casting.It should be noted that, as<br />
opposed to solidification in a sand mold in which t S varies as the square of the casting modulus,<br />
solidification in a permanent mold varies linearly with the casting modulus.<br />
Finite Element Analysis of Solidification in a Permanent Mold - Die <strong>Casting</strong><br />
Solidification of castings is a process which is quite complicated because of the many<br />
variables which affect the flow of heat during solidification. Some of these variables include:<br />
• Position of Gates and Risers<br />
• Manner in which the Molten <strong>Metal</strong> Enters the Mold Cavity<br />
• Mold Cavity Temperature and Uniformity of Temperature<br />
• Fluid Movement during Solidification<br />
• Pouring Temperature and Time of Pouring<br />
• Mold Material, Interface Material<br />
• Degree of Separation Between Mold and <strong>Metal</strong> During Solidification etc.<br />
Analytic solutions to solidification in complex shaped castings becomes nearly impossible<br />
because of the varied contributions from all of the above variables. Therefore engineers are relying<br />
on the finite element analysis (FEA) approach to solve these problems with the help of the<br />
powerful computers that are now available. The discussion to follow makes an attempt to develop<br />
63
the logic used in FEA to describe a simple solidification problem involving a molten aluminum<br />
cube in a steel mold.Consider the following simple casting:<br />
4<br />
cm<br />
Steel Mold<br />
Aluminum<br />
<strong>Casting</strong><br />
4 cm<br />
Using the above simplified equation for solidification time in a permanent mold and constants<br />
given in Table 7 gives:<br />
tS = 2.385(g/cm 3 ) {[395.995 + 1.080(704-660)](joule / g) / 1.3058 joule / sec cm 2 o C /<br />
(660-149) ( o C)} ( 0.666 cm)=1.055 sec<br />
Of course, this result reflects the assumption that the mold does not change temperature and there<br />
is no indication of when solidification is complete in various places within the casting. A more<br />
realistic representation would involve determining temperature variations within the steel and aluminum<br />
and measuring solidification times in various places within the casting. This will be done<br />
by using the FEA method to first, divide the aluminum and steel into “nodes”, and second to<br />
determine the rate of heat transfer between nodes in discrete time intervals. This method is, of<br />
course, amenable to doing by computer iterations from one discrete time interval to the next. Consider<br />
the following Two Dimensional Nodal Map of the aluminum and steel at time t = 0. This<br />
map shows only one quarter of the casting and mold because symmetry conditions dictates that<br />
the remaining three quarters will behave in exactly the same manner as the one quarter.<br />
1 2<br />
(704) (704)<br />
3 4<br />
(704) (704)<br />
9<br />
(149)<br />
10<br />
(149)<br />
11<br />
(149)<br />
5 6<br />
(149) (149)<br />
7 8<br />
(149) (149)<br />
13<br />
(149)<br />
15<br />
(149)<br />
12 14 16<br />
(149) (149) (149)<br />
Air = (22)<br />
64<br />
Air At t = 0 time<br />
TAl = 704 o C (1300 o F)<br />
TSt = 149 o C (300 o F)<br />
TAir = 22 o C (72 o F)<br />
hAl-St = 2300 BTU / hr ft 2 o F<br />
= 13058 joule / sec m 2 o C<br />
hSt-Air = 1.75 BTU / hr ft 2 o F<br />
= 9.93 joule / sec m 2 o C<br />
Steel mold = 2 cm thick<br />
Al Steel<br />
Initial T = 704 o C Initial T = 149 o C<br />
ASSUME:<br />
1. Temperature within each Node is uniform and<br />
2. Temperature changes by conduction between<br />
nodes of similar material, where<br />
dQ/dt = KA (Tn1 - Tn2 ) / x.<br />
3. Temperature changes by interfacial transfer<br />
between nodes of dissimilar material.<br />
dQ/dt = hA (Tn1 - Tn2 )<br />
4. Heat • ows perpendicular to the node walls.<br />
5. Heat does not • ow in or out of the page.
In the above equations, Q is heat in joules, K is the appropriate thermal conductivity of the metallic<br />
materials (either Al or Steel), the Tn ’s are the temperatures of the nodes, A is the cross sectional<br />
area of each node face (1cm 2 ), x is the distance between node centers (1 cm), and h is the<br />
heat transfer coefficient that applies.Integrating the above equations over the time step ∆t gives<br />
the relationships shown below for heat flow due to conduction and interface transfer. The final<br />
temperature of a node, Tf , resulting from the sum,ΣQ, of the heat components into or out of a node<br />
during the time interval ∆t is also given below, where Ti is the initial temperature, V is the volume<br />
of the node, ρ is the density of the node material, and C is the heat capacity of the node material.<br />
Q = [ KA( Tn1– Tn2) ( ( ∆t)<br />
⁄ x)<br />
] and Q = hA( Tn1– Tn2)∆t The appropriate constants for computation of the Q’s and T f for each node after each time increment<br />
can be obtained from the above numbers for heat transfer coefficients on page 63 and the<br />
data in Table 7 on page 50 of these notes.<br />
Initial Time Increment, ∆t = 0.1 sec<br />
T f<br />
T i<br />
Nodes 1 and 13 do not change temperature during the first increment of time because the<br />
surrounding nodes have identical temperatures. Only those nodes in contact with a different material<br />
respond with heat flow in the first 0.1 sec time interval.<br />
Consider nodes 2 and 5 , shown schematically below.<br />
2<br />
(704)<br />
5<br />
(149)<br />
Q<br />
=<br />
In the first time increment ∆t = 0.1 sec, 72.21 joules of heat flows across the node boundary, leaving<br />
the liquid Al and entering the solid steel mold. This is the only heat flow for either nodes 2 or<br />
5 in the first time increment because there are no other temperature gradients to which these nodes<br />
can respond.(Recall that this is only two dimensional heat flow. We are not allowing heat flow<br />
into or out of the page for simplicity.) Clearly then after 0.1 sec the temperature of node 2<br />
decreases and the temperature of node 5 increases by an amount determined by the heat capacity<br />
(specific heat) of each unit and the mass of the unit. Removing 72.21 joules from node 2 results in<br />
a temperature decrease after 0.1 sec from T2 = 704 to :<br />
65<br />
+<br />
Σ Q<br />
Vρ C<br />
Q = h Al-St A(T 2 - T 5 )∆t<br />
Q = 13058 . (0.01) 2 . (704 - 149) . 0.1<br />
Q = 72.21 joules
T 2 = 704 - 72.21/[13 (2.385) (1.117)} = 704 - 27.1 = 676.9 o C<br />
Adding 72.21 joules of heat to node 5 results in a temperature increase from 149 to:<br />
T 5 = 149 + 72.21 / [13 (7.87) (0.456)] = 149 + 20.12 = 169.12 o C<br />
By symmetry, nodes 3 and 9 are identical to nodes 2 and 5. Nodes 4, 7, and 11 experience change<br />
in the first 0.1 sec as follows. Heat will flow from 4 to 7, and 4 to 11 in the same manner as from<br />
2 to 5 above. Thus nodes 7 and 11 will have the same temperature increase as node 5, from 149 to<br />
169.12 o C. However node 4 will have twice as much heat extracted as node 2 and so the temperature<br />
will be lower than in node 2.<br />
Superheat and Latent Heat to be removed before Solidification is complete.<br />
At this point it is necessary to ask the question: How much heat must be extracted from a<br />
molten Al node before the melting point is reached, and then before the latent heat is extracted?<br />
Superheat in 1 cm 3 Al at 704 = CρV∆T = (1.085) (2.385) (1) (44)= 113.86 joules<br />
Latent Heat in 1 cm 3 of Al = ∆H F ρV = (395.995) (2.385) (1) = 944.45 joule<br />
Thus a total of 1058.31 joules of heat needs to be removed from a node of pure Al at 704 o C<br />
before solidification is complete in that node. Because node 4 has twice as much heat removed<br />
than node 2 in the same time increment, 144.42 joules, node 2 will already have begun to solidify<br />
because more heat than the superheat has already been removed. An estimate can be made of the<br />
fraction of solid present by the ratio: (144.42 - 113.86) / 944.45 = 0.032, or 3.2% of the Al in node<br />
4 has solidified. Thus the temperature of node 4 is 660 o C, and will remain there until the solidification<br />
is complete; i.e. until the remaining 914 joules of latent heat have been removed. The steel<br />
nodes bordering the air at 22 o C, nodes 6,8, 10,12, 14, 15, and16 will also undergo a reduction in<br />
temperature by the amount:<br />
T 6 = 149 - (0.000993) (1) (127) (0.1) = 149 - 0.0126 = 148.9874<br />
Obviously because of the very small heat transfer coefficient between steel and air, the temperature<br />
decreases only a very small amount for those nodes on the outside of the steel mold. Thus the<br />
66
temperatures (rounded off to the nearest degree) in the 16 nodes after the first 0.1 sec of the FEA<br />
is given below:<br />
AFTER TIME 0.1 SEC<br />
1 2<br />
(704) (677)<br />
3 4<br />
(677) (660)<br />
9<br />
(169)<br />
10<br />
(149)<br />
11<br />
(169)<br />
5 6<br />
(169) (149)<br />
7 8<br />
(169) (149)<br />
13<br />
(149)<br />
15<br />
(149)<br />
12 14 16<br />
(149) (149) (149)<br />
Air (22)<br />
The Second Time Increment, ∆t = 0.1 sec (Total Time = 0.2 sec)<br />
The next iteration in the FEA involves more of the nodes in the system because of the temperature<br />
changes resulting in the first time increment. Consider node 1, which now has thermal gradients<br />
between itself and nodes 2 and3.<br />
(704) (677)<br />
1<br />
2<br />
3<br />
(677)<br />
Consider node 2 once again. Node 2 has three inputs to heat flow in the second time increment,<br />
illustrated below:<br />
67<br />
Al Steel<br />
Initial T = 704 o C Initial T = 149 o C<br />
Notes:<br />
1. Node 4 has partially solidi• ed, ~ 3.2%<br />
Shown as dark shaded area.<br />
The net heat change in node 1 is given by:<br />
ΣQ = Q 1->2 + Q 1->3<br />
ΣQ = + (0.9403) (1) (677 - 704) (0.1)<br />
+ (0.9403) (1) (677 - 704) (0.1)<br />
=5.0776 joules<br />
Thus the temperature of node 1 after 0.2 sec is<br />
T 1 = 704 -5.0776 / [1 3 (2.385)1.1 17)]<br />
1 2 5 Thus the net heat change in node 2 is given by:<br />
ΣQ = Q 1->2 + Q 2->5 + Q 2->4<br />
ΣQ = + (0.9403) (1) (704 - 677) (0.1) / (1)<br />
4<br />
+(1.3058) (1) (169 - 677) (0.1)<br />
+(0.9403) (1) ( 660 - 677) (0.1) / (1)<br />
=2.539 - 66.334 - 1.598 = - 65.394 joules<br />
From knowledge of heat content of Al, only 41.65 joules of superheat remain in node 2,<br />
therefore node 2 will begin to solidify in time increment 2, having a fraction of:<br />
(65.39 - 41.65) / 944.45 = 2.5% solid, the temperature decreasing to and remaining at 660<br />
o C.
A similar calculation for node 4 gives:<br />
ΣQ = + 2{(0.9403) (1) (677 - 660) (0.1) / (1)} + 2{(1.3058) (1) (169 - 660) (0.1)}<br />
ΣQ = + 3.197 - 128.229 = - 125.03 joules<br />
This extraction of heat from node 4 removes latent heat only, and so the temperature of node 4<br />
remains at 660 o C. The total fraction of solid after increment 2 in node 4 is given by the ratio of:<br />
155.6 / 944.42 = 0.1647 or 16.47 % solid.<br />
Similarly it can be shown by summing the heat flows for the steel nodes that the temperatures will<br />
increase in the amounts shown below.<br />
Nodes 5 & 9:<br />
ΣQ = 1.3058 (1) (667 - 169) (0.1) + [0.782 (1) (149 - 169) (0.1) / (1)] = 64.77 joule<br />
T f = 169 + 64.77 / [ (1) (7.87) (0.456)] = 187.05<br />
Nodes 7 & 11:<br />
ΣQ = 1.3058 (1) (660 - 169) (0.1) + 2[0.782 (1) (149 - 169) (0.1) / (1)] = 60.99 joule<br />
Node 13:<br />
T f = 169 + 60.987 / [ (1) (7.87) (0.456)] = 185.99<br />
ΣQ = 2[(0.782) (1) (169 - 149) (0.1) / (1)] = 3.128 joules<br />
T f = 149 + o.87 = 149.87<br />
Nodes 6, 8, 10, and 12:<br />
ΣQ = (0.78) (1) (169 - 149) (0.1) / (1) + (0.00099) (1) (22 - 149) (0.1) = 1.55 joule<br />
T f = 149 + 1.552 / [(1) (7.87) (0.456)] = 149.432<br />
Nodes 14, 15, & 16 lose only 0.012 joules, thereby changing only a fraction of a degree (no<br />
change).<br />
68
The temperature distribution (rounded off to the nearest degree) after 2 increments of 0.1 sec time<br />
is illustrated below:<br />
1 2<br />
(702) (660)<br />
3<br />
(660)<br />
AFTER TIME 0.2 SEC<br />
9<br />
(187)<br />
10<br />
(149)<br />
4<br />
(660)<br />
11<br />
(186)<br />
5 6<br />
(187) (149)<br />
7 8<br />
(186) (149)<br />
13<br />
(150)<br />
15<br />
(149)<br />
12 14 16<br />
(149) (149) (149)<br />
Air (22)<br />
Thus solidification and the temperature distribution in the entire casting - mold configuration can<br />
be observed by systematically:<br />
I Summing the Heat Flows into Each Node During Each Time Increment<br />
II. Computing the Change in Nodal Temperature As a Result of That Heat Flow<br />
Problem:<br />
Continue the heat flow scenario described above until solidification is complete in node 1.<br />
Report your results at critical periods in the process by:<br />
a. Including distributions like the above showing the progress of solidification<br />
b. Including cooling and heating curves for nodes 1,2,4,5,7,13, and 16 on one graph.<br />
Clearly the best way to do this work would require a computer program to carry our your iterations.<br />
IT WILL BE ACCEPTABLE FOR GROUPS OF UP TO THREE PEOPLE TO TURN IN<br />
ONE PAPER.<br />
X. Continuous and Semicontinuous <strong>Casting</strong><br />
Continuous <strong>Casting</strong> of Steel<br />
The objective of continuous casting is to produce large, simple shapes for subsequent<br />
forming operations, a process which has been carried to great lengths with the continuous casting<br />
of steel slabs and bars. Prior to the mid 1960s, all of the steel produced in the United States was<br />
done by casting into large ingot molds (usually cast iron) followed by ingot breakdown in the hot<br />
rolling mills, a relatively inefficient process both thermally (ingots would have to cool significantly<br />
for handling, and then be heated again prior to breakdown) and from a casting yield standpoint<br />
(approximately 80% of the ingot is usable for the production of semi-finished products).<br />
According to the 10th edition of “Making, Shaping, and Heat Treating of Steel”, continuous casting<br />
of steel has had the greatest impact (of all technologies developed and applied in the steel<br />
industry) on improving the efficiency of material utilization, the yield increasing from 80% in<br />
69<br />
Al Steel<br />
Initial T = 704 o C Initial T = 149 o C<br />
Notes:<br />
1. Node 4 has partially solidi• ed, ~ 16.5%<br />
2. Nodes 2 and 3 have partially solidi• ed, ~2.5%<br />
Solidi• ed part shown as dark shaded area.
ingot casting to 95% in continuous casting. The growth of continuous casting of steel in the<br />
United States as well as the demise of ingot casting is shown in the Figure below:<br />
100<br />
80<br />
60<br />
40<br />
20<br />
0<br />
United States<br />
Steel Production<br />
Data From “Making, Shaping,<br />
and Heat Treating of Steel”, 10th Ed.<br />
& 1995 AISI Statistical Report<br />
1960 1968 1976 1984 1992 2000<br />
Year<br />
The continuous casting process is illustrated below together with a schematic of a conventional<br />
ingot mold.<br />
Water Cooled Mold<br />
Water Spray<br />
Liquid Steel Sump<br />
Solid Steel<br />
The process of continuous casting involves supplying a tundish (storage and transfer vessel) with<br />
molten steel and then metering that steel into a water-cooled mold whose bottom is the steel billet<br />
or slab. This slab or billet is bent as it moves and large conveniently sized pieces are cut or<br />
sheared for further processing. It should be noted that the liquid sump can extend a significant distance<br />
down into the casting. The operators must be careful so that remelting doesn’t occur and<br />
cause a runout. Other advantages over conventional ingot casting in addition to increased efficiency<br />
include higher production rates, and finer microstructures (smaller dendrite arm spacings)<br />
due to water cooling the smaller cross-section castings. The finer dendrite arm spacing is a structure<br />
which is more easily deformed and less likely to fail during that mechanical processing. In<br />
addition, the larger section ingot castings are more likely to be plagued by macrosegregation, in<br />
which segregation due to gravity differences produce significant change in chemical composition<br />
from one point to another on a macroscale.<br />
70<br />
Continuous<br />
Ingot<br />
Tundish Conventional<br />
Ingot<br />
Saw or Shear
Semi - Continuous casting of Aluminum Alloys, Free machining brass<br />
Continuous casting is clearly the most efficient way to produce stock for further mechanical processing<br />
of metals. However the casting of non-ferrous alloys based on aluminum or copper is<br />
most often done in a semi-continuous mode, a schematic of which is indicated in the above figure.<br />
Initially the base block is snug up against the water-cooled mold. <strong>Casting</strong> commences by pouring<br />
directly onto the base block and then moving the base block downward as solidification<br />
progresses. There is no attempt to bend the casting. Rather the casting extends down into a well,<br />
typically 20 to 30 feet deep. When the base block reaches the bottom of the well the casting process<br />
is over. Most aluminum alloys produced for wrought applications are made this way, producing<br />
ingots about 20 feet long by 3-4 feet wide by 1.5-2 feet thick. Free machining brasses (Cu-<br />
35Zn-3Pb) are produced in a similar way with three cylindrical “logs” produced simultaneously<br />
with dimensions of about 12 inches by 20 - 30 feet long. Advantages of this technique over static<br />
cast ingots are the same as given above for the continuous cast steel. Continuous casting of some<br />
non-ferrous products does occur but the relative proportion is quite small.<br />
71<br />
Water Spray<br />
Liquid Sump<br />
Solid <strong>Casting</strong><br />
Tundish<br />
Water Cooled Mold<br />
Base Block
Microstructure of Continuous and Semi-continuous <strong>Casting</strong>s<br />
The microstructure of castings produced in this way is illustrated below:<br />
Q<br />
Q Q<br />
Plane of<br />
Weakness<br />
Q<br />
Typical Continuous Cast Billet Grain Structur e, As-Solidi• ed<br />
This schematic illustrates the basic process of grain (dendrite) nucleation and growth in a continuous<br />
cast billet. The above cross section illustrates the three common grain structures observed in<br />
these types of castings. The outer “chill” layer is made up of a very fine equiaxed grain structure<br />
which has nucleated as a result of the large undercooling present at the surface. This quickly<br />
changes to a columnar structure which extends from the chill layer in towards the center of the<br />
casting, the columnar (long and narrow) grains (dendrites) being extensions of chill grains (in<br />
favorably oriented [100] directions) which grow parallel to the direction of heat flow. During the<br />
columnar growth time, nucleation of new grains (dendrites) occurs in the remaining liquid volume<br />
in the center of the billet, grains which grow in an equiaxed manner into the remaining liquid.<br />
Solidification is complete when the columnar grains encounter the growing equiaxed grains. It is<br />
thought that the nuclei which ultimately end up as the equiaxed grains in the center come from the<br />
growing columnar dendrites, where secondary arms have broken off of the columnar dendrites (as<br />
a result of chemical, mechanical or thermal instabilities in the melt) and have been swept out into<br />
the liquid. These nuclei then either survive and grow giving the equiaxed grains, or are remelted<br />
in the remaining liquid allowing the columnar grains to grow to the center of the casting. The<br />
occurrence of the columnar zone is not a favorable structure for hot working processes, the contact<br />
area between columnar zones at right angles to each other being a dumping ground for segregants,<br />
porosity, inclusions, etc. which become effectively planes of weakness (see the above<br />
schematic) in the casting. It is therefore desirable to produce castings which have no columnar<br />
zone, a situation which is favored by reducing the superheat (increasing the chances of nuclei survival<br />
in the center), or by stirring the liquid thereby mechanically removing some dendrite arms<br />
for transport to the central part of the casting. Stirring can be accomplished in certain instances<br />
72<br />
Chill Zone - Equiaxed, Fine<br />
Grained Structure on surface<br />
of casting (many nuclei)<br />
Columnar Zone -Elongated<br />
Grains extending from Chill<br />
Zone toward Center of Billet<br />
(originate as favorably<br />
oriented chill zone grains)<br />
Equiaxed Zone - Equiaxed,<br />
Large Grains which form in<br />
the last part of the billet to<br />
solidify.<br />
Q = Heat
electromagnetically, and in other cases by shaking or moving the casting to generate shock waves<br />
which affect the arms of the growing dendrites. The idea of chemical, thermal, or mechanical<br />
forces dislodging dendrite arms to send them into other parts of the solidifying casting can be better<br />
understood when the physical shape of these dendrite arms is considered.This reality is<br />
described in the schematic below:<br />
Photographs of dendrites in real crystals inevitably reveal situations which look remarkably like<br />
the above sketch. There is no direct proof that these “released” arms are in fact the source of the<br />
equiaxed grains in the center of the castings, but the circumstantial evidence is almost overwhelming.<br />
XI. Solidification, Binary System<br />
Equilibrium Solidification<br />
Equilibrium solidification in a binary system<br />
assumes that diffusion occurs within the solid<br />
and adequate mixing occurs in the liquid so that the<br />
compositions described by the phase diagram are<br />
obeyed. The attached schematic phase diagram is<br />
used in the description of both equilibrium and<br />
non-equilibrium solidification. During equilibrium<br />
solidification the first phase to appear is the<br />
terminal solid solution α of composition kC o at the<br />
temperature T L , where k is the equilibrium distri-<br />
bution coefficient and C o is the alloy composition.The<br />
equilibrium distribution coefficient is<br />
defined as the ratio of the composition of the solid<br />
to that of the liquid at a given temperature, a value<br />
which can be determined from the phase diagram.<br />
Solidification is complete at temperature T 0 and<br />
the composition of solid reaches C o . The lever rule can be used to compute the weight percentage<br />
of the phases α & β present in the temperature range T L to T 0 .<br />
Non Equilibrium Solidification<br />
In real situations involving solidification, the largest departure from equilibrium results<br />
from the fact that diffusion in solids usually cannot maintain equilibrium in the solid state during<br />
solidification. In alloys with substitutional solute atoms which diffuse by a vacancy mechanism,<br />
the number of vacancies and the statistical nature in which they move preclude the solid phase<br />
maintaining the composition required by the phase diagram during the time available to the solidifying<br />
casting. Only those solutes which are interstitial and have mostly empty neighboring sites<br />
(carbon in iron for example) can even hope to keep up with the dictates of the phase diagram. In<br />
the above figure, then, the composition kCo of the initial solid to form remains at or near that<br />
value during and after casting. With cooling below T L the new solid to form will obey the phase<br />
diagram and be richer in solute than the first to form. The net result of this is that when the temperature<br />
T 0 is reached THE AVERAGE COMPOSITION OF THE SOLID α IS LESS THAN C o<br />
and there is still some liquid left; the casting must go to lower temperatures before solidification is<br />
73<br />
Temperature<br />
T L<br />
<br />
<br />
<br />
<br />
<br />
<br />
<br />
<br />
<br />
<br />
T 0<br />
<br />
α α <br />
+ L<br />
<br />
<br />
<br />
<br />
<br />
<br />
<br />
<br />
<br />
<br />
<br />
<br />
<br />
<br />
<br />
<br />
<br />
<br />
<br />
<br />
Co CM kCo <br />
Liquid, L<br />
α + β<br />
<br />
<br />
<br />
<br />
<br />
<br />
T E<br />
<br />
CE Wt. Pct Solute<br />
L + β
complete. In eutectic systems like the one shown above, the final temperature of solidification<br />
will in fact be the eutectic temperature, T E . The practical result of this situation is that real castings<br />
are not homogeneous in composition throughout, with alloy segregation occurring on a<br />
microscopic scale.<br />
The Scheil Equation<br />
The simplest way to illustrate this non-equilibrium situation is to consider the one dimensional<br />
solidification of an alloy of composition Co under the conditions where NO SOLID STATE<br />
DIFFUSION OCCURS and WHERE COMPLETE MIXING IN THE LIQUID OCCURS; i.e. the<br />
liquid maintains equilibrium with the solid interface during cooling and the solid interface will<br />
change composition in equilibrium with the homogeneous liquid. This can be visualized by considering<br />
the following schematic ONE DIMENSIONAL solidification process where the solid -<br />
liquid interface will move as a planar interface from right to left in response to the heat being<br />
extracted to the left.<br />
Q<br />
Q<br />
Q<br />
Q<br />
Solute Composition (Weight %)<br />
Solid<br />
<br />
<br />
<br />
Solid<br />
<br />
<br />
<br />
<br />
<br />
<br />
Liquid (Complete Mixing)<br />
Solid (No Solid State Diffusion)<br />
<br />
<br />
<br />
<br />
<br />
<br />
<br />
<br />
<br />
<br />
<br />
<br />
<br />
<br />
<br />
<br />
<br />
Liquid Composition<br />
<br />
<br />
<br />
C <br />
<br />
E<br />
<br />
Solid Composition<br />
<br />
<br />
<br />
<br />
<br />
<br />
<br />
<br />
<br />
<br />
<br />
<br />
<br />
<br />
<br />
<br />
<br />
<br />
CM <br />
<br />
<br />
<br />
<br />
<br />
<br />
<br />
<br />
<br />
<br />
C<br />
<br />
o<br />
<br />
<br />
kCo 0<br />
Fraction Solid, f<br />
1<br />
In the above sketch it can be seen that the solid composition starts at kCo on the left and then<br />
gradually increases in a non-linear fashion as solidification progresses to the right increasing until<br />
the maximum solubility of solute in α is reached , C M at T E . At the same time the liquid composition<br />
increases overall until the eutectic composition is reached at the eutectic temperature. At<br />
this point the remaining liquid will undergo a eutectic reaction forming α + β. It can be shown<br />
74<br />
<br />
<br />
<br />
<br />
<br />
t = 0<br />
T = TL t = t1<br />
t = t2<br />
t = t3<br />
T = T E
that the equation describing the non-linear solid composition, CS , from left to right is known as<br />
the Scheil equation, given below:<br />
CS = kCo {1/(1- f)} 1-k<br />
This variation in composition describes quantitatively the segregation of solute in a binary alloy<br />
which has solidified under these one dimensional conditions of planar interface movement. Of<br />
course most real solidification events involve the formation and growth of dendrites, which is not<br />
a planar solidification event on a macroscale. However on a microscale during solidification<br />
between dendrite arms, the planar front description is a fairly accurate representation of dendrite<br />
arm fattening after the dendrite has already been established.<br />
This is shown in the following schematic representation of dendritic <br />
<br />
<br />
<br />
<br />
<br />
<br />
<br />
<br />
<br />
growth.<br />
Solute Composition<br />
<br />
<br />
<br />
<br />
<br />
<br />
<br />
<br />
<br />
<br />
<br />
<br />
<br />
<br />
<br />
<br />
d, Dendrite Arm Spacing <br />
<br />
<br />
<br />
<br />
<br />
Cored<br />
Solid<br />
<br />
<br />
<br />
<br />
<br />
<br />
<br />
<br />
<br />
<br />
<br />
<br />
<br />
<br />
<br />
<br />
<br />
<br />
<br />
<br />
<br />
<br />
<br />
<br />
Eutectic<br />
Liquid<br />
<br />
<br />
<br />
<br />
<br />
<br />
<br />
<br />
<br />
<br />
<br />
<br />
It can be seen in the above sketch that the fattening of dendrite arms mirrors on a microscale the<br />
one dimensional growth pictured on page 74. Even though the conditions of solidification on a<br />
macroscale is definitely not planar front solidification (dendritic growth is quite the opposite of<br />
planar front solidification in which the dendrite arms race out into the liquid in response to compositional<br />
and thermal fluctuations at the solid - liquid interface) the conditions for growth (fattening)<br />
in between dendrite arms approximate the conditions of no solid state diffusion and<br />
complete mixing in the liquid required to develop the Scheil Equation. This is because the dendrite<br />
arm spacing is quite small, on the order of 10 to 100 microns (0.01 to 0.1 millimeters), and<br />
liquid state diffusion is rapid enough to accomplish mixing in the microvolume between dendrite<br />
arms. Typically liquid state diffusion coefficients are on the order of 10-6 cm 2 / sec. Using the<br />
time tested relationship between the distance an atom can move x, and the diffusion coefficient<br />
D, and time t, [x = (Dt) 1/2 <br />
<br />
<br />
<br />
<br />
<br />
<br />
<br />
<br />
<br />
<br />
<br />
<br />
<br />
<br />
<br />
] , gives x = 0.1 mm for a reasonable solidification time of 100 seconds.<br />
This means that atomic diffusion of solute within the liquid is sufficient to maintain a reasonably<br />
uniform composition in those microvolumes. In the schematic above the final product consists of<br />
75<br />
<br />
<br />
<br />
<br />
<br />
<br />
<br />
Cored <br />
<br />
Solid<br />
<br />
<br />
<br />
<br />
<br />
<br />
<br />
<br />
<br />
<br />
<br />
<br />
<br />
<br />
<br />
<br />
<br />
<br />
<br />
<br />
<br />
<br />
<br />
<br />
<br />
<br />
<br />
<br />
<br />
<br />
<br />
<br />
<br />
<br />
<br />
<br />
<br />
CE <br />
<br />
<br />
<br />
<br />
<br />
<br />
<br />
<br />
<br />
<br />
<br />
<br />
<br />
<br />
<br />
<br />
<br />
<br />
<br />
<br />
<br />
<br />
<br />
<br />
<br />
<br />
<br />
<br />
<br />
<br />
<br />
<br />
CM <br />
<br />
<br />
<br />
<br />
<br />
<br />
<br />
<br />
<br />
<br />
<br />
<br />
<br />
Co<br />
<br />
<br />
<br />
<br />
<br />
<br />
<br />
<br />
<br />
<br />
<br />
<br />
<br />
<br />
<br />
kCo <br />
<br />
<br />
<br />
<br />
<br />
<br />
<br />
<br />
<br />
<br />
<br />
<br />
<br />
<br />
<br />
<br />
<br />
<br />
<br />
Dendrite Arm Fattening<br />
Coring (No SSD, Complete<br />
Mixing in Liquid)<br />
Dendrite Arm Lengthening<br />
Scheil Equation Relationship<br />
in solid dendrite illustrating<br />
MICROSEGREGATION OF<br />
SOLUTE (Copper in Al)
dendrite arms (the center of which represents the first to freeze (FTF) part of the casting) with a<br />
gradient of solute perpendicular to the dendrite arm (coring) and a volume of eutectic product<br />
between the dendrite arms representing the last to freeze (LTF) part of the casting. This is a very<br />
common configuration in commercial cast microstructures. Of course most commercial cast<br />
materials are multicomponent alloys in which there may be several major solute species added for<br />
one reason or another. Those solutes with equilibrium distribution coefficients, k, less than 1 (Cu<br />
in Al) will segregate in the manner shown above, solutes described as positive segregants. Solutes<br />
with an equilibrium distribution coefficient greater than 1 (Ni in Fe) will segregregate in the<br />
opposite way, with decreasing solute content as the dendrite fattens. These solutes are said to segregate<br />
negatively.<br />
XII. Aluminum Alloys<br />
Aluminum is a very important metal because of its low density and excellent mechanical<br />
properties, properties which stem largely from its face centered cubic crystal structure. It is<br />
alloyed with elements like Mg, Si, Cu, Mn, Fe, etc. to produce a variety of wrought products from<br />
beverage cans to aircraft structural parts, to cast products like engine blocks and steering knuckles<br />
for automobiles. The figure below illustrates the amounts of primary and secondary aluminum<br />
produced and the amount shipped in the year 1989 for beverage can and casting production:<br />
U.S. Production of Al<br />
Primary<br />
Aluminum<br />
4.03 Secondary<br />
Aluminum<br />
2.05<br />
New<br />
1.04<br />
Old<br />
1.01<br />
Wrought<br />
& Cast<br />
Products<br />
Beverage<br />
Cans<br />
1.37<br />
Numbers in Million Metric Tons (1989 Data)<br />
It can be seen that the bulk of the aluminum produced in the U.S. goes into the production of<br />
wrought products. An example of the largest single product tonnage-wise is the production of<br />
beverage cans; more aluminum is used in the production of beverage cans in a given year than is<br />
used in the production of castings for all applications. Another significant industrial fact is that a<br />
large fraction of the secondary aluminum production comes as a result of the recycling of bever-<br />
76<br />
Partial U.S. Consumption of Al<br />
Sand<br />
0.112<br />
<strong>Casting</strong>s<br />
Permanent<br />
& Semi-<br />
Permanent<br />
0.196<br />
Die<br />
0.690<br />
Aluminum Statistical Review for 1990; The Aluminum Association
age cans; about 60 percent of the material used to produce beverage cans in 1989 were recycled<br />
through the secondary market, a good source of material for casting production.<br />
Aluminum <strong>Casting</strong> Alloys<br />
The most important aluminum casting alloys, on a tonnage basis, are those which depend upon<br />
the eutectic reaction to improve castability, to lower energy input and pouring temperature, and to<br />
produce desirable cast microstructures. These aluminum alloys contain primarily Si, Mg, and Cu.<br />
The details of the phase diagrams for binary and ternary alloys containing these elements can be<br />
found in the appropriate handbooks. Details of aluminum foundry products and cast aluminum<br />
properties are given in the <strong>Metal</strong>s Handbook, ninth edition, pages 140 - 179; the student is encouraged<br />
to read those sections.<br />
Processing and Microstructure of Several Selected Al - base Si Alloys<br />
Alloy 356.2 (Nominal Composition 7 Si, 0.1 Cu, 0.35 Mg, 0.05 Mn, 0.12 max Fe)<br />
This hypoeutectic Al - Si base alloy represents an important aluminum casting alloy, an<br />
alloy utilized for higher strength and ductility automotive and aircraft applications. The function<br />
of the alloy elements present are as follows:<br />
Si - Lowers solidification temperature, promotes good castability, improves wear<br />
resistance.<br />
Mg - Combines with Si during heat treatment to produce Mg 2 Si precipitates in the<br />
aluminum rich a matrix.<br />
Cu - Strengthens matrix by solid solution strengthening and through precipitation<br />
hardening<br />
Fe - minimum amount reduces negative effect of platelets of Fe 2 Si 2 Al 9 .<br />
Solidification of 356.2<br />
Solidification of this material involves the production first of proeutectic aluminum rich α<br />
dendrites followed by the formation of the eutectic product containing primarily aluminum and<br />
platelets of silicon. A schematic cooling curve for such a solidification event is given below:<br />
α<br />
660.4 0 C<br />
1.65<br />
α + L<br />
7<br />
577 0 C<br />
α + β<br />
Liquid, L<br />
12.6<br />
Weight Percent Si<br />
L + β<br />
77<br />
Eutectic α + β<br />
Time<br />
Proeutectic α
Schematic microstructures similar to this alloy are shown in the first laboratory handout. The<br />
presence of Mg and Fe in this alloy gives an opportunity for the formation of a chinese-script<br />
eutectic of α + Mg 2 Si and platelets of Fe 2 Si 2 Al 9 in addition to the Si platelets. These plate-shaped<br />
phases produced in typical sand castings provide easy crack nucleation sites and propagation<br />
paths , thereby resulting in relatively low strengths and ductility.<br />
Modification of 356.2<br />
In applications where strength and ductility are not important, the sand castings with the plateshaped<br />
second phase morphology is considered acceptable. However, higher strengths and ductilities<br />
can be realized by the addition of small amounts of Na or Sr to the melt (a process called<br />
modification) just prior to pouring the castings (See section on additives in these notes). This<br />
additives effectively changes the shape of the silicon from plates to rods thereby reducing the<br />
crack nucleation and propagation potential. See the schematic modified microstructure in the laboratory<br />
handout #1. This process has the potential to double the ductility and increase the strength<br />
by 25 %.<br />
Age Hardening 356.2<br />
Following solidification, the 356.2 alloy castings can be further strengthened by precipitation of<br />
the Mg 2 Si as fine coherent particles within the a matrix. [The student is urged to consult an appropriate<br />
physical metallurgy text for a basic description of the fundamentals of precipitation hardening.]<br />
The heat treatment schedule needed for this process is given below together with a quasibinary<br />
phase diagram for the aluminum - Mg 2 Si system:<br />
660 0 C<br />
α<br />
1.85<br />
α + L<br />
595 0 C<br />
L<br />
13<br />
α + Mg 2 Si<br />
Wt Pct Mg 2 Si<br />
Typical Heat Treatment Schedule<br />
Solution Treat<br />
12 hour<br />
150 - 155<br />
The solution treatment time of 12 hours at 525 O C is designed to dissolve the eutectic Mg2Si particles<br />
in the a solution (which formed as a result of segregation, coring, during solidification) and<br />
to redistribute the Mg and Si uniformly throughout. It is known that up to 1.85 wt. pct. Mg2Si (see<br />
above phase diagram) is soluble in the a matrix at 595 O C. If it is assumed that all of the Mg<br />
which is present in the alloy (0.35 %) can be taken into solution, this gives ~ 0.52 wt. pct. Mg2Si as potential precipitates on aging. Quenching into hot water is followed by aging at 155 for 3 - 5<br />
hours during which time the coherent tiny strengthening precipitates of Mg2Si are formed in the a<br />
78<br />
Water Quench<br />
65 - 100 0 C<br />
Time<br />
520 - 530<br />
Aging Treatment<br />
3 - 5 hours
solid solution.The effect of aging time on the tensile properties of A 356.2 alloys is illustrated<br />
below:<br />
45<br />
40<br />
35<br />
30<br />
25<br />
0 2 4 6 8 10 12<br />
Aging Time (Hours)<br />
Alloy 319.1 (Nominal Composition 6 Si, 3.5 Cu, 0.1 Max Mg, 1.0 Max Fe, 0.1 Max Ni)<br />
This is an important alloy used to produce castings in permanent molds, a hypoeutectic<br />
alloy which, because of the presence of Cu, is also age hardenable. The major elements, Si and<br />
Cu, are present in an amount so that solidification proceeds in a similar way to alloy 356.2,<br />
namely by the production of proeutectic dendrites of α followed by a eutectic reaction in which<br />
both Si and Al 2 Cu can form in eutectic products surrounding the dendrites of α. A microstructure<br />
of this alloy could look like the schematic below:<br />
Fe - Containing Platelets<br />
Fe 2 Si 2 Al 9<br />
Eutectic α<br />
<br />
<br />
<br />
<br />
<br />
<br />
79<br />
Yield Strength<br />
<br />
<br />
<br />
<br />
<br />
<br />
<br />
<br />
Percent Elongation<br />
Data From Shivkumar ,<br />
Keller & Apelian<br />
AFS Transactions<br />
Volume 97, Pg 905 - 91 1<br />
1990<br />
<br />
<br />
<br />
<br />
<br />
<br />
<br />
<br />
<br />
<br />
<br />
<br />
<br />
Section<br />
<br />
<br />
<br />
<br />
<br />
Through<br />
<br />
<br />
<br />
<br />
<br />
<br />
<br />
Proeutectic<br />
<br />
<br />
<br />
<br />
<br />
<br />
<br />
Dendrite<br />
<br />
<br />
<br />
<br />
<br />
<br />
<br />
<br />
<br />
<br />
<br />
Arm<br />
<br />
<br />
<br />
<br />
<br />
<br />
<br />
<br />
<br />
<br />
<br />
<br />
<br />
<br />
<br />
<br />
<br />
<br />
<br />
<br />
<br />
<br />
<br />
<br />
<br />
<br />
<br />
<br />
<br />
<br />
<br />
<br />
<br />
<br />
<br />
<br />
<br />
<br />
<br />
Composition<br />
Distance<br />
10<br />
8<br />
6<br />
4<br />
2<br />
0<br />
Al2Cu Si (β)<br />
<br />
<br />
<br />
<br />
<br />
<br />
<br />
<br />
<br />
SDAS<br />
Cu<br />
Segregation of<br />
Cu and Si<br />
within dendrite<br />
Si<br />
due to “Coring”
In this schematic micrograph the position of the proeutectic α dendrites are shown by dashed lines<br />
to indicate the imaginary boundary between dendritic α and eutectic α. The eutectic Si (β) is<br />
shown as platelets, the eutectic Al 2 Cu as individual particles, and the Fe-rich platelets all share<br />
the interdendritic volume with the eutectic α. In addition the segregation of Cu and Si within the<br />
dendrites (as a result of solidification) is shown as a positive segregation event; i.e. the composition<br />
of both Si and Cu increases with increasing distance from the center of the dendrite. Like the<br />
356.2 alloy, attaining the optimum in mechanical properties will involve a precipitation hardening<br />
treatment, solutionizing at about 500 0 C (put the Al 2 Cu into solution and redistribute the Cu uniformly<br />
in the dendrite arms) followed by hot water quenching and an aging treatment in the range<br />
130 - 190 0 C. Mechanical properties are in the same range as alloy 356.2. Further refinement of<br />
this material can be accomplished by modifying the eutectic with Na or Sr, like alloy 356.2, or by<br />
the addition of a grain refining agent such as TiB; the TiB additive is effective at providing more<br />
nucleation sites for the dendritic α product.<br />
Alloy KS 281 (German ) [Nominal 18 Si, 1.2 Cu, 1.1Mg,
in the form of a Cu - P alloy after the degassing operation (Degassing is an important step in the<br />
production of Al alloy castings, a process described elsewhere in these notes).The addition of the<br />
phosphorous creates conditions for more nucleation of the proeutectic β during cooling of the<br />
casting. Strengthening of this material is accomplished by the same precipitation hardening process<br />
described for alloys 356.2 and 319.1. The details of this heat treatment include a solutionizing<br />
step of ~ 1 hour at 510 0 C, a hot water quench (70 0 C for 8 minutes), and a 5 hour aging<br />
treatment at 230 0 C.<br />
XIII. Additives To Molten <strong>Metal</strong><br />
Molten metal processing often involves a procedure where additives are introduced to the<br />
molten metal at some stage in the sequence of operations shown schematically below:<br />
A. Charging<br />
<br />
<br />
<br />
<br />
<br />
<br />
<br />
<br />
B. Tapping<br />
<br />
<br />
<br />
<br />
<br />
<br />
<br />
Furnace Ladle<br />
Points of addition in the sequence include during charging, tapping, mold pouring, and in the<br />
mold.The reasons for additions are many and varied, a number of these being listed below:<br />
A. Alloying additions for control of chemical composition - these can be made in the<br />
furnace charge (A above) or at some point after the metal is molten. Amounts from 0 to<br />
several % are typically added. The choice of at what stage the alloy is added depends primarily<br />
upon the ease with which the alloy melts or goes into solution.<br />
B. Additions for the purpose of providing nucleation sites for a phase or phases -<br />
these are usually made at some point after charging. Amounts are usually small, and may<br />
be as small as 0.02 % to be effective. A classic example of this type of addition is the inoculation<br />
process in gray and ductile cast irons. This process, where a ferrosilicon alloy is<br />
added for the purpose of nucleating graphite, varies from plant to plant and from casting to<br />
casting. Most plants inoculate at the tapping stage (B above) when the metal flows into the<br />
ladle, but may add “insurance” inoculant when the mold is poured (C above) or they may<br />
actually put a small amount of inoculant into the gating system (The so-called In-Mold<br />
Stage D above). In this process it has been shown that the later the addition point the more<br />
effective is the inoculant. It is also true that the later the addition the more expensive the<br />
process; it costs nothing extra to deliver a paper bag filled with inoculant at point B but<br />
may be quite expensive to deliver a controlled amount at points C and D. This class will<br />
experience the relative complexity of inoculation in the gating experiment on gray cast<br />
iron, in which we will attempt to deliver a controlled amount using Hickman - William’s<br />
commercial unit (The Post Inoculant Feeder PIF). The fact that lateness is important for<br />
effective inoculation implies that time in the metal is detrimental to the formation of<br />
nuclei. The inoculant is said to “fade” with time. Most processing requirements, for example,<br />
specify that the casting be poured no later than 10 minutes after inoculation if inoculation<br />
occurs at point B. If the time is exceeded then the molten metal is usually “pigged” to<br />
81<br />
C. Mold Pouring<br />
<br />
<br />
<br />
<br />
<br />
<br />
D. In-Mold<br />
Mold
avoid pouring castings of uncertain quality. The detailed effects of inoculant additions of<br />
processing in gray cast irons will be covered later on in these notes.<br />
C. Additions for the purpose of changing the shape of the phases that form during<br />
solidification - these can be made at all of the above points in processing, depending upon<br />
the material and the goal of processing. Amounts again are quite small, usually on the<br />
order of 0.01 to 0.05 wt.%. Good examples of this processing are I.,the addition of sodium<br />
(Na) or strontium (Sr) to aluminum - silicon alloys to force a change in shape of the eutectic<br />
silicon from plate-shape to rod-shape and II., the addition of magnesium (Mg) to a cast<br />
iron liquid to accomplish a shape change from plate-like to spheroidal. The addition of Na<br />
to aluminum-silicon alloys is termed “modification” and the addition of Mg to cast iron is<br />
termed “treatment”. Both of these additions result in significant enough microstructural<br />
change that mechanical properties are impacted greatly. This is especially true for cast iron<br />
where the ductility changes from essentially zero for the flake-shaped eutectic graphite<br />
(Gray Iron) to values in the range 0 to 20 % Elongation for the spheroidal shaped graphitic<br />
iron (Ductile Iron).The details of processing ductile cast iron will be discussed at a later<br />
place in these notes.<br />
D. Additions for the purpose of refining grain size during solidification or for limiting<br />
grain growth in the solid state after solidification is complete. These additions are<br />
usually made in the charge or on tapping the furnace into the ladle, and again the amounts<br />
added are often quite small, in the range of 0.01 to 0.04 %. An example cited here would<br />
be that of adding titanium to aluminum alloy semi-continuous castings, where the titanium<br />
is often wire-fed into the tundish feeding the large vertically descending ingots. The mechanism<br />
by which the refinement occurs is thought to be a result of the formation of titanium<br />
oxides which then hinder grain boundary movement during subsequent annealing operations.<br />
E. Additions for the purpose of removing gaseous impurities in a melt. These additions<br />
may be made either by purging a melt with a gas or by adding compounds which will<br />
react chemically with the impurity, forming an oxide or some solid compound which then<br />
goes into the slag and is removed. The most common example of the former is the degassing<br />
of aluminum alloys (removing hydrogen) by purging with argon containing SF 6 , as<br />
demonstrated in the laboratory and described earlier in these notes. Of course, since this<br />
operation requires a significant amount of time to carry to completion, it is necessarily<br />
completed in the melting or holding furnaces. An example of the latter is the degassing<br />
operation (removing oxygen) in copper alloys where a compound containing phosphorous<br />
(often CuP 3 ) is added and the phosphorous reacts with the oxygen andthe resulting<br />
compound goes into the slag. A similar deoxidizing step is used in the production of steel,<br />
where elements like silicon, aluminum, or magnesium are used to form oxides which then<br />
can be removed in the slag.<br />
All of these additives with the exception of A above result in microstructural change to a<br />
degree which is out of proportion to the amount of the additive used. It is useful to point out that<br />
the additives are invariably fairly active elements chemically, elements for example that oxidize<br />
readily in comparison to the other elements present. These are important “control rods” which the<br />
materials engineer had at his/her disposal to ensure that a quality product is produced consistently<br />
from one day to the next. Even though the quantity of the additive is very small, the presence of<br />
these active elements within the melt at the critical time of solidification is sufficient to affect and<br />
direct either the nucleation event and/or the growth events in the solidification process. For exam-<br />
82
ple it is thought that inoculation in cast iron results by the formation and growth of nuclei within<br />
the melt, nuclei which provide crystallographically convenient sites for nucleation of the graphite.<br />
In the case of modification of Al - Si alloys and treatment of cast irons, the presence of the active<br />
elements at the growing phase interfaces is likely responsible for altering the crystallographic<br />
manner in which growth occurs.<br />
XIV. Cast Iron<br />
Cast iron is a useful engineering material which has been known in some form for several<br />
thousand years. The cast irons that we use today are primarily alloys of iron, carbon and silicon in<br />
which the carbon is present in either graphitic form (pure C, hexagonal structure) or as an intermetallic<br />
iron carbide compound (the most common one being cementite or Fe 3 C, an orthorhombic<br />
crystal structure). Cast irons represent by far the largest tonnage of cast-to-shape products produced<br />
in the world. (Of course the largest tonnage of a cast material is steel which is subsequently<br />
mechanically formed into wrought products.) The ranges of compositions and the respective carbon<br />
forms and distinctive microstructural features for the common cast irons are given in Table 8:<br />
Type of Iron<br />
Table 8: Cast Iron Composition and Microstructures<br />
Range of C<br />
Weight %<br />
Range of Si<br />
Weight %<br />
It is generally accepted that the composition of these materials be described in terms of both the<br />
composition of carbon and silicon. Thus the term carbon equivalent, CE, has been adopted<br />
where:<br />
CE = %C + 1/3 %Si<br />
The above relationship between CE = 4.3, C,<br />
and Si represents the equation of the eutectic<br />
valley on the Fe - C - Si ternary phase diagram<br />
shown. Alloys whose CE is greater than 4.3<br />
are said to be hypereutectic and alloys whose<br />
CE is less than 4.3 are said to be hypereutectic.<br />
Most gray cast irons are hypoeutectic and<br />
most ductile cast irons are hypereutectic for<br />
reasons which are associated with the cast<br />
microstructure predicted by this diagram.In<br />
the hypoeutectic gray cast irons the proeutectic<br />
austenite dendrites are the first constituent<br />
to form. On the other hand graphite spheroids<br />
83<br />
Eutectic Product<br />
Graphite vs. Carbide<br />
Graphite<br />
Shape<br />
Gray Iron 2.5-4.0 1.0-3.0 Graphite Platelets<br />
Ductile Iron 3.0-4.0 1.8-2.8 Graphite Spheres<br />
Malleable Iron 2.0-2.6 1.1-1.6 Cementite, Fe 3 C Popcorn<br />
White Iron 1.8-3.6 0.5-1.9 Cementite, Fe 3 C<br />
Compacted Iron 3.0-4.0 1.8-2.8 Graphite Rods<br />
Surface of Ternary<br />
Fe - C - Si Phase<br />
Diagram 4.3 = %C + 1/3%Si<br />
Fe<br />
Wt Pct Silicon<br />
<br />
<br />
<br />
<br />
Hypo Hyper<br />
(Pro - Austenite)<br />
<br />
<br />
Wt Pct Carbon<br />
4.3<br />
Eutectic<br />
Valley<br />
(Graphite)
are the first constituent to form in ductile cast irons. White irons and malleable irons are always<br />
hypoeutectic. In malleable irons graphite spheroids (so - called popcorn shape) form from the<br />
eutectic cementite during a solid state heat treatment. This material has similar properties to ductile<br />
iron in its heat treated state.<br />
Phase Equilibria in Cast Iron Systems, Stable and Metastable Diagrams<br />
The microstructure of cast<br />
irons depends upon the composition,<br />
processing and thermal history of the<br />
material. The starting point for<br />
understanding the basics of cast iron<br />
metallurgy requires a working<br />
knowledge of the phase diagram or<br />
phase diagrams that apply to the specific<br />
cast iron. Most cast irons are relatively<br />
complex (like most<br />
commercial materials), with in<br />
excess of 3 components. However<br />
the elements carbon and silicon<br />
determine to a large degree the<br />
microstructure of the cast product<br />
immediately after solidification. The<br />
table on the previous page, however,<br />
shows that there is a wide range of<br />
acceptable carbon and silicon values<br />
spanning the types of irons and even<br />
within one type. Common alloy elements<br />
added in addition include manganese<br />
(Mn), copper (Cu), nickel<br />
(Ni), molybdenum (Mo), and chromium<br />
(Cr). These elements are added<br />
primarily as a means of controlling<br />
Temperature<br />
<br />
<br />
<br />
<br />
<br />
<br />
<br />
<br />
<br />
<br />
<br />
<br />
<br />
<br />
<br />
<br />
<br />
<br />
<br />
<br />
<br />
<br />
<br />
<br />
<br />
<br />
Carbon Equivalent, CE<br />
4.0 4.3<br />
α = ferrite (bcc) γ = austenite (fcc)<br />
Reactions:<br />
1. Eutectic Reaction. L -> γ + Gr<br />
2. Eutectoid Reaction γ -> α + Gr<br />
3. Peritectic Reaction L + α -> γ<br />
the matrix microstructure, having only a small effect upon the solidification microstructure. The<br />
material to follow is an attempt to utilize a basic understanding of phase diagrams to help sort out<br />
some of the possible alternatives during solidification. A schematic vertical section through the<br />
stable Fe - C - Si phase diagram (isopleth) is given above. This diagram represents a vertical section<br />
through the sketch on the previous page at a fixed amount of silicon, i.e. a section parallel to<br />
the Fe - C axis. It can be seen that the eutectic point is at a composition, CE = 4.3 and that hypoeutectic<br />
alloys obviously have proeutectic austenite forming and hypereutectic alloys have proeutectic<br />
graphite. Unlike the situation with binary alloys, reactions like eutectics and eutectoids can<br />
occur over a temperature range. This is indicated for the eutectoid reaction where a three phase α<br />
+ γ + Gr region exists. The three phase region γ + Gr + L also exists at the eutectic temperature but<br />
the temperature range is quite small and will not be shown here to avoid difficulties in interpreting<br />
the metastable diagrams to follow. Consider the solidification of an alloy with a CE = 4.0 as<br />
shown above. The first material to solidify are dendrites of proeutectic austenite, dendrites which<br />
grow into the liquid enriching it in carbon until the eutectic reaction temperature is reached. The<br />
equilibrium reaction, L -> γ + Gr, requires significant undercooling before nucleation takes place.<br />
84<br />
γ<br />
α+γ<br />
α<br />
3.<br />
γ + L<br />
α + Gr<br />
γ + Gr<br />
α + γ + Gr<br />
Liquid, L<br />
<br />
<br />
<br />
<br />
<br />
<br />
<br />
1.<br />
2.<br />
<br />
<br />
<br />
<br />
<br />
<br />
<br />
<br />
<br />
<br />
<br />
<br />
<br />
<br />
<br />
<br />
<br />
<br />
<br />
<br />
<br />
<br />
<br />
<br />
<br />
<br />
<br />
<br />
<br />
<br />
<br />
<br />
<br />
<br />
<br />
<br />
<br />
<br />
<br />
<br />
<br />
<br />
<br />
<br />
<br />
<br />
<br />
<br />
<br />
<br />
L + Gr
Assuming that this equilibrium reaction does indeed occur, then when solidification is complete<br />
the structure will consist of austenite dendrites surrounded by a eutectic product of austenite plus<br />
graphite. In reality, however, this eutectic reaction may not occur depending upon the cooling rate<br />
(section size), and processing history, the system instead preferring to solidify by another mechanism<br />
completely. This other possibility for solidification exists because of the presence of a metastable<br />
phase diagram as well as a stable phase diagram. The metastable phase diagram (dashed<br />
lines illustrated along with the stable phase diagram in the figure below) represents metastable<br />
equilibrium between the phases α, γ, L and cementite,Fe 3 C, instead of the stable graphite.<br />
Temperature<br />
<br />
<br />
<br />
<br />
<br />
<br />
<br />
<br />
<br />
<br />
<br />
<br />
<br />
<br />
<br />
<br />
<br />
<br />
<br />
<br />
<br />
<br />
<br />
<br />
<br />
(α + γ + Fe <br />
<br />
3C) <br />
<br />
<br />
<br />
<br />
<br />
<br />
<br />
<br />
<br />
<br />
γ<br />
α+γ<br />
α<br />
γ + L<br />
α + Gr<br />
(α + Fe3C) Liquid, L<br />
<br />
<br />
<br />
<br />
γ + Gr<br />
(γ + Fe3C) <br />
<br />
<br />
<br />
<br />
<br />
<br />
L + Gr<br />
<br />
<br />
<br />
<br />
<br />
<br />
<br />
<br />
<br />
<br />
<br />
<br />
<br />
<br />
<br />
<br />
<br />
<br />
<br />
<br />
<br />
<br />
<br />
<br />
<br />
<br />
<br />
<br />
4.0<br />
Carbon Equivalent, CE<br />
∆Τ<br />
<br />
<br />
<br />
<br />
<br />
<br />
<br />
<br />
<br />
<br />
<br />
<br />
4.3<br />
Given enough time for reactions the stable phase diagram will always be obeyed. However, reality<br />
will often intercede with the result that the system will obey the metastable phase diagram just<br />
to complete the transformations in the time dictated by the mold. It is important to notice that the<br />
metastable diagram is essentially shifted to lower temperatures than the stable diagram. The<br />
extent of the shift is proportional to the amount of silicon. For example in binary Fe - C alloys the<br />
temperature difference between stable and metastable eutectics, ∆T, is approximately 4 C o . In a<br />
ternary alloy with 2% silicon, ∆T is approximately 30 C o . Similar effects are recorded in the<br />
eutectoid reaction range. These ∆s are exaggerated in the above figure for illustration purposes.<br />
Gray Cast Iron<br />
The presence of the stable and metastable phase diagrams provides an opportunity for<br />
every heat of iron to choose between stable and metastable transformations during the solidification<br />
event, and even after solidification during the solid state reactions in the eutectoid range.<br />
Thus the microstructures observed can be extremely complex. Thermal analysis offers an excellent<br />
way to monitor the transformations during the solidification and cooling of cast iron . Ther-<br />
85<br />
α + γ + Gr<br />
L + Fe 3 C<br />
Fe 3 C<br />
<br />
<br />
<br />
<br />
<br />
<br />
<br />
<br />
<br />
<br />
<br />
<br />
T G<br />
T C<br />
Cooling Curve<br />
T L<br />
T L = γ Liquidus<br />
Solidification<br />
Complete<br />
T G = Graphite Eutectic<br />
T C = Carbide Eutectic<br />
Time
mal analysis is most often accomplished using a small chemically bonded sand containeer which<br />
has a thermocouple traversing the cavity of the cup. A sketch of such a device is shown below.<br />
Molten <strong>Metal</strong><br />
<br />
<br />
<br />
<br />
<br />
<br />
<br />
<br />
A schematic cooling curve for the 4.0 CE alloy is shown together with the above phase diagram<br />
which is typical of a material solidifying as gray cast iron. The first arrest at T L corresponds to the<br />
formation of austenite dendrites and the second the formation of the eutectic (γ + graphite) at T G .<br />
Note that there is significant undercooling below T G before recallescence (heating back up to T G<br />
due to the latent heat of the eutectic reaction) occurs. An actual cooling curve from a 2 inch diameter<br />
cylinder of gray cast iron is shown below.<br />
1300<br />
1200<br />
1100<br />
1000<br />
900<br />
800<br />
700<br />
600<br />
~2.5 in.<br />
86<br />
Sand Cup (Chemically Bonded)<br />
Quartz Protection Tube<br />
Thermocouple Wires<br />
Gray Cast Iron (2 Inch Diameter bar)<br />
Austenite Liquidus<br />
Gray Iron Eutectic<br />
To Data Analyzer<br />
0 500 1000 1500 2000 2500 3000 3500<br />
Time (Seconds)<br />
Austenite -> Pearlite
The actual cooling curve shows two thermal arrests at temperatures exceeding 1100 o C. The first<br />
one represents the formation of austenite dendrites from the liquid. The second arrest (with<br />
undercooling) represents the eutectic reaction, liquid -> austenite + graphite. The third arrest in<br />
the temperature range 720 - 730 o C represents the solid state reaction of austenite transforming to<br />
pearlite. This transformation will be discussed later in this set of notes. Undercooling of the eutectic<br />
liquid below the gray iron eutectic temperature, T G results because the energy requirements<br />
of nucleation of the graphite + austenite eutectic are large. It is understood that nucleation of the<br />
graphite phase is required first, followed by nucleation and growth of austenite with the graphite<br />
phase. Unfortunately if the graphite nucleation event does not occur before the temperature of the<br />
melt reaches the iron carbide eutectic,T C , then the melt will solidify as the so-called “white iron”<br />
eutectic, the metastable austenite + cementite product. Thus the solidification microstructure will<br />
be very sensitive to the cooling rate of the casting and thus to the section size. Small section sizes<br />
will have a greater tendency to solidify white than the larger section sizes. This tendency is illustrated<br />
with the “chill” wedge and associated cooling curves below:<br />
“ Chill Wedge”<br />
<br />
<br />
<br />
<br />
<br />
<br />
<br />
<br />
<br />
<br />
<br />
<br />
<br />
<br />
<br />
<br />
<br />
<br />
<br />
<br />
Fracture Plane<br />
“ Gray Iron” (Gray, Graphite, Fracture)<br />
Thermocouples<br />
at these locations<br />
*<br />
3<br />
*<br />
2<br />
*<br />
1<br />
If thermocouples were placed within the chill wedge at locations as shown, the cooling curves<br />
resulting could have the appearance given. Thermocouple #3 recorded a cooling rate so fast that<br />
the equilibrium graphite eutectic product did not have time enough to nucleate and grow. The<br />
result was that when the undercooling liquid reached the white iron eutectic, T C , the metastable<br />
eutectic reaction took place. In contrast to the large energy requirement of graphite nucleation, the<br />
energy requirement to form Fe 3 C is small and so little undercooling is required below T C to form<br />
the metastable product. In fact, cooling curves in white iron do not exhibit a noticeable undercooling<br />
whereas undercooling in gray iron always occurs (see curves 2 and 3 above). In positions 2<br />
and 3 in the wedge there is sufficient time (heavier sections cool more slowly) to nucleate the<br />
graphite eutectic product which is then followed by recalescence as the latent heat of the solidifying<br />
γ + graphite is released. The reality of the possibility of white iron forming in the fast cooling<br />
parts of gray iron castings is cause for much concern for the foundry producing the castings<br />
because of the negative effects of the iron carbide. Iron carbide is very hard and brittle, and does<br />
not machine readily. One of the advantages of gray cast iron is its excellent machinability due to<br />
the presence of the graphite, but if iron carbide is present it will rapidly cause cutting tools to dull<br />
87<br />
Temperature<br />
“ White Iron” (White, Carbide, Fracture)<br />
Nucleation of<br />
Austenite Dendrites<br />
<br />
<br />
<br />
<br />
<br />
<br />
TL Nucleation of<br />
Graphite<br />
3<br />
<br />
<br />
<br />
<br />
TG <br />
2<br />
1<br />
<br />
TC Nucleation of<br />
Iron Carbide<br />
Time
or to fracture. It is thus necessary to do everything possible to ensure that the white iron does not<br />
form at any point in the gray iron casting. The steps that can be taken to prevent the formation of<br />
iron carbide (or “chill”) within gray cast iron are listed below:<br />
1. Change the casting design to eliminate any sections which would cool rapidly enough to form<br />
eutectic iron carbide. This is not usually a practical solution because of the high cost of tooling<br />
(pattern making, mold making, gating design, etc.).<br />
2. Increase the ∆T between the stable and metastable eutectics. This would require significantly<br />
increasing the silicon content of the alloy, a practice which would not be practical because of the<br />
potentially negative effects on mechanical properties. An increase in silicon will result in a tendency<br />
to form ferrite in the final product rather than pearlite, which will decrease the strength and<br />
hardness of the gray iron.<br />
3. Make an addition to the melt to provide heterogeneoous nucleation sites for the graphite, so that<br />
the extent of the undercooling required to form graphite is not as great. This is the practice known<br />
as inoculation, which was described earlier in these notes. Inoculants usually contain silicon,<br />
which will obviously increase ∆T, but the amount is usually too small to have a significant effect<br />
in this way. Rather, the inoculant provides nuclei for graphite which has an effect all out of proportion<br />
to the amount added. The most direct result of this process can be seen in the effect of the<br />
inoculant on the chill wedge and on the response of the cooling curves as shown below.<br />
Chill Wedge Curve 1 Chill Wedge Curve 2<br />
TEMPERATURE<br />
Nucleation of<br />
Austenite Dendrites<br />
<br />
TL Nucleation of<br />
Graphite<br />
<br />
<br />
<br />
<br />
<br />
1<br />
<br />
<br />
TC Nucleation of<br />
Iron Carbide<br />
<br />
TG 1I<br />
<br />
<br />
<br />
<br />
<br />
<br />
<br />
CD<br />
*<br />
3<br />
* 2<br />
*<br />
1<br />
TEMPERATURE<br />
88<br />
T L<br />
Nucleation of<br />
Austenite Dendrites<br />
<br />
TUC Nucleation of<br />
Graphite<br />
<br />
<br />
<br />
T <br />
G<br />
<br />
<br />
2<br />
2I<br />
<br />
<br />
<br />
<br />
<br />
<br />
T<br />
<br />
C<br />
Curves 1I and 2I represent<br />
TIME the inoculated cooling curves<br />
TIME<br />
at points 1 and2.<br />
No Inoculation Inoculation<br />
White Gray<br />
at position 1 at position 1<br />
*<br />
3<br />
* 2<br />
1<br />
*<br />
CD
It can be seen from the schematic above that inoculation has reduced the chill depth in the wedge,<br />
CD, and reduced the magnitude of the undercooling, T UC, below the graphite eutectic T G . It is<br />
useful to consider in detail what has happened at both thermocouple positions 1 and 2 as a result<br />
of inoculation.<br />
Thermocouple Position 1.<br />
The cooling rate at position 1 in the uninoculated iron was rapid enough that there was not<br />
time enough for the nucleation of the graphite to take place. Thus the cooling continued with the<br />
result that the metastable eutectic white iron formed. However, in the inoculated iron enough<br />
nuclei for graphite were produced so that, even though the cooling rate did not change as a result<br />
of inoculation, the time available between T G and T C was sufficient for the gray iron eutectic to<br />
form and grow. This result is equivalent to insuring that thinner section sized castings could be<br />
made succesfully gray with effective inoculation.<br />
Thermocouple Position 2.<br />
The cooling rate at position 2 in the uninoculated iron was slow enough that there was<br />
enough time for the nucleation of graphite to take place. However the undercooling below the<br />
graphite eutectic, T UC , was quite large and there was a large recallescence observed. This implies<br />
that the number of nuclei producing eutectic cells (the two phase austenite + graphite eutectic)<br />
was quite small, a result which produces a graphite structure which is not always desirable. This<br />
point will be emphasized later in this discussion. However, inoculation was effective at reducing<br />
T UC very significantly as shown in the figure and the eutectic reaction occurred at a much higher<br />
temperature than in the case of no inoculation. This observed behavior occurred because the<br />
number of nuclei present in the melt was much higher due to the inoculation event, promoting<br />
growth of more eutectic cells sooner thus avoiding the severe undercooling observed in the situation<br />
with no inoculation. The higher eutectic reaction temperature promotes a more desirable graphitic<br />
structure, and therefore a higher quality iron.<br />
The consideration above illustrates the point that effective inoculation will do two very<br />
important things to the structure and therefore properties of gray cast iron; First the likelihood of<br />
“chill” occurring will be greatly diminished and Second, the graphitic structure that is produced<br />
will be much superior for most applications. Understanding this latter point requires<br />
understanding that the rate of the eutectic reaction is proportional to the degree of undercooling.<br />
Greater undercooling results in faster growth of the eutectic. Faster growth requires more rapid<br />
diffusion and therefore smaller and more numerous eutectic graphite particles. This type of structure<br />
is characteristic of the highly undercooled uninoculated iron. On the other hand the inoculated<br />
iron solidifies with very little undercooling, thus each eutectic cell grows relatively slowly<br />
resulting in rather large graphite flakes spaced much farther apart. However, both structures will<br />
solidify in the same period of time as dictated by the mold. The slow growing more numerous<br />
eutectic cells in the inoculated iron will complete the solidification in the same time as the rapidly<br />
growing sparsely populated eutectic cells in the uninoculated iron. This result can be better appre-<br />
89
ciated by understanding the schematic eutectic cells which follow.<br />
Large Graphite Flakes<br />
in Eutectic Cell<br />
Slow Growing<br />
Small Undercooling<br />
Relative amounts and sizes of eutectic cells in equivalent volumes of inoculated and uninoculated<br />
Liquid<br />
irons are shown at equivalent times into the solidification event. In addition, not shown in the<br />
above figure are the austenite dendrites which would have solidified before the eutectic cells and<br />
therefore the cells would have had to grow around the dendrites.<br />
Matrix Microstructures in Gray Cast Irons<br />
Matrix microstructures of gray cast iron depend in a complex way upon the graphite size<br />
and shape, the carbon equivalent, the section size, the processing history, and the alloy content. It<br />
can be seen from the stable and metastable phase diagrams on page 85 that a 4.0 CE iron will have<br />
a matrix microstructure of austenite over a temperature range from the eutectic temperature down<br />
until the temperature range where the austenite will begin to transform to either the stable ferrite +<br />
graphite or the metastable ferrite + cementite (pearlite). According to this phase diagram the cooling<br />
alloy first encounters the stable phase field in which ferrite can first appear. It is possible for<br />
the ferrite to nucleate on graphite, a convenient place to deposit the carbon from the austenite that<br />
cannot be absorbed by the bcc ferrite (which has only a solubility of about 0.01 % C). This type of<br />
90<br />
Small Graphite Flakes<br />
in Eutectic Cell<br />
Fast Growing<br />
Large Undercooling<br />
Liquid<br />
0.3 mm 1.0 mm<br />
Inoculated Iron after 1 minute Uninoculated Iron after 1 minute<br />
60 Percent solidified 60 Percent Solidified<br />
27 Nuclei -> 27 Eutectic Cells 3 Nuclei -> 3 Eutectic Cells<br />
Cell Radii = 0.15 mm -> Growth Rate Cell Radii = 0.5 mm -> Growth Rate<br />
of 0.15 mm / min<br />
Therefore fatter and fewer flakes<br />
Low graphite surface area per unit volume.<br />
of 0.5 mm / min<br />
Therefore smaller and more numerous flakes<br />
High graphite surface area per unit volume.<br />
Higher number of cells Smaller number of cells
phase change is shown schematically below:<br />
Austenite Grains<br />
Graphite Flake<br />
Cooling<br />
<br />
<br />
<br />
<br />
<br />
<br />
If the casting cools slowly enough the ferrite nuclei shown can continue to grow into the austenite,<br />
the excess carbon diffusing through the ferrite into the waiting arms of the graphite flake. Were<br />
this to occur to completion the final structure would be ferrite and graphite, the equilibrium<br />
microstructure predicted by the stable phase diagram. If on the other hand, the casting was cooling<br />
quite rapidly, or if there were significant amounts of alloy, the austenite may find it easier to<br />
transform the remainder of the austenite to pearlite (α + Fe3C).This scenario is shown schematically<br />
<br />
<br />
below:<br />
Austenite Grains<br />
Graphite Flake<br />
Cooling<br />
Factors which favor the formation of ferrite include:<br />
Fine graphite structures, undercooled graphite, high graphite surface to volume ratio,<br />
thereby providing a high density of nucleation sites for ferrite.<br />
High silicon content - raises the transformation temperature from γ -> α, making diffusion<br />
easier and therefore the growth of ferrite easier.<br />
Slower cooling rates - annealing is used to produce ferritic structures.<br />
Factors which favor the formation of pearlite would be the opposite of the above. In addition<br />
certain alloy elements other than silicon would kinetically favor pearlite by lowering the equilibrium<br />
phase boundaries and moving the nose of the CCT diagram for the formation of ferrite to<br />
longer times. The cooling curve shown on page 86 illustrates the thermal arrest where austenite<br />
transforms to pearlite. If a significant amount of ferrite had formed the cooling curve would have<br />
another arrest at about 800 o C. This is shown schematically on page 94.<br />
Mechanical Properties of Gray Cast Iron<br />
The mechanical properties of gray cast iron are a sensitive function of the graphite structure<br />
(flake size, flake length, cell size) and of the matrix microstructure. Properties most often<br />
specified include tensile strength and Brinell hardness. (The Brinell hardness test has been<br />
described in the laboratory. The load administered to the 10 mm ball for ferrous materials is<br />
91<br />
Austenite Grains<br />
Graphite Flake<br />
<br />
<br />
<br />
<br />
<br />
<br />
<br />
<br />
<br />
<br />
Ferrite<br />
<br />
<br />
<br />
<br />
<br />
<br />
<br />
<br />
<br />
<br />
Ferrite<br />
<br />
<br />
<br />
<br />
<br />
<br />
<br />
<br />
<br />
<br />
<br />
<br />
<br />
<br />
<br />
<br />
<br />
<br />
<br />
<br />
<br />
<br />
<br />
<br />
<br />
<br />
<br />
<br />
<br />
<br />
<br />
<br />
<br />
<br />
<br />
<br />
<br />
<br />
<br />
<br />
<br />
<br />
<br />
<br />
<br />
<br />
<br />
<br />
<br />
<br />
Pearlite
3000kg.)<br />
Gray cast irons have relatively low tensile strengths and almost nonexistent ductilities.<br />
This combination of tensile properties is due primarily to the nearly continuous nature of the<br />
graphite flakes. Since all of the graphite in a given cell is interconnected, the only break in this<br />
continuity comes at the eutectic cell boundary. Since graphite is a very soft and weak material,<br />
tensile stresses will easily cleave the graphite plates internally or will separate the graphite from<br />
the adjacent matrix. Once a crack nucleates in this inherently brittle material, it will propagate<br />
readily through the cell structure, cut across cell boundaries and result in failure. The association<br />
of the fracture surface with the graphite flakes is responsible for the name, gray iron. The appearance<br />
of a fracture is a gray color because of the exposed graphite on the interface. Similarly white<br />
iron is named because of the white appearing fracture, a fracture in which there is no graphite,<br />
only the white-appearing eutectic carbide. Tensile fracture stresses in gray cast irons range from<br />
15 to 70 ksi depending upon matrix microstructure, alloy content and carbon equivalent. The<br />
nature of these effects and their relative magnitudes are described in the material to follow.<br />
Effect of Carbon equivalent.<br />
The carbon equivalence of a cast iron is an important contributor to the strength of those<br />
irons primarily because of its direct effect upon the amount of the proeutectic austenite dendrites<br />
present. This relationship (with a sketch illustrating a dendrite and the eutectic cell) and “ballpark”<br />
estimates of tensile strength are given in the figure below. The tensile strength of a eutectic<br />
iron (4.3 CE) is typically around 20 ksi. As the amount of the proeutectic austenite increases with<br />
decreasing CE the tensile strength increases in the manner shown. It is surmised that the dendrites<br />
Fracture<br />
Path<br />
Tensile Stress<br />
Austenite<br />
Dendrite<br />
<br />
<br />
<br />
<br />
<br />
<br />
<br />
<br />
<br />
<br />
<br />
Eutectic Cell<br />
(Austenite +<br />
Graphite)<br />
Fracture<br />
Path<br />
Ultimate Tensile Strength (ksi)<br />
80<br />
60<br />
40<br />
20<br />
0<br />
<br />
<br />
<br />
act as strengthening entities in much the same manner as adding stiffeners in a composite; i.e. silicon<br />
carbide is added to aluminum to increase strength and stiffness (the elastic modulus). It can<br />
be seen from the above sketch also that the dendrite would effectively “break” or interrupt the<br />
easy fracture path along the graphite thereby increasing the fracture stress.<br />
Effect of Matrix Microstructure<br />
The matrix microstructure plays a major role in determining the strength of gray cast<br />
irons. Ferritic irons have relatively low strengths, where if the matrix is pearlite the strength<br />
92<br />
Increasing Proeutectic<br />
Austenite Dendrite <br />
Fraction<br />
<br />
<br />
<br />
<br />
Ausferrite Matrix<br />
<br />
<br />
<br />
<br />
<br />
Pearlite Matrix<br />
<br />
<br />
Ferrite Matrix<br />
3.8 3.9 4.0 4.1 4.2 4.3 4.4<br />
Carbon Equivalent
increases dramatically. This can be seen in the above figure, where the effect of the pearlite / ferrite<br />
ratio is illustrated. Clearly the strength of the pearlitic irons is greater because of the presence<br />
of the fine plates of iron carbide, which impede crack propagation and local yielding.<br />
In recent years it has been learned that the tensile strength of gray irons can be markedly<br />
increased by the austempering process, a heat treatment in which the iron is isothermally reacted<br />
at a temperature in the range 300 - 400 o C after austenitizing. This heat treatment produces a<br />
matrix of austenite with fine ferrite laths, the so-called ausferrite structure. Increased strengths<br />
above the pearlitic matrix results as shown above. This process will be discussed for ductile cast<br />
irons at a later point in this set of notes.<br />
Effect of Alloy Elements<br />
Alloy elements are added to gray cast irons for the purpose of increasing the strength of<br />
the irons. This is accomplished by the effect those alloy elements have on the matrix microstructure.<br />
Two important mechanisms contribute to strengthening in the as-cast grades of gray cast<br />
iron, pearlite refinement (pearlite spacing gets smaller as a result of the alloy depressing the pearlite<br />
reaction to lower temperatures) and solid solution strengthening of the ferrite. As an example,<br />
an addition of 0.5 % Mo to gray cast iron will increase the tensile strength by about 5 - 7 ksi for<br />
all carbon equivalent irons.<br />
Cooling Curves and Solid State Reactions During Cooling after <strong>Casting</strong><br />
The transformations to pearlite or ferrite during cooling after casting is observed with<br />
cooling curves in much the same way as is done during solidification. In the solid state a thermal<br />
arrest resulting from the latent heat given off during the transformation of austenite is shown<br />
below for a gray iron with a CE = 4.0. In this schematic the dashed cooling curve represents the<br />
thermal response to the nucleation and growth of the equilibrium ferrite phase on the graphite, and<br />
the solid cooling curve represents the result when the austenite transforms to the metastable carbide-containing<br />
pearlite microconstituent (see page 86 for an actual cooling curve). In those situations<br />
where both ferrite and pearlite appear in the casting, the cooling curve will lie somewhere<br />
93
etween the two curves shown.<br />
Temperature<br />
<br />
<br />
<br />
<br />
<br />
<br />
<br />
<br />
<br />
<br />
<br />
<br />
<br />
<br />
<br />
<br />
<br />
<br />
<br />
<br />
<br />
<br />
<br />
<br />
<br />
<br />
<br />
<br />
<br />
<br />
(α + γ + Fe3C) <br />
<br />
<br />
<br />
<br />
<br />
<br />
<br />
<br />
<br />
<br />
<br />
<br />
<br />
γ<br />
α+γ<br />
α<br />
α + Gr<br />
(α + Fe3C) Liquid, L<br />
<br />
γ <br />
+ L<br />
<br />
<br />
<br />
<br />
<br />
<br />
<br />
γ + Gr<br />
(γ + Fe3C) <br />
<br />
<br />
<br />
<br />
<br />
<br />
<br />
<br />
<br />
<br />
<br />
<br />
<br />
<br />
<br />
<br />
<br />
4.0<br />
Carbon Equivalent, CE<br />
<br />
<br />
<br />
<br />
<br />
<br />
<br />
∆Τ<br />
<br />
<br />
<br />
<br />
<br />
<br />
<br />
<br />
<br />
<br />
<br />
4.3<br />
Classes of Gray Cast Irons and Brinell Hardness<br />
Gray irons are often specified by their minimum tensile strength, i.e. a class 20 iron has a<br />
minimum tensile strength of 20 ksi, a class 30 iron has a minimum tensile strength of 30 ksi, etc.<br />
In most instances the chemical composition is not specified; rather it is the tensile strength and<br />
Brinell hardness which are written into specifications for certain applications. For example, automotive<br />
disc brake rotors and brake drums are produced from gray cast iron. In this instance a class<br />
30 gray iron is specified, together with a Brinell hardness range of from 179 - 229 kg / mm 2 . It is<br />
usually true that alloy elements are not specified, only as needed to meet the minimum tensile<br />
specifications and the Brinell range. More details on classes of gray irons and specifications can<br />
be found in the Iron <strong>Casting</strong>s Handbook (1981, Iron <strong>Casting</strong>s Society) or in Heine, Loper and<br />
Rosenthal’s text, Principles of <strong>Metal</strong> <strong>Casting</strong>.<br />
The Brinell hardness of gray cast irons depends almost entirely upon the microstructure of<br />
the matrix material. Typical matrix microstructures in as-cast gray irons include pearlite, ferrite,<br />
and combinations of pearlite and ferrite. Since pearlite is made up of ferrite (soft) and cementite<br />
(hard), the hardness will increase as the amount of pearlite increases. Most specifications of<br />
matrix microstructures in gray irons call for pearlite, and it is highly desirable for the pearlite to be<br />
produced in the as-cast condition. A schematic representation of the relationship between Brinell<br />
hardness and the volume percent of pearlite is given in the figure below for an ordinary class 30<br />
94<br />
T L<br />
T G<br />
T C<br />
Eutectic Austenite<br />
Plus Graphite<br />
(Eutectoid Pearlite)<br />
Cooling Curve<br />
Proeutectic Austenite Dendrites<br />
Metastable Equilibrium<br />
T L = γ Liquidus<br />
T G = Graphite Eutectic<br />
T C = Carbide Eutectic<br />
Equilibrium<br />
(Eutectoid Ferrite)<br />
<br />
<br />
<br />
Time
iron which had been heat treated to produce various combinations of pearlite and ferrite.<br />
Data gathered in the<br />
course of a laboratory<br />
experiment in MY 423<br />
using an iron with a<br />
CE = 4.0. The irons<br />
were austenitized and<br />
then cooled at different<br />
rates to produce the<br />
various ferrite - pearlite<br />
combinations. Original<br />
data in files.<br />
Brinell Hardness (kg/mm 2 )<br />
300<br />
250<br />
200<br />
150<br />
100<br />
50<br />
<br />
<br />
<br />
<br />
<br />
<br />
<br />
<br />
<br />
<br />
<br />
<br />
<br />
<br />
<br />
<br />
<br />
<br />
<br />
<br />
<br />
<br />
<br />
<br />
<br />
<br />
<br />
<br />
<br />
<br />
<br />
<br />
<br />
<br />
<br />
<br />
<br />
<br />
<br />
<br />
<br />
<br />
<br />
<br />
<br />
<br />
<br />
<br />
<br />
<br />
<br />
<br />
<br />
<br />
<br />
<br />
<br />
<br />
<br />
<br />
<br />
<br />
<br />
<br />
<br />
<br />
<br />
<br />
<br />
<br />
<br />
<br />
<br />
<br />
<br />
<br />
<br />
<br />
<br />
<br />
<br />
<br />
<br />
<br />
<br />
<br />
<br />
<br />
0 20 40 60 80 100<br />
Volume Percent Pearlite<br />
It should be pointed out that higher hardnesses can be obtained in irons which are austempered (in<br />
the range 250 - 350 BHN), a result which produces the higher tensile strengths shown schematically<br />
above.<br />
It is generally true that as the Brinell hardness increases, so does the tensile strength. In<br />
fact there is a fairly consistent relationship between UTS and BHN. This is illustrated in the data<br />
shown below for a range of gray cast irons produced at MTU. It should be noted in this data that<br />
the austempered irons are much harder and therefore much stronger than the as-cast variety.<br />
Ductile Cast Iron<br />
Ductile cast iron, or nodular cast iron, (also known as spheroidal graphite iron,SG iron in<br />
Europe) is a relative newcomer to the list of commercial cast irons. Discovered simultaneously in<br />
the United States (by Keith Millis at INCO Labs) and in the United Kingdom (by H.Morrogh of<br />
the British Cast Iron Research Association) in the late 1940s, it has grown in importance rapidly<br />
in the intervening years as the technology was perfected to produce the material consistently in<br />
the foundry. In the time period 1982 - 1995, while the tonnage of gray iron produced in the U.S.<br />
decreased from about 12 million tons to about 4 million tons,the tonnage of ductile iron has<br />
increased from about 1.5 M tons to about 3 M tons. The reason for its phenomenol growth is due<br />
to the microstructural fact that the graphite in ductile iron is spheroidal instead of flakelike,<br />
thereby making the matrix iron-rich constituent the continuous phase or phases. Thus cracks have<br />
no convenient weak path through which to propagate, and the material takes on the properties of<br />
the ductile matrix, thus giving the name.<br />
95
65<br />
60<br />
55<br />
50<br />
45<br />
40<br />
35<br />
30<br />
25<br />
Previous Work at MTU<br />
Gray Cast Iron<br />
150 200 250 300 350 400<br />
BHN (kg/mm 2 )<br />
Production of Ductile Iron<br />
Production of ductile iron almost universally utilizes a process by which the molten iron is<br />
“treated” with magnesium just prior to pouring the castings, followed by inoculation with a ferrosilicon<br />
alloy in much the same way as for the production of gray cast iron. In this process, the<br />
magnesium (whose boiling point is at a lower temperature than the melting point of cast iron) is<br />
usually added to the melt in the form of a master alloy containing about 5 % magnesium. This is<br />
done primarily to reduce the violence of the reaction that occurs when the molten iron contacts the<br />
magnesium. Because of the high vapor pressure of magnesium, its presence in the molten iron<br />
bath is very short lived, and since the graphite requires the presence of Mg to form as nodules the<br />
castings must be poured within a short time after treatment, usually less than 10 minutes. The process<br />
utilized for treatment in the MTU foundry is illustrated below: The pouring operation during<br />
treatment takes about 30 seconds to one minute to complete. During this time the Mg reaction<br />
involves the production of bubbles of magnesium vapor which proceed to rise up through the<br />
molten iron bath which is now covering the pockets in the chamber. Successful treatment results<br />
when a significant portion of the magnesium is dissolved into the molten iron, so that the correct<br />
conditions for graphite nodule formation are met in the solidifying melt. Typical “recoveries” of<br />
magnesium for the Tundish treatment facility shown are in the range 50 - 60 percent. Successful<br />
nodularization requires a composition of about 0.03 to 0.05 weight percent elemental magnesium<br />
in the iron. It is necessary that sulfur content be kept below 0.01% for successful treatment,<br />
because of the ability of the sulfur to react with the Mg (forming Mg 2 S) and remove elemental<br />
Mg from the melt. Often times the melt needs to be desulfurized before treatment can progress, a<br />
process which usually involves additions of Ca (calcium) to combine with the sulfur. The calcium<br />
sulfide will then rise to the slag layer and be skimmed.<br />
96<br />
As Cast<br />
Austempered
Treatment Chamber<br />
Pocket Containing<br />
MgFeSi<br />
<br />
<br />
<br />
<br />
<br />
<br />
<br />
<br />
<br />
<br />
<br />
<br />
<br />
Furnace<br />
Dam<br />
There are many methods that have been developed to add the magnesium to the melt.<br />
More recently many foundries are using processes in which pure magnesium is added instead of<br />
the master alloys containing silicon and iron. The advantage of this method lies in the reduced<br />
cost of the magnesium units as well as certain benefits resulting from the ability to have a much<br />
more flexible charge makeup. This advantage will become obvious when the mass balances are<br />
considered for production of ductile iron in our laboratory.<br />
Composition of Ductile Iron, Magnesium Fade and the Shape of Graphite<br />
The base composition of ductile cast irons usually is hypereutectic (see Table 8 on page<br />
82), where the carbon and silicon contents are typically 3.7 and 2.4 respectively (CE = 4.5). Thus<br />
the first constituent to appear during solidification are graphite nodules, which nucleate and grow,<br />
first without any austenite, but eventually with austenite enclosing the graphite nodule.<br />
It is critical in making ductile iron that the amount of magnesium present in the melt during<br />
solidification be in the range 0.03 to 0.05 weight percent. Magnesium contents less than this<br />
amount will result in graphite flakes, and amounts more than this results in the appearance of socalled<br />
exploded graphites. Either type contributes to a degradation in the ductility of the cast iron<br />
produced. Because of the high vapor pressure of Mg and the extreme reactivity with oxygen, the<br />
magnesium content in the melt will rapidly fade with time. Thus it is critical that the treated iron<br />
be poured into the molds as quickly as possible after treatment. This fading of magnesium and its<br />
97<br />
Tundish<br />
Molten iron at ~ 2800 o F is<br />
tapped into the tundish which<br />
is clamped to the top of the<br />
treatment chamber. The iron<br />
drops through a hole in the<br />
tundish filling an empty pocket<br />
in the front of the chamber.<br />
Eventually the iron spills over<br />
the dam and covers the Mgcontaining<br />
material in the rear<br />
pocket, at which point the<br />
Mg-reaction begins.
effect on the graphite is shown schematically below:<br />
Magnesium, Wt.%<br />
Time After Treatment, Minutes<br />
<br />
<br />
<br />
<br />
<br />
<br />
<br />
<br />
<br />
<br />
0 4 8 12 16 20 24 <br />
<br />
<br />
<br />
<br />
<br />
<br />
0.06<br />
<br />
<br />
<br />
<br />
<br />
<br />
<br />
<br />
<br />
<br />
<br />
<br />
<br />
<br />
<br />
<br />
<br />
<br />
<br />
<br />
<br />
<br />
0.05<br />
<br />
<br />
<br />
<br />
<br />
<br />
<br />
<br />
<br />
<br />
<br />
<br />
<br />
<br />
<br />
0.04<br />
<br />
<br />
<br />
<br />
<br />
<br />
<br />
<br />
<br />
<br />
<br />
<br />
<br />
<br />
<br />
<br />
<br />
<br />
<br />
<br />
<br />
<br />
<br />
<br />
<br />
<br />
<br />
<br />
<br />
<br />
<br />
<br />
<br />
<br />
<br />
<br />
0.03<br />
<br />
<br />
<br />
<br />
<br />
<br />
<br />
<br />
<br />
0.02<br />
<br />
<br />
<br />
<br />
<br />
<br />
<br />
<br />
Time Span For Spheres<br />
<br />
<br />
<br />
<br />
<br />
<br />
<br />
<br />
<br />
<br />
<br />
<br />
<br />
<br />
<br />
<br />
<br />
<br />
<br />
<br />
<br />
<br />
<br />
0.01<br />
0<br />
Exploded Spheroidal<br />
The processing scheme utilized in the production of ductile iron using a magnesium ferrosilicon<br />
alloy (MgFeSi) involves the following steps:<br />
1. Build a charge from scrap steel, returns (risers, gates, etc.)and pig iron.<br />
2. Melt charge and superheat to 2800 o F.<br />
3. Pour into treatment vessel, covering MgFeSi and reacting Mg.<br />
4. Transfer into pouring ladle, inoculating with ferrosilicon.<br />
5. Pour castings<br />
A common MgFeSi treatment alloy contains approximately 5 wt % Mg, about 45 wt % Si, with<br />
the balance Fe. About twice as much Mg needs to be added during treatment than is required in<br />
the casting (this represents a 50 % recovery) because of the losses from oxidation during the violent<br />
treatment reaction. This presents a problem because of the large amount of Si also present in<br />
the treatment alloy, a fact which requires that the Si content in the base charge be kept quite low,<br />
~1.4 wt%, or about 1 wt % lower than the Si content in the final casting. This necessarily means<br />
that the charge will have to contain a significant component with a low Si content, a requirement<br />
met by both pig iron (a virgin blast furnace product with high carbon,4.8 wt %, and low Si, 0.1<br />
wt.%) and scrap steel (typically containing 0.2 wt % Si and 0.2 wt % C). Of course a foundry<br />
would like to use all of their returns and minimize the cost of their other additions. In previous<br />
years this has meant maximizing the use of inexpensive scrap steel and minimizing the use of relatively<br />
expensive pig iron. However in recent months the supply of scrap steel has tightened due<br />
to the increasing requirements of the steel minimills, which use the same charge stock as gray and<br />
ductile iron foundries, thereby raising the price of scrap. The change in silicon content over the<br />
processing cycle is useful in defining the critical processing steps described above. This is shown<br />
98<br />
Flake
schematically below:<br />
3<br />
Weight Percent Silicon<br />
<br />
<br />
2<br />
Charge<br />
Inoculation (Add FeSi to Nucleate Graphite)<br />
<br />
1<br />
0 0<br />
Time<br />
The objective is to produce an iron within the chemical specifications and having the required<br />
amount of Mg to create nodules. A mass balance is used to determine the charge makeup as well<br />
as the amounts of treatment and inoculant . The chemical composition of charge materials is<br />
given in Table 9.<br />
Table 9: Chemical composition of Charge Components<br />
Material Wt % C Wt % Si Wt % Mg Wt % Fe<br />
Steel Scrap 0.2 0.2 0 99.6<br />
Ductile Returns 3.7 2.4 0* 93.9<br />
Pig Iron 4.2 0.2 0 95.6<br />
Magnesium Treatment 0 45 5 50<br />
Inoculant (Contains 1%Ca) 0 75 0 25<br />
Ferrosilicon for charge 0 50 0 50<br />
Graphite 100 0 0 0<br />
* Magnesium in returns is lost on melting<br />
Final <strong>Casting</strong><br />
Treatment (Add MgFeSi to Nodularize Graphite)<br />
Example Problem:<br />
We desire to produce a 200 pound heat of ductile iron in the MTU foundry with a composition<br />
of 3.6 C, 2.4 Si, and 0.04 Mg. We have the above charge and additive materials available.<br />
We know that the recovery of Mg during treatment in the tundish facility is about 50%. We also<br />
know that effective inoculation of ductile iron requires an addition of about 0.4% inoculant. This<br />
is more than is normally added to gray iron because the addition of Mg during treatment promotes<br />
the formation of eutectic carbide (Mg reduces the ∆T between graphite and carbide eutectics).<br />
Determine the proper charge makeup, the amount of treatment and the amount of<br />
99
inoculant needed to produce an iron with the correct composition.<br />
Table 10:<br />
Steps in procedure Logic and Calculations<br />
Step 1.Determine the amount of<br />
inoculant needed.<br />
Step 2. Determine the amount of<br />
treatment material needed.<br />
Step 3. Determine the amount of<br />
silicon needed in the charge before<br />
treatment or inoculation.<br />
Step 4. Determine the charge<br />
makeup using as much returns and<br />
scrap steel as possible. The advantage<br />
of using scrap steel over pig<br />
iron is the cost. Usually scrap steel<br />
is much less expensive than pig<br />
iron, which is a virgin material.<br />
a. 200 pounds x 0.004 = 0.8 pounds Inoculant<br />
a. Because of the loss of 50 % of the Mg added, it is necessary<br />
to add twice as much.<br />
b. 200 pounds x 0.0008 = 0.16 pounds Mg<br />
c. This is provided by 0.16 / 0.05 = 3.2 pounds MgFeSi<br />
a. A 200 pound heat with a final Si content of 2.4 wt %<br />
requires 200 x 0.024 = 4.8 pounds of Si.<br />
b. Steps 1 and 2 above give 0.8 x 0.75 (From inoculant) +<br />
3.2 x 0.5 (From treatment) = 0.6 + 1.6 = 2.2 pounds Si<br />
c. Thus the initial charge needs 4.8 - 2.2 = 2.6 pounds Si.<br />
d. Thus the Si composition of the charge is 2.60 / 196 x<br />
100 = 1.326 wt % Si<br />
a. Initially assume that the Si and C contents can be<br />
attained without using pig iron. Write three equations<br />
with three unknowns for the charge. Let X = weight of<br />
steel scrap , R = weight of returns, and G = weight of<br />
graphite (all in pounds) added to the initial charge.<br />
1. X + R + G = 196 (200 minus treatment and inoculant)<br />
2. X(0.002) + R(0.024) + G(0) = 2.652 (Si balance)<br />
3. X(0.002) + R(0.037) + G(1) = 7.4 (C balance)<br />
b. Solve equations 1, 2, and 3 simultaneously<br />
This gives :<br />
X = 89.56 pounds Scrap Steel<br />
R = 103.06 pounds Returns<br />
G = 3.38 pounds Graphite<br />
Homework Problem: Develop a plan to specify the ongoing charge makeup at a minimum<br />
cost for producing the above grade of ductile cast iron subject to the following constraints:<br />
1.Your foundry has the enviable experience of having an overall casting yield of 70%.<br />
Thus,on average, only 30% of the iron units charged can come from returns.<br />
2. Minimize the cost: The battle here is between fluctuating unit costs for scrap steel<br />
(X$), pig iron (P$), foundry grade ferrosilicon (FS$), and graphite (G$). Obviously<br />
the unit cost for the returns is zero. Current costs can sometimes be obtained from the<br />
<strong>Metal</strong> Market News at the MTU library, or from operating foundries.<br />
3. Carbon recovery by graphite additions is not 100%, but may be as low as 70%.<br />
4. Optional homework.Look on as Extra Credit Goodie<br />
5. Due: End of term by as many as three in a group. Four page limit, complete report.<br />
100
Microstructures of Hypereutectic Ductile Cast Irons<br />
The microstructures that evolve during casting of magnesium treated and properly inoculated<br />
irons with CE > 4.3 are made up of graphite nodules surrounded by austenite. The scenario<br />
of events is best described with reference to the phase diagrams (stable and metastable) and a<br />
cooling curve which are shown below:<br />
Temperature<br />
<br />
<br />
<br />
<br />
<br />
<br />
<br />
<br />
<br />
<br />
<br />
<br />
<br />
<br />
<br />
<br />
<br />
<br />
<br />
<br />
<br />
<br />
<br />
<br />
<br />
<br />
<br />
<br />
<br />
<br />
<br />
<br />
<br />
<br />
γ + L<br />
TG L<br />
Barely<br />
L + G<br />
Noticeable<br />
Graphite<br />
A<br />
Arrest<br />
Nucleation of<br />
Graphite Nuclei<br />
and Growth of<br />
Graphite<br />
Spheroids<br />
B<br />
Fe3C Eutectic<br />
Nucleation of Austenite<br />
on Graphite Spheres and<br />
Simultaneous Nucleation<br />
and Growth of Austenite Dendrites<br />
<br />
<br />
<br />
<br />
<br />
4.3 4.5<br />
Carbon Equivalent, CE<br />
The sequence of events which likely occurs during the solidification of ductile cast iron is<br />
described with reference to the above diagram:<br />
1. Nucleation of proeutectic spheres of Graphite<br />
2. Growth of spheres with liquid composition following arrow A.<br />
3. As the temperature drops below T G , nucleation of austenite occurs on<br />
the graphite and soon encloses the graphite in a shell of austenite. In<br />
addition conditions are good for the nucleation of austenite dendrites,<br />
whose subsequent rejection of carbon moves the liquidus composition<br />
along arrow B.<br />
4. Supersaturation of carbon in the liquid adjacent to the dendrites can<br />
provide conditions to allow more nucleation of new graphite nodules,<br />
which in turn can grow and be enveloped in austenite.<br />
5. Finally the solidification reaction is complete.<br />
The sequence of events is illustrated schematically below:<br />
1. 2. 3.<br />
Austenite Shell<br />
Austenite Dendrite<br />
101<br />
4.<br />
Time
Because of the surrounding of the graphite nodules with the austenite shell, this is not a typical<br />
eutectic reaction where both phases are simultaneously in contact with the liquid . Therefore this<br />
is sometimes called a neoeutectic, where growth of the graphite occurs by diffusion of carbon<br />
across the austenite shell into the graphite. The final as cast microstructure, of course, depends<br />
upon the combination of section size, alloy content, and processing history. Measurement made<br />
on the plane of polish to characterize these materials include:<br />
1. Nodule Count - No. of nodules per square cm<br />
2. Nodularity - sphericity of nodules, described by aspect ratio of nodules.<br />
3. Matrix microstructure - ferrite, pearlite, ausferrite, combinations<br />
4. Extent of segregation and defects - carbides, inclusions,shrinkage, etc.<br />
A typical as-cast microstructure consists of a bullseye structure of ferrite surrounding graphite<br />
which in turn is surrounded by pearlite. The development of this structure and relationship to a<br />
cooling curve is shown below:<br />
Graphite Liquidus<br />
<br />
<br />
TG <br />
Graphite nodules<br />
forming & growing<br />
Austenite Grains<br />
[Resulting from grain<br />
growth to mask evidence<br />
of original dendrites<br />
and austenite shells]<br />
<br />
<br />
<br />
<br />
<br />
<br />
Neo-eutectic ReactionGraphite<br />
forming graphite &austenite<br />
Ferrite Shell<br />
<br />
<br />
<br />
<br />
<br />
<br />
<br />
<br />
<br />
<br />
<br />
<br />
<br />
<br />
<br />
<br />
<br />
<br />
<br />
<br />
<br />
<br />
<br />
<br />
<br />
<br />
<br />
<br />
<br />
<br />
<br />
<br />
<br />
<br />
<br />
<br />
<br />
<br />
<br />
<br />
<br />
<br />
<br />
<br />
<br />
<br />
<br />
<br />
<br />
<br />
<br />
<br />
<br />
<br />
<br />
<br />
<br />
<br />
<br />
<br />
<br />
<br />
<br />
<br />
<br />
<br />
<br />
<br />
<br />
<br />
<br />
Ferrite begins to form<br />
on graphite (carbon “sinks”)<br />
Reaction progresses by<br />
diffusion of C through<br />
ferrite.<br />
Ferrite Formation<br />
Upper Critical Temp<br />
TF Pearlite<br />
Pearlite Reaction Temp<br />
TP “Colonies”<br />
<strong>Casting</strong> cooling rapidly<br />
enough that diffusion of<br />
carbon through the ferrite<br />
shell cannot keep pace with<br />
the wishes of the phase<br />
diagram and so pearlite has<br />
BULLSEYE<br />
STRUCTURE<br />
an opportunity to nucleate and<br />
grow into the remaining austenite.<br />
The “bullseye” structure is formed.<br />
102
The relative amount of ferrite present depends upon alloy content, nodule count, and the rate at<br />
which the casting is cooled through the transformation where ferrite and pearlite can form and<br />
grow, i.e. the same factors as those promoting ferrite in gray cast iron.<br />
Alloying of Cast Irons<br />
The primary purpose of alloying cast irons is to control the matrix microstructure, which<br />
usually means to control the identity of the austenite transformation product. Addition of alloying<br />
elements to cast irons (the Fe - C - Si system) has a measurable effect upon both the thermodynamics<br />
of the system (i.e. the position of stable and metastable phase boundaries) and upon the<br />
kinetics of a transformation (which usually has something to do with the rate at which carbon can<br />
move in the system). Austenite transformation products include;<br />
Austenite (γ, fcc) -><br />
Continuous<br />
Cooling<br />
or<br />
Isothermal<br />
The particular austenite transformation product or products observed will depend upon the section<br />
size of the casting, the size of the graphite flakes (surface area per unit volume), and the manner in<br />
which the casting was cooled (i.e. continuously cooled or isothermally reacted) in addition to the<br />
amount and type of alloying elements that are present. The microstructural results of continuous<br />
cooling are best described by the continuous cooling diagram (CCT) for a given cast iron, a schematic<br />
of which is illustrated in the attached figure below.<br />
Stable Austenite + Graphite<br />
Unstable<br />
Austenite<br />
Martensite Start<br />
Martensite<br />
Martensite Finish<br />
M<br />
Log Time (t)<br />
Cooling curves passing through the specific transformation product regions (TPR) in temperature<br />
103<br />
Ferrite( α, bcc) + Graphite<br />
Ferrite + Graphite + Pearlite( α + Fe 3 C)<br />
Pearlite<br />
Pearlite + Ausferrite( γ + α )<br />
Ausferrite<br />
Ausferrite + Martensite( α’)<br />
Martensite<br />
Pearlite<br />
Ausferrite<br />
Upper Critical Temperature<br />
A + M<br />
Ferrite + Graphite<br />
F + P + A<br />
F + P<br />
Schematic CCT diagram for a cast iron illustrating<br />
the presence of TPR of Ferrite, Pearlite, Ausferrite, and Martensite in T - t space
- time (T - t) space in the above figure illustrate a variety of microstructures depending upon the<br />
cooling rate. The slowest cooling specimen (largest section size) passed through the TPR of Ferrite<br />
+ Pearlite (F + P). As the cooling rate increases the transformation products change as shown<br />
until the product for the highest cooling rate is 100% martensite (M).<br />
The shape of the various TPR and their position in the CCT diagram illustrated above will<br />
depend most strongly upon the chemical composition of the austenite which is transforming. Of<br />
course, the matrix austenite carbon content is an important variable which will in turn depend<br />
upon the identity and amount of the other alloying elements present.<br />
The position in temperature - time space of the TPR within CCT diagrams for the transformation<br />
of austenite in steel is determined primarily by the composition and the austenite grain<br />
size. Thus the so-called hardenability of steels is primarily dependent upon the alloy content, the<br />
carbon content and the austenite grain size.<br />
This dependence of the TPR in T - t space on carbon content, alloy content and austenite<br />
grain size is also true for gray and ductile cast irons. However a complicating factor for cast irons<br />
results from the presence of graphite and the variability of matrix carbon content with temperature<br />
in equilibrium with that graphite. Thus very fine D and E type graphites in gray cast irons (and the<br />
high nodule count irons characteristic of well inoculated ductile irons), with their much higher<br />
surface area per unit volume on which nucleation of ferrite can occur, would be expected to have<br />
more ferrite present than an iron in which the graphite were present as the larger, more random Atype<br />
flakes; i.e. the ferrite + graphite TPR in the above figure would be shifted to shorter times.<br />
The nucleation and growth of ferrite is the only transformation product shown in which requires<br />
the presence of graphite, the growing ferrite resulting from relatively long range diffusion of carbon<br />
to graphite flakes. The other diffusional products (P, A) have the same composition as the<br />
matrix austenite and therefore require only short range carbon diffusion (interlamellar spacings in<br />
pearlite and the small space between the acicular plates of ferrite in ausferrite)to grow, depending<br />
for nucleation upon the presence of surfaces (austenite grain boundaries, graphite surfaces, ferrite<br />
boundaries, etc.). Martensite formation requires no diffusion, only requiring surfaces upon which<br />
to nucleate.<br />
In addition to their effect upon hardenability (position of the TPR in T-t space) substitutional<br />
alloy additions (Cu, Ni, Mo, Mn, Cr, etc) will have an important effect upon the final<br />
mechanical properties as a result of where they finally reside within the cast microstructure. An<br />
overview of the details of the effects of alloying elements in gray cast iron can be found in the literature<br />
(1 Angus, 2 Iron <strong>Casting</strong>s Handbook, 3 ASM “Cast Irons”).<br />
Mechanical Properties of Ductile Cast Iron<br />
The mechanical properties of ductile cast iron are significantly different than that of gray<br />
iron because of the difference in shape between the graphites in these cast irons. In ductile irons<br />
the matrix is the continuous entity so that there are no easy crack paths to propagate fracture. As a<br />
result, ductile cast irons have significant ductility and toughness, properties which place this<br />
unique material in competition with other ferrous materials such as cast steels, forged steels, and<br />
even wrought steels.<br />
Tensile Properties<br />
As a result of the continuity of the matrix, the tensile properties of ductile cast iron depend<br />
almost completely upon the microstructure of the matrix, a microstructure which can be con-<br />
104
trolled by heat treatment. An overview of the tensile properties of ductile iron is given below:<br />
<br />
<br />
<br />
<br />
<br />
<br />
<br />
<br />
<br />
Ultimate Tensile Strength (ksi)<br />
200<br />
180<br />
160<br />
140<br />
120<br />
100<br />
80<br />
60<br />
<br />
<br />
<br />
<br />
<br />
<br />
<br />
<br />
<br />
<br />
<br />
<br />
<br />
<br />
<br />
<br />
<br />
<br />
<br />
<br />
<br />
<br />
<br />
<br />
<br />
<br />
<br />
<br />
<br />
<br />
<br />
<br />
<br />
<br />
<br />
<br />
<br />
<br />
<br />
<br />
<br />
<br />
<br />
<br />
<br />
<br />
<br />
<br />
<br />
<br />
<br />
<br />
<br />
<br />
<br />
<br />
<br />
<br />
<br />
<br />
<br />
<br />
<br />
<br />
<br />
<br />
<br />
<br />
<br />
<br />
<br />
<br />
<br />
<br />
<br />
<br />
<br />
<br />
<br />
<br />
<br />
<br />
<br />
<br />
<br />
<br />
<br />
<br />
<br />
<br />
<br />
<br />
<br />
<br />
<br />
<br />
<br />
<br />
<br />
<br />
<br />
<br />
<br />
<br />
<br />
<br />
<br />
<br />
<br />
<br />
<br />
<br />
<br />
<br />
<br />
<br />
<br />
<br />
<br />
<br />
<br />
<br />
<br />
<br />
<br />
<br />
<br />
<br />
<br />
<br />
<br />
<br />
<br />
<br />
<br />
<br />
<br />
<br />
<br />
<br />
<br />
<br />
<br />
<br />
<br />
<br />
<br />
<br />
<br />
<br />
<br />
<br />
<br />
<br />
<br />
<br />
<br />
<br />
<br />
<br />
<br />
<br />
<br />
<br />
<br />
<br />
<br />
<br />
<br />
<br />
<br />
<br />
<br />
<br />
<br />
<br />
<br />
<br />
4<br />
TM = Tempered<br />
ADI<br />
Martensite<br />
P = Pearlite<br />
3<br />
F = Ferrite<br />
ASTM<br />
ADI = Austermpered<br />
Grades of ADI<br />
Ductile Iron<br />
(Guaranteed<br />
xx-yy-zz(Grade)_<br />
Minimums)<br />
2<br />
UTS YS %EL<br />
TM<br />
(Guaranteed Minimums)<br />
1<br />
120-90-2<br />
P<br />
100-70-3<br />
<br />
<br />
<br />
<br />
<br />
<br />
<br />
<br />
<br />
<br />
<br />
<br />
<br />
<br />
<br />
<br />
<br />
<br />
<br />
<br />
<br />
<br />
P+F<br />
<br />
<br />
<br />
<br />
<br />
<br />
<br />
<br />
<br />
<br />
<br />
<br />
<br />
<br />
<br />
<br />
<br />
<br />
<br />
<br />
<br />
<br />
<br />
<br />
<br />
<br />
<br />
<br />
<br />
<br />
<br />
<br />
<br />
<br />
<br />
<br />
<br />
<br />
<br />
<br />
<br />
<br />
<br />
<br />
<br />
<br />
<br />
<br />
<br />
<br />
<br />
<br />
80-55-6<br />
F+P<br />
F<br />
65-45-12<br />
60-40-18<br />
<br />
<br />
<br />
<br />
<br />
<br />
<br />
<br />
<br />
<br />
<br />
40<br />
0 2 4 6 8 10 12<br />
Percent Elongation<br />
14 16 18 20<br />
UTS v. % Elongation -Summary of Common As-Cast and Austempered Grades of Ductile Iron<br />
As-Cast and Quenched and Tempered Grades of Ductile Iron<br />
The Ultimate Tensile Strength vs. % Elongation diagram above illustrates the large range<br />
of properties available in the as - cast and quenched and tempered conditions. These grades are<br />
represented with solid circles and the series of numbers representing the UTS-YS-%EL for each<br />
grade. It can be seen that grade 60-40-18, with the most ductility (highest %EL), corresponds to<br />
an iron with a 100% ferritic (indicated with an F) matrix. As the amount of pearlite (indicated<br />
with a P) increases, the strength increases with a corresponding decrease in %EL, until grade 100-<br />
70-3 is reached which is 100% pearlite. Grades in between ferritic and pearlitic have pearlite and<br />
ferrite present in different proportions. The four as-cast grades shown are utilized in specifications<br />
as minimums for design purposes. The actual grade achieved will depend upon alloy content and<br />
105
section size. The grade 120-90-2 is a heat treated grade in which the iron has been austenitized,<br />
Table 11: Typical Chemical Compositions(Wt Percent), Matrix Micro, BHN<br />
Element<br />
Grade<br />
60-40-18<br />
Grade<br />
65-45-12<br />
Grade<br />
80-55-6<br />
quenched to martensite and tempered. Typical chemical compositions for these irons are given in<br />
Table 11. There are no chemical specifications for a specific grade. Each foundry and casting<br />
application will determine the combination needed to obtain the minimum mechanical property<br />
specifications. It will be noted in the above table that the ferritic grades contain a minimum of the<br />
alloy elements Cu and Mn, both of which promote the formation of pearllite when the casting is<br />
cooling. On the other hand the grades with pearlite commonly have a specification with a minimum<br />
of copper. The elements Mn and Cr come from the steel component of the charge; these are<br />
both common and important elements in the production of steel. Many ferritic matrix castings are<br />
obtained by annealing, a heat treatment where the casting is austenitized and then slowly cooled,<br />
giving a large amount of time for the formation of ferrite. This heat treatment, of course, adds significantly<br />
to the cost of production and is not usually desired. Low residuals of Mn and Cr can be<br />
achieved by melting larger quantities of pig iron, a charge material which is usually more expensive<br />
than scrap steel.<br />
Austempered Ductile Cast Iron<br />
All of the as-cast grades of ductile iron as well as the quenched and tempered grade have<br />
the same body centered cubic (bcc) matrix. The differences in hardness and tensile properties<br />
shown on the figure on page 105 are due to the differences in the distribution, shape and size of<br />
the iron carbide particles within that matrix. Of course the softest matrix (ferrite)has no carbides,<br />
while the lamellar carbides produced in pearlite contribute to an ever increasing hardness. The<br />
hardest matrix is achieved by the tempered martensite where the carbides are very tiny indeed.<br />
The shaded region which includes the as-cast grades represents the range of tensile properties<br />
attainable with ductile iron with a body centered cubic (ferrite) matrix.<br />
In recent years the grade of ductile iron known as austempered ductile iron (ADI) has<br />
been developed, a grade of iron in which heat treatment is utilized to produce a metastable face<br />
centered cubic matrix, austenite, which is stable at room temperature. It can be seen from the figure<br />
on page 105 that the ASTM grades of ADI are shifted to considerably higher strengths than<br />
106<br />
Grade<br />
100-70-3<br />
Grade<br />
120-90-2<br />
Carbon 3.5 - 3.9 3.5 - 3.9 3.5 - 3.9 3.5 - 3.8 3.5 - 3.8<br />
Silicon 2.2 - 3.0 2.5 - 2.8 2.2 - 2.7 2.2 - 2.7 2.2 - 2.7<br />
Manganese 0.30 max 0.40 max 0.2 - 0.5 0.6 max 0.6 max<br />
Chromium 0.06 max 0.10 max 0.10 max 0.10 max 0.10 max<br />
Copper - - 0.2 - 0.4 0.2 - 0.5 0.2 - 0.5<br />
Microstructure<br />
Brinell<br />
Hardness<br />
Ferrite Mostly<br />
Ferrite<br />
Mostly<br />
Pearlite<br />
Pearlite Tempered<br />
Martensite<br />
130 - 170 150 - 220 170 - 250 241 - 300 270 - 550
the as-cast grades, yet retaining excellent ductility. The primary cause of this dramatic improvement<br />
in mechanical properties stems from the presence of the face centered cubic matrix together<br />
with a fine scale dispersion of ferrite. The ASTM grades represent guaranteed minimums in tensile<br />
strength and ductility; the cross hatched region located to higher strengths and ductilities from<br />
the ASTM grades represents more typical ADI. Clearly ADI offers an entire new opportunity for<br />
applications of ductile cast iron. Indeed ADI, with comparable strengths and ductilities, is making<br />
inroads into markets once dominated by steel forgings and steel castings.<br />
The Metastable Phase Diagram and Stabilized Austenite<br />
The concept of austempered ductile iron with an austenitic matrix can be understood with<br />
reference to a portion of the metastable Fe - C - 2.4 Si phase diagram schematic shown below:<br />
Temperature (K o )<br />
0<br />
<br />
<br />
<br />
α +γ<br />
α<br />
<br />
<br />
<br />
<br />
<br />
<br />
<br />
<br />
<br />
<br />
Τ Metastable γ / α + γ Phase Boundary<br />
Α<br />
<br />
<br />
<br />
<br />
<br />
<br />
<br />
<br />
<br />
<br />
<br />
<br />
<br />
<br />
<br />
<br />
<br />
<br />
<br />
<br />
<br />
<br />
<br />
<br />
<br />
<br />
<br />
<br />
<br />
<br />
Room Temperature<br />
<br />
<br />
<br />
<br />
<br />
<br />
<br />
<br />
<br />
<br />
γ<br />
<br />
<br />
<br />
<br />
Τγ <br />
<br />
<br />
<br />
<br />
<br />
<br />
<br />
<br />
<br />
<br />
<br />
Martensite Start, M S<br />
α + γ<br />
<br />
<br />
<br />
<br />
<br />
0.8<br />
<br />
<br />
<br />
<br />
<br />
<br />
<br />
2<br />
Wt. Percent Carbon<br />
This diagram shows the low temperature portion of the Fe - C - 2.4 Si isopleth. The amount of 2.4<br />
Si was chosen to correspond to a typical ductile cast iron. Note that the metastable Fe - Fe 3 C diagram<br />
is not a part of this diagram but that other features are present, including the martensite start<br />
temperature (that temperature below which austenite must be quenched to obtain the hard, brittle,<br />
body centered tetragonal martensite phase), and the metastable extension of the<br />
α + γ / γ phase boundary. These features are necessary to understand the presence of austenite at<br />
room temperature which is stable. Consider now the heat treatment which is used to produce<br />
austempered ductile iron.<br />
1. <strong>Casting</strong> is heated into the austenite + graphite field and held at T γ until fully austenitized.<br />
At this point the structure consists of austenite of 0.8 wt. % C and graphite nodules.<br />
2. Cool rapidly to T A , the austempering temperature and hold, allowing the reaction:<br />
γ (0.8 C) -> α (0 C) + γ (2.0 C) [AUSFERRITE]<br />
107<br />
γ + Graphite<br />
<br />
<br />
<br />
α + Graphite<br />
<br />
<br />
<br />
<br />
<br />
<br />
<br />
<br />
<br />
<br />
<br />
<br />
<br />
<br />
<br />
<br />
<br />
3.6
This reaction usually requires about 1 - 2 hours to complete and gives a structure shown<br />
schematically below.<br />
Before Reaction<br />
Austempering<br />
<br />
<br />
<br />
<br />
<br />
<br />
<br />
<br />
1 - 2 Hours at TA In a piece of steel heat treated the same way, the austenite would transform to bainite, a<br />
two phase mixture of ferrite and iron carbide (Fe 3 C). However, in cast irons, the presence<br />
of silicon prevents the formation of carbides initially. The system takes the path of least<br />
resistance and obeys (once again) the metastable phase diagram.<br />
3. If given enough time the austenite will eventually transform to bainite. However, before<br />
that happens the casting will be cooled to room temperature, a move which will retain the structure<br />
created at T A . The austempering reaction is said to have “stabilized” the austenite. By virtue<br />
of the high carbon present in the ausferrite (reflecting the absence of carbon from the ferrite), the<br />
martensite start temperature has been reduced to near absolute zero degrees Kelvin (see the diagram<br />
on page 104). The martensite start temperature is a very strong function of carbon content.<br />
Since the carbon must be retained in the martensite in this diffusionless transformation and it<br />
tends to want to expand the lattice, more driving force (undercooling) becomes necessary as carbon<br />
content increases. Therefore as the austenite becomes richer in carbon during the ausferrite<br />
reaction it becomes stabilized to the notion of transforming to martensite. This allows cast irons to<br />
be austenitic at room temperature, an accomplishment made in commercial grades of steel only by<br />
adding large quantities of nickel or manganese. Of course, this is what makes ADI a unique material<br />
and what gives it the remarkable properties shown in the diagram on page 105.<br />
There are a number of problems associated with the production of ADI, problems which<br />
are concerned first with the production of a quality grade of ductile cast iron, and secondly with<br />
the control of the heat treatment parameters necessary to convert austenite to ausferrite. It goes<br />
without saying that the heat treated product cannot overcome basic deficiencies in the cast state.<br />
A list of these “deficiencies” includes porosity (shrinkage and gas), slag, sand, inclusions from<br />
impurities, low nodularity, low nodule count, etc. All of these extrinsic deficiencies can be minimized<br />
by good foundry practice and adhering to tight processing schedules, i.e. control of all<br />
temperatures in the sequence, establishing a rigorous schedule for treatment, inoculation, and<br />
pouring the castings. Some “deficiencies” that cannot be overcome are intrinsic to the process of<br />
solidification, including microsegregation in the casting and limitations in the nodule count that is<br />
attainable, a limitation defined primarily by the cooling rate (section size) of the casting. It is true<br />
that inoculation can increase nodule count, but not usually beyond a maximum for the given section<br />
size and mold type. Microsegregation is in principle capable of being eliminated by a homogenization<br />
step, where the casting is brought to a temperature close to its melting point and soaked<br />
at the high temperature until solid state diffusion has eliminated the problem. Unfortunately<br />
homogenization processes are very expensive and while it is cost effective for some materials it is<br />
108<br />
After Reaction<br />
Graphite Nodules + γ (0.8 C) grains Graphite Nodules + α (0 C) + γ (2 C)
just not a practical thing to do with cast irons . It is then necessary to live with the intrinsic deficiencies<br />
and adjust the heat treating parameters to accomodate any problems that may arise as a<br />
result.<br />
Austempering Ductile Iron and the Isothermal Transformation Diagram<br />
A grasp of the important parameters defining the process in heat treating these materials<br />
requires a basic understanding of the isothermal transformation diagram that describes what is<br />
necessary to produce ADI successfully, and also what is necessary to avoid so that the desired<br />
structure is attained. A schematic ITT diagram is given below for a ductile cast iron which is<br />
Temperature<br />
T γ<br />
T A<br />
<br />
<br />
<br />
Austenitize (1) Cool to TA (2)<br />
<br />
<br />
<br />
<br />
Upper Critical Temperature<br />
<br />
<br />
Pearlite<br />
<br />
<br />
Nose<br />
<br />
<br />
<br />
<br />
<br />
<br />
<br />
<br />
<br />
<br />
being austenitized at T γ and austempered at T A . There are four steps in the heat treatment scheme<br />
which are numbered on the ITT diagram.These four steps and the considerations associated with<br />
each are given below:<br />
Step (1) - Austenitize for a time so that the matrix is completely austenite with a fairly<br />
homogeneous carbon composition. A rule of thumb for time is one hour per inch of section, with<br />
allowance for heat up time as well. The temperature selected will depend upon the alloy compositon;<br />
it is necessary that the so-called upper critical temperature be exceeded, that temperature<br />
below which ferrite is a stable phase.<br />
Step (2) - Cool to the austempering temperature at a rate sufficient to “miss the Pearlite<br />
Nose” on the ITT diagram. This is most often accomplished in salt baths so that the rate of heat<br />
transfer is maximized. In heavier section castings it is necessary to alloy them quite heavily (usually<br />
with various combinations of Cu, Ni, and Mo); this has the effect of moving the entire ITT<br />
109<br />
<br />
<br />
<br />
<br />
<br />
<br />
<br />
<br />
<br />
<br />
<br />
<br />
<br />
<br />
<br />
<br />
<br />
<br />
<br />
<br />
<br />
<br />
<br />
<br />
<br />
<br />
<br />
<br />
<br />
<br />
Time<br />
Isothermal Transformation Diagram for a Hypothetical Ductile Iron<br />
<br />
<br />
<br />
<br />
<br />
<br />
1% <br />
Hold at TA Austemper (3)<br />
Ausferrite<br />
(α + γ)<br />
<br />
<br />
<br />
<br />
<br />
<br />
<br />
Cool to Room Temperature (4)<br />
<br />
<br />
Pearlite (α + Fe 3C)<br />
99%<br />
Bainite<br />
(α + Fe3C)
diagram to greater times thereby allowing the cooling from T γ to T A without generating pearlite<br />
within the casting.<br />
Step (3) - Hold at the Austempering Temperature for a time until the ausferrite reaction<br />
[γ (0.8 C) -> α (0 C) + γ (2 C)] is complete, but not so long a time that the bainite reaction<br />
[ γ (2 C) -> α (0 C) + Fe 3 C] occurs. The time is selected using a combination of information<br />
including primarily alloy content and austenitizing temperature. Obviously it would be helpful to<br />
have ITT diagram information for each alloy produced.The diagram defines the beginning of the<br />
ausferrite reaction with a note indicating that the reaction has progressed 1 %, and similarly the<br />
end of the reaction with a note at 99% transformed.<br />
Step (4) - Cool to room temperature for shipment to the customer. It is not necessary to<br />
cool rapidly; rather the castings are allowed to cool uniformly so as to minimize any residual<br />
stresses which could arise were castings to cool nonuniformly.<br />
It is important that the above steps be carried out in a consistent manner time after time, so<br />
that quality ADI is produced time after time.<br />
Control of Mechanical Properties of ADI<br />
The four ASTM grades of ADI illustrated on page 102 can in principle be created from the<br />
same cast alloy. The major factor controlling these tensile properties in ADI which has been produced<br />
from quality ductile iron and heat treated in a quality manner is the choice of the austempering<br />
temperature. This parameter is primarily responsible for defining the scale of the ausferrite<br />
product, where the term scale refers to the size and number of the ferrite particles in the austenite<br />
matrix. It is generally true that high austempering temperatures give course microstructures with<br />
relatively low strengths but higher ductility. On the other hand low austempering temperatures<br />
give very fine microstructures with high strengths but lower ductility. High austempering temperatures<br />
are in the range 400 - 425 o C giving ASTM grade 1 ADI,while low austempering temperatures<br />
are in the range 275 - 300 o C giving ASTM grade 4 ADI.<br />
Examples of potential applications for ADI include gears, automotive crankshafts, digger<br />
teeth for front end loader applications, automotive camshafts, railroad car wheels, etc. Many<br />
applications require resistance to sliding wear, a property enhanced by the presence of the austenite<br />
which transforms to martensite in service.<br />
Compacted Graphite Irons, Production and Properties<br />
Compacted graphite irons (CG) are the newest form of cast iron, recognized since 1965<br />
(R. D. Schelleng, Cast Iron (with vermicular graphite) US Patent 3,421,886, May 1965) as having<br />
110
unique mechanical and physical properties determined in large part by the shape of the graphite.<br />
These irons are produced in much the same way as ductile cast iron, except the objective is to<br />
have the molten iron dissolve a lesser amount of Mg, usually ~ 0.01 - 0.015 Wt. %. This amount<br />
of Mg is enough to guarantee that no flakes are formed, yet not high enough to allow full nodularity<br />
. A typical CG iron might contain 25% nodularity, the rest of the graphite having a twisted rodshaped<br />
structure. The mechanical and physical properties of compacted graphite irons, for a<br />
given matrix microstructure, will reside in between the properties of flake graphite irons and<br />
spheroidal grahite irons as shown schematically below. .<br />
Ductility<br />
Strength<br />
<br />
<br />
<br />
<br />
<br />
High<br />
<br />
<br />
<br />
<br />
<br />
<br />
<br />
<br />
<br />
<br />
<br />
<br />
<br />
<br />
<br />
<br />
<br />
<br />
CG<br />
Ductile<br />
<br />
<br />
Irons<br />
<br />
Irons<br />
<br />
<br />
<br />
<br />
<br />
<br />
<br />
<br />
<br />
<br />
<br />
<br />
<br />
<br />
<br />
<br />
<br />
<br />
<br />
<br />
<br />
<br />
Low<br />
Low<br />
<br />
<br />
<br />
<br />
<br />
<br />
<br />
<br />
0<br />
80%<br />
100<br />
Percent Nodularity<br />
Malleable Cast Iron<br />
As indicated previously, malleable cast iron is a material with lower carbon (2.0 - 2.6) and<br />
lower silicon (1.1 - 1.6) than gray cast iron, and solidifies as white cast iron. These are hypoeutectic<br />
irons which solidify by first forming austenite dendrites and then the eutectic austenite +<br />
cementite (Fe 3 C). The cast structure is then heat treated to produce the popcorn-type graphite<br />
structures that are characteristic of malleable cast iron. The phase diagram and the cooling curve<br />
111<br />
High<br />
<br />
<br />
<br />
<br />
<br />
<br />
Thermal Conductivity<br />
Damping Capacity
characteristic of white cast iron is given below:<br />
Temperature<br />
<br />
<br />
<br />
<br />
<br />
<br />
<br />
<br />
<br />
<br />
<br />
<br />
(α + γ + Fe3C) <br />
<br />
<br />
<br />
<br />
<br />
<br />
<br />
<br />
<br />
<br />
<br />
<br />
<br />
γ<br />
α<br />
γ + L<br />
α + Gr<br />
(α + Fe3C) Liquid, L<br />
<br />
<br />
<br />
<br />
<br />
<br />
<br />
<br />
<br />
<br />
<br />
<br />
<br />
<br />
<br />
<br />
<br />
<br />
<br />
L + Gr<br />
<br />
<br />
<br />
<br />
<br />
<br />
<br />
<br />
<br />
<br />
<br />
2.8<br />
T SSG<br />
∆Τ<br />
It can be seen in the cooling curve that the temperature has reached T C before nucleation of graphite<br />
has occurred thus resulting in the eutectic austenite plus carbide formation. The low silicon<br />
content, 1.5, and low carbon, 2.3, results in a smaller ∆T than for gray or ductile cast iron thus<br />
promoting the formation of white iron. After the casting has cooled to room temperature, the heat<br />
treatment to produce solid state formation of graphite, and therefore the popcorn graphite structure<br />
of malleable iron begins and is illustrated below. The castings are heated slowly into the γ +<br />
Temperature<br />
Fe 3 C two phase field to a temperature T SSG where it is soaked for as long as 24 hours. During this<br />
soaking time graphite will nucleate on the eutectic carbide particle surfaces and grow at their<br />
expense. Eventually all of the carbide will be replaced by “popcorn” graphite and the structure left<br />
behind will be quite similar to ductile cast iron except for the shape of the graphite. Like ductile<br />
cast iron the matrix is the continuous phase and so the final structure will have similar properties<br />
to ductile cast iron, excellent strength, ductility and toughness. The strength and ductility<br />
of malleable irons would overlap the as-cast properties of ductile iron shown on page 105.<br />
112<br />
L + Fe 3 C<br />
γ + Gr<br />
(γ + Fe3C) <br />
<br />
<br />
<br />
<br />
<br />
<br />
<br />
<br />
<br />
<br />
<br />
<br />
<br />
<br />
<br />
<br />
α+γ<br />
α + γ + Gr<br />
<br />
<br />
<br />
<br />
<br />
<br />
<br />
<br />
TUC Carbon Equivalent, CE<br />
Time<br />
Fe 3 C<br />
<br />
<br />
<br />
<br />
<br />
<br />
<br />
<br />
<br />
T G<br />
T C<br />
Cooling Curve<br />
(White Iron)<br />
T L<br />
Solidification<br />
Complete<br />
TL = γ Liquidus<br />
T G = Graphite Eutectic<br />
T C = Carbide Eutectic<br />
Time<br />
<br />
T <br />
Soaking at TSSG allows Growth<br />
<br />
of<br />
SSG<br />
Graphite Particles at Expense of Carbide<br />
<br />
<br />
<br />
TUC Ferritic Malleable<br />
<br />
<br />
T R<br />
Slow Heating<br />
Nucleates Many<br />
Graphite Particles<br />
<br />
<br />
<br />
<br />
<br />
<br />
Pearlitic<br />
<br />
<br />
<br />
Malleable<br />
24 hours
Pearlitic malleable irons would be stronger but less ductile than ferritic malleable cast irons for<br />
the same reasons as for ductile iron. The temperature - time diagram on the previous page illustrates<br />
the heat treatments responsible for the production of ferritic malleable iron (by slow cooling<br />
through the upper critical temperature, TUC ) and pearlitic malleable iron (by more rapid<br />
cooling, even cooling in air) after the malleablizing treatment.<br />
Malleable cast iron has been produced by human beings for thousands of yesrs, but it is<br />
slowly but surely being replaced by ductile cast iron. Two important reasons why malleable iron<br />
is decreasing in favor, is cost and limitations on section size that can be produced in the malleable<br />
state. Clearly it is less costly to produce nodules in the as-cast condition than to require an<br />
additional long time heat treatment step. In addition ductile cast iron can be produced in very<br />
large section sizes, while the requirement to start with white iron limits malleable to practical section<br />
sizes on the order of 1 - 2 inches. Malleable iron section sizes larger than this will solidify<br />
with graphite flakes and would therefore have severely reduced ductility. A comparison of the<br />
United States’ production of malleable, ductile, and gray cast irons in the figure below illustrates<br />
the unmistakable trends. Malleable iron is a dying breed, and most of its former applications have<br />
been replaced by ductile cast <br />
iron.<br />
Production (Millions of Tons)<br />
Malleable<br />
1.2<br />
1.0<br />
0.8<br />
0.6<br />
0.4<br />
0.2<br />
0<br />
<br />
<br />
<br />
<br />
<br />
<br />
<br />
<br />
<br />
<br />
<br />
<br />
<br />
<br />
<br />
<br />
<br />
<br />
<br />
<br />
<br />
<br />
<br />
<br />
<br />
<br />
<br />
<br />
<br />
<br />
<br />
<br />
<br />
<br />
<br />
<br />
<br />
<br />
<br />
<br />
<br />
<br />
<br />
<br />
<br />
<br />
<br />
<br />
<br />
<br />
<br />
<br />
<br />
<br />
<br />
<br />
<br />
<br />
<br />
<br />
<br />
<br />
<br />
<br />
<br />
<br />
<br />
<br />
<br />
<br />
<br />
<br />
<br />
<br />
<br />
<br />
<br />
<br />
<br />
<br />
<br />
<br />
<br />
<br />
<br />
<br />
<br />
<br />
<br />
<br />
<br />
<br />
<br />
<br />
<br />
<br />
<br />
<br />
<br />
<br />
<br />
<br />
<br />
<br />
<br />
<br />
<br />
<br />
<br />
<br />
<br />
<br />
<br />
<br />
<br />
<br />
<br />
<br />
<br />
<br />
<br />
<br />
<br />
<br />
12<br />
Ductile Iron<br />
Gray Iron<br />
10<br />
Malleable Iron<br />
8<br />
Projected<br />
<br />
<br />
<br />
<br />
<br />
<br />
<br />
<br />
<br />
<br />
<br />
<br />
<br />
<br />
<br />
<br />
<br />
<br />
<br />
<br />
<br />
<br />
<br />
<br />
<br />
<br />
<br />
<br />
<br />
<br />
<br />
<br />
<br />
<br />
<br />
<br />
<br />
6<br />
<br />
<br />
<br />
<br />
<br />
<br />
<br />
<br />
<br />
<br />
<br />
<br />
<br />
<br />
<br />
<br />
<br />
<br />
<br />
<br />
<br />
<br />
<br />
<br />
<br />
<br />
<br />
<br />
<br />
<br />
<br />
<br />
<br />
4<br />
<br />
<br />
<br />
<br />
<br />
<br />
<br />
<br />
<br />
<br />
<br />
<br />
<br />
<br />
<br />
<br />
<br />
<br />
<br />
<br />
<br />
<br />
<br />
<br />
<br />
<br />
<br />
<br />
<br />
<br />
<br />
<br />
<br />
<br />
<br />
<br />
<br />
<br />
<br />
<br />
<br />
<br />
<br />
<br />
<br />
<br />
<br />
<br />
2<br />
<br />
<br />
<br />
<br />
<br />
<br />
<br />
<br />
<br />
<br />
<br />
<br />
<br />
<br />
<br />
<br />
<br />
<br />
<br />
<br />
<br />
<br />
<br />
<br />
<br />
<br />
<br />
<br />
<br />
<br />
<br />
<br />
<br />
<br />
<br />
<br />
0 <br />
<br />
<br />
Gray &<br />
Ductile<br />
1970 1980 1990 2000<br />
Year<br />
Recession Data from Modern <strong>Casting</strong><br />
The data in this plot shows scatter which is a result of fundamental change (decreasing gray and<br />
malleable iron and increasing ductile iron production) as well as a reflection on the economics of<br />
the times.It is interesting to note the dip in production of all three of these materials in 1982, a<br />
recession which hit the casting and manufacturing industry very hard. Indeed the production of<br />
steel in the U.S. plummeted from ~ 140 million tons in 1980 to about 80 million tons in 1982.<br />
113
XV. Defects in Cast <strong>Metal</strong>s<br />
Gases in <strong>Metal</strong>s<br />
Sources - Gases dissolved in liquid; Gases from mold or core material<br />
1. Gases dissolved in the metal - Classic example of Hydrogen in Aluminum Alloys<br />
From the schematic plot below there is a much greater solubility of H in the liquid than the solid.<br />
%H<br />
solid<br />
Thus, if the gas is present in the liquid, hydrogen will be evolved as H 2 during solidification. This<br />
gas may be trapped in the casting which results in porosity or “blows”.<br />
Sources of H : H 2 O in air, charge; H - containing compounds in combustion gases; contamination<br />
of the charge with oil,grease,etc.<br />
Remedy- Bubble a gas through the melt, like argon, nitrogen, chlorine, sulfur hexafluoride. These<br />
gases cleanse the melt by action of Sievert’s Law and by providing a reactant with which the<br />
hydrogen can be chemically changed and then removed.<br />
Sievert’s Law- % H = Kp(H 2 )0.5<br />
Tmp Temperature<br />
0.5 ml/100 g Al<br />
In this expression H is the concentration in liquid Al , K is the equilibrium constant, and p(H 2 ) is<br />
the partial pressure of H in equilibrium with a gas in contact with the melt. If new gas with low<br />
p(H 2 ) is continually added the H will be extracted from the melt to establish equilibrium. Thus H<br />
will be eliminated before pouring the casting. This mechanism will work well with an inert gas<br />
like argon; however a more potent method will include using a gas containing a reactive component<br />
like chlorine or SF 6 . In this situation the H reacts with the Cl or the SF 6 and is removed as<br />
another gaseous species, for example HCl . Unfortunately this is a rather dangerous product and<br />
most aluminum foundries are working hard to eliminate the use of Cl. The gas used in our experimental<br />
foundry is argon with about 5% SF 6 .<br />
2. Gases from molds or cores<br />
Binder systems for cores or molds create gaseous combustion products when encountering the<br />
heat from the casting operation. These gases must be vented from the mold, otherwise “blows”<br />
can be produced in the casting. Venting is accomplished by suitable holes being placed in the<br />
114<br />
liquid
cores or molds. Gases that find their way into castings are often trapped under the cope surface,<br />
but can actually be found anywhere within the casting depending upon the situation.<br />
Remedy - Proper venting, reduce binder content in core, change binder in core, increase sand permeability,<br />
control pouring temperature, etc.<br />
Controlled Positive Effects of Gas in <strong>Casting</strong>s<br />
1. Al alloys - Add potatoes to the melt to increase the gas content; finely divided H 2 porosity may<br />
be preferred to large macroshrink porosity - this technique is usually not recommended.<br />
Hot Tears<br />
Hot tears are defects which occur most often in materials with a large range of solidification<br />
and with significant mold constraints. Hot tears are defects which require the presence of a<br />
liquid. Consider the phase diagram and sand casting below:<br />
Temperature<br />
<br />
<br />
<br />
<br />
<br />
<br />
<br />
<br />
<br />
<br />
TA T α<br />
E<br />
α + L<br />
L + β<br />
β<br />
0<br />
<br />
<br />
<br />
<br />
<br />
<br />
<br />
<br />
<br />
<br />
<br />
<br />
<br />
<br />
<br />
<br />
cA c0 L<br />
α + β<br />
<br />
<br />
<br />
<br />
<br />
<br />
c1 Weight Fraction B<br />
1<br />
Alloys with compositions between 0 and c 0 wt. fraction B and between c 1 and 1 will, on cooling<br />
from the liquid, pass through the shaded regions in the α + L and L + β two phase fields. Within<br />
these shaded regions these alloys will experience a temperature range over which more than 50 %<br />
solid is present. For example an alloy of composition c A will have about 50 % solid α at T A , and<br />
on cooling to T E this solid amount will increase by the lever rule to about 70 %. Thus it is anticipated<br />
that solid continuity will exist throughout the surface volume of the piece over a temperature<br />
range in which contraction of that solid due to cooling is occurring in the presence of the<br />
liquid. Solid continuity is expected along the surface because that is where solidification usually<br />
begins. If the contracting solid is constrained by a rigid or even an expanding mold, stresses may<br />
build up within the solid portion of the casting which are ultimately relieved by tensile failure<br />
along some convenient dendrite - liquid interface. The casting is literally torn apart. This failure is<br />
known as a “hot tear”, an opening which may or may not be filled by the liquid that is present.<br />
Consider the tensile bar shaped casting shown above, a sand casting with an alloy concentration<br />
of c A which in the sketch is shown as being partly solidified in the temperature range T A to<br />
115<br />
Tensile Bar Shaped <strong>Casting</strong><br />
Hot Spots<br />
Solidifying <strong>Metal</strong><br />
Liquid <strong>Metal</strong>
T E . The solidified metal is shown as being continuous on the surface of the casting, with relatively<br />
thick solid layers at the external corners (large mold volume to extract heat) and thin solid<br />
layers at the internal corners (the so-called hot-spots where there is only a small mold volume to<br />
extract heat). The continuity of the solid combined with the reality of this continuity over the temperature<br />
range T A - T E results in the weak solid skin wanting to contract. At the same time the<br />
mold is heating and it wants to expand. The clash between the expanding mold and the contracting<br />
solid metal will generate tensile stresses in the solid metal and compressive stresses in the<br />
mold. It is apparent that something will have to give. If the mold remains rigid and expanding it is<br />
inevitable that the solid skin of the casting will “tear” at the weakest points in the system, the hot<br />
spots shown on the above sketch. These tears often will extend to the surface resulting in what<br />
appears to be cracks. The presence of the liquid during this event may allow the hot tear to be<br />
filled as it is happening. In this case the integrity of the casting will not be lost but it is possible<br />
that the liquid “filler” , because of segregation, could have a significantly different composition<br />
than the solid and thus act as a weak point in the structure. If, on the other hand, the liquid cannot<br />
fill the expanding tear, then the integrity of the casting is lost.<br />
The likelihood of such an occurrence:<br />
1. Increases as the temperature range containing more than 50% solid<br />
increases. Thus the problem is minimized for pure elements and eutectics.<br />
2. Increases as sand expansion increases. Thus collapsible sand molds are<br />
helpful to avoid the production of tensile stresses in castings. Molding<br />
sands with minimal thermal expansion will also tend to minimize this<br />
defect.<br />
3. Increases in designs containing coring (particularly with large cores)<br />
and casting designs containing sharp corners or large section size changes.<br />
Remedies:<br />
1. If possible, stay away from specifying large freezing range alloys for<br />
castings. Of course this is not always possible, and so the designer must be<br />
aware of the problem and take other steps to minimize the problem.<br />
2. If possible, use generous fillets in design to avoid hot spots (see the<br />
examples below) and minimize section size changes.<br />
Not This This<br />
3. If possible, make additives (cereal, wood flour) to sand to improve<br />
collapsibility. These additives, which are part of the binder, will combust<br />
in service near the mold-metal interface, destroying the bond and making<br />
the sand more collapsible, thereby relieving the compressive stresses in the<br />
sand.<br />
116
Other Significant Commercial Areas where Hot Tearing is a Potential Problem<br />
1. Brazing, soldering and welding materials where large and rapid expansion-contractionsituations<br />
occur. The solution most often used in such situations is to select eutectic or near<br />
eutectic materials as filler metals (which solidify over a small temperature range where<br />
there are no opportunities for continuous solids to exist over a temperature range), thereby<br />
minimizing the problem.<br />
2. Continuously cast slabs and billets of steel which experience rapid changes in cooling<br />
during the casting operation often generate hot tears which are subsequently filled in with<br />
a liquid experiencing macrosegregation. Unlike microsegregation, which is a local problem<br />
on the order of dendrite arm spacing, macrosegregation can result in large changes in<br />
composition from one point to another in the casting. Thus even though the hot tears are<br />
filled in with liquid, the macrosegregated liquid “tears” result in planes of weakness which<br />
can easily fail in subsequent rolling operations.<br />
Residual Stresses in <strong>Casting</strong>s<br />
Residual stresses are elastic stresses remaining in a casting which result from variations in<br />
cooling rate from point to point as the casting cools to room temperature. These stresses are<br />
developed in the solid state and have nothing to do with solidification. If the developing<br />
stresses are large enough and exceed the elastic limit, cracking or warping of the casting can occur<br />
before the casting reaches room temperature. Consider, for example, an automobile disc brake<br />
rotor. Rotors are usually gray iron castings which are typically a class 30 iron, with a pearlitic<br />
matrix as cast. A schematic of a rotor showing a cross section is given below together with cooling<br />
curves from thermocouples placed within the hat (point 1) and the inboard wear plate (Point<br />
2). Stress distributions within the wear plate are also illustrated for two times in the cooling<br />
117
sequence.<br />
Hat<br />
<br />
<br />
<br />
<br />
<br />
<br />
<br />
<br />
<br />
<br />
<br />
<br />
<br />
<br />
<br />
<br />
<br />
<br />
<br />
<br />
<br />
<br />
<br />
<br />
<br />
<br />
<br />
<br />
<br />
<br />
<br />
<br />
<br />
<br />
<br />
<br />
<br />
<br />
<br />
<br />
<br />
<br />
<br />
<br />
<br />
<br />
<br />
<br />
<br />
<br />
<br />
<br />
<br />
<br />
<br />
<br />
<br />
<br />
<br />
<br />
<br />
<br />
<br />
<br />
<br />
<br />
<br />
<br />
<br />
<br />
<br />
<br />
<br />
<br />
<br />
<br />
<br />
<br />
<br />
<br />
Inboard Wear Plate Outboard Wear Plate<br />
Wear Plate Stresses<br />
Tensile - Tangential<br />
Compressive -Radial<br />
(Relieved by plastic<br />
flow in the hat)<br />
<br />
<br />
1<br />
2<br />
Recrystallization Temperature, Plastic - Elastic Transition<br />
In the above sketch it is important to note that the “hat” section of the rotor has a larger<br />
cross section (typically 3/4 in. vs. 1/2 in.) than either the inboard or outboard wear plates (The<br />
wear plates are the surfaces on which the brake pads ride.). The cooling curves in the sketch<br />
reflect that difference, the hat section cooling at a much slower rate than the wear plate. As a<br />
result of the section size difference the cooling curve for the hat section crosses the temperature of<br />
one half of the melting point,T m /2, at a later time than the wear plate; i.e. t H > t I . One half of the<br />
melting point is commonly used as an estimate of the recrystallization temperature of a metal<br />
material, the temperature which separates plastic flow (where dynamic recrystallization can take<br />
place) from the lower temperature regime in which significant elastic deformation occurs. The<br />
result of these different parts of this casting cooling to room temperaure at different rates finally<br />
generates the residual elastic compressive stresses (tangential) and tensile stresses (radial) in the<br />
wear plates as shown in the above figure. The cooling curve - developing stress scenario is outlined<br />
below:<br />
1. At time t 0 , just after solidification is complete, both the hat and the wear plate sections<br />
are cooling and contracting, but at different rates. However the temperatures are high enough that<br />
118<br />
TEMPERATURE<br />
T m<br />
T m /2<br />
T R<br />
Solid State Cooling Curves<br />
<br />
<br />
<br />
<br />
<br />
<br />
<br />
<br />
<br />
<br />
<br />
<br />
<br />
<br />
<br />
<br />
<br />
<br />
<br />
<br />
t <br />
<br />
I<br />
<br />
t<br />
<br />
<br />
<br />
H Elastic<br />
<br />
<br />
<br />
<br />
<br />
<br />
Inboard Wear Plate (2)<br />
<br />
<br />
Hat (1)<br />
<br />
Plastic<br />
<br />
<br />
<br />
<br />
<br />
t0 t1 t2 Cooling Fin<br />
TIME<br />
At time t1 At time t2 DISC BRAKE ROTOR<br />
<br />
<br />
<br />
Wear Plate Stresses<br />
Compressive -<br />
Tangential<br />
Tensile -Radial<br />
(Residual Elastic<br />
Stress Buildup in both<br />
hat and Wear plate)
any stresses developing within each section will be relieved by plastic flow in one section or the<br />
other. This occurs because the temperatures are much higher than the point at which dynamic<br />
recrystallization can occur (In cast irons this temperature, T m /2 = 350 o C).<br />
2. At time t 1 , the wear plate has cooled into the elastic range (at t I ) and is still contracting<br />
more rapidly than the hat which is still well within the plastic zone. Contraction of the wear plates<br />
sets up tensile tangential stresses within itself and, by virtue of the connection between the two<br />
parts, corresponding compressive stresses in the hat. Because the hat is still in the plastic zone,<br />
these stresses can be relieved by plastic flow within the hat. Thus there is no problem yet.<br />
3. At time t 2 , the wear plates are essentially at room temperature and are therefore no<br />
longer contracting. However the heavier section hat has just entered the elastic zone at t H and is<br />
continuing to contract. The contracting hat will then put the wear plates into residual tangential<br />
compression (and radial tension) as it tries to pull away from the wear plates, leaving itself in a<br />
state of tensile elastic stress.<br />
Clearly the magnitude of the stresses present will depend upon the differences in rate at<br />
which these sections cool and the relative section sizes through which these residual stresses can<br />
be distributed.<br />
Implications of Residual Stresses<br />
1. If the stresses are large enough to cause yielding then a shape change (warping) can<br />
occur during the cool down period of the casting. In some instances the stresses can even be large<br />
enough to cause catastrophic failure, a documented result in large semi-continuous cast aluminum<br />
alloy ingots which have been left to cool after casting.<br />
2. A casting containing significant residual stress could fail or warp during the machining<br />
operation depending on the nature of material removed during machining. For example disc brake<br />
rotors have been known to change shape as material is removed during machining of the wear<br />
plates to their final configuration.<br />
3. A casting containing significant residual stress could fail in service. A classic example<br />
of this problem is illustrated by railroad car wheels which have exploded when the full weight of<br />
the car is brought to the individual wheel. In some instances the shrapnel resulting was enough to<br />
punch big holes in buildings and kill people.<br />
Solutions to Problems<br />
1. Control Cooling After Shakeout - The straightforward solution to excessive residual<br />
stress is to control processing so that all sections cool down uniformly. This could be done by<br />
shaking the castings out of their molds and then putting them together in a soaking pit. This is<br />
especially important for castings with large section size differences, like the railroad car wheel.<br />
2. Stress Relief Anneal - In those instances in which the residual stresses are not large<br />
enough to affect the as cast condition, but are large enough to affect the part during machining or<br />
in service (often promoting dimensional change and/or warping), the castings may be subject to a<br />
stress relief anneal.<br />
For ferrous castings this involves heating to about 1000 - 1100 o F followed by slowly<br />
cooling, usually in air. In ferrous castings this temperature range is well below the temperature<br />
where significant microstructural change can take place; i.e. it is well below the lower critical<br />
temperature where the ferrite begins to transform into austenite. It is also well below the temperature<br />
range where significant spheroidization of pearlite can occur.<br />
119
For aluminum alloy castings a stress relief anneal, called the T5 treatment (also called a<br />
stabilization treatment), is carried out in the range 400 - 500 o F followed by an air cool. In many<br />
cast aluminum alloys this treatment also contributes to a slight increase in strengthening by age<br />
hardening in addition to the stress relief anneal. This is a cheap way to pick up strength, because a<br />
solution treatment process normally required before age hardening is not necessary. Apparently<br />
there is enough supersaturation of portions of the matrix α dendrites as a result of cooling following<br />
casting to allow precipitation hardening without the solution treatment. This can be understood<br />
by realizing that the coring described by the Scheil analysis of microsegregation in<br />
dendrites results in relatively high alloy concentrations in the volumes immediately on the edges<br />
of the dendrites, volumes which can then be coaxed to precipitate the strengthening particles at<br />
400 - 500 o F.<br />
Residual Stress Measurements<br />
There are a number of techniques which are available to measure residual stresses in castings,<br />
techniques which are utilized by many companies to better understand and control their<br />
product. These techniques can be placed into two camps, destructive and nondestructive.<br />
The non-destructive camp utilizes electromagnetic radiation to effectively measure the<br />
interplanar spacings in materials as a function of position, heat treatment and service conditions.<br />
The most common technique available is the x-ray diffraction technique, where a beam of x-rays<br />
of known wavelength, λ, is scattered from certain definable atomic planes in the item of interest.<br />
These planes will have a spacing d, which can be measured using Bragg’s Law:<br />
d = λ / 2 sin θ<br />
where θ is the diffraction angle measured. The departure of the measured d from that of the material<br />
not experiencing residual elastic stress is used to compute that stress. This is a very common<br />
technique to investigate surface residual stresses in carburized and induction hardened cases in<br />
steel. Unfortunately residual stress measurements by this method are limited to measurements on<br />
the surface of the sample. Bulk stresses are not measureable unless the internal stresses are identical<br />
to that on the surface. It is possible to remove material from the surface by etching techniques<br />
and then by this serial technique continue to measure stresses with depth into a material. Of<br />
course, this then ceases to be non-destructive. Another technique available to do nondestructive<br />
testing involves the use of neutron scattering, a technique which does allow examination of the<br />
stresses at depth. Unfortunately neutron scattering equipment is not common and measurements<br />
are quite expensive.<br />
Destructive measurement are often the only reliable, relatively quick methods to evaluate<br />
the degree to which residual stresses exist. These methods can involve cutting and / or drilling<br />
castings on which strain gages have been placed to record relief of elastic compressive or tensile<br />
stresses after the cutting operation. These methods have been used at MTU to measure residual<br />
120
stresses in as - cast disc brake rotors. A brief synopsis of part of that work is indicated below:<br />
Strain<br />
Gage<br />
Qualitative Method - Radial Cut<br />
Tangential Stresses<br />
B B<br />
A<br />
* * A<br />
* *<br />
1. Mark points A-A & B-B<br />
2. Measure distances A-A & B-B<br />
3. Cut rotor along dark lines and<br />
remove the wedge<br />
4. Remeasure distances A-A & B-B<br />
5. Distance change proportional to<br />
Residual Elastic Tangential Stress<br />
Change in A-A Distance (in.)<br />
0<br />
A variety of rotors were subjected<br />
to this qualitative test with the results<br />
plotted below as movement at A-A<br />
versus the weight of the casting.<br />
The qualitative method above is made quantitative by adding strain gages to the wedge which is<br />
removed. This gage, which measures both radial and tangential stresses is illustrated in the above<br />
sketch. Rotor closure occurred in almost all cases, the extent of closure proportional to the degree<br />
of tangential residual compressive stresses present. It can be seen that the magnitude of the residual<br />
stresses in the largest rotor (also largest difference in section size between the hat and the wear<br />
plates) is on the order of 9000 psi, a significant fraction of the nominal 30000 psi ultimate. Radial<br />
stresses were mostly tensile, but relatively small, in the neighborhood of 1000 psi. It can easily be<br />
seen that machining could result in changes in shape as a result of the relief of these stresses, or<br />
changes in how the stresses are born by the rotor. In addition, it is also clear that the heating which<br />
results from service conditions could result in stress relief with eventual warping, a condition<br />
which could promote brake judder, the experience of rapid and sometimes violent pulsating when<br />
the brakes are applied.<br />
Another method commonly used to measure residual stresses in materials is called the<br />
“blind hole method”, a technique where a special strain gage is glued to the piece in question.<br />
Then a small, precise hole is drilled in the center of the gage, and the relaxation of the stresses is<br />
recorded at several locations around the hole. The principal stresses are computed from these<br />
data, which can then be used to compute the residual stresses. Because this is such a small hole,<br />
this test could be considered non-destructive. Unfortunately it too is mainly a surface stress<br />
method. Bulk stress measurements by this method are possible but the degree of difficulty is high<br />
and the errors in measurement are potentially quite large.<br />
121<br />
<br />
<br />
<br />
<br />
<br />
<br />
<br />
<br />
<br />
<br />
<br />
<br />
<br />
<br />
<br />
<br />
<br />
-.01<br />
-3<br />
<br />
<br />
<br />
<br />
<br />
<br />
<br />
<br />
<br />
<br />
<br />
<br />
<br />
<br />
-.02<br />
-6<br />
<br />
<br />
<br />
<br />
<br />
<br />
<br />
<br />
<br />
<br />
<br />
<br />
<br />
<br />
-.03<br />
-9<br />
<br />
<br />
<br />
<br />
<br />
<br />
<br />
<br />
<br />
<br />
<br />
<br />
<br />
-.04<br />
12 16 20 24 28<br />
-12<br />
32<br />
Rotor Weight (Lb)<br />
<br />
<br />
<br />
<br />
<br />
<br />
<br />
<br />
<br />
<br />
<br />
0<br />
Tangential Residual Stress (ksi)
XVI. Cast Steel<br />
The production of steel castings has played an important role in the transportation and<br />
construction equipment industry for many years. Steel castings, with their excellent combination<br />
of strength, toughness and ductilitity will continue to fill an important niche in these applications<br />
and others. Steel is usually defined as an Fe - C alloy with carbon compositions mostly less than<br />
0.5 wt. %, carbon amounts much less than those generated in cast irons. Because of the low carbon<br />
and silicon content of most steels, solidification of these materials does not involve the production<br />
of graphite, even though graphite is the stable phase in equilibrium with austenite and<br />
ferrite. Steels with carbon contents less than 0.5 wt. % will solidify in a manner which includes a<br />
peritectic reaction. A portion of the Fe - C phase diagram which is pertinent to steel casting and<br />
heat treatment is given below:<br />
Temperature, oC<br />
<br />
<br />
<br />
<br />
<br />
<br />
<br />
<br />
<br />
<br />
<br />
<br />
<br />
<br />
<br />
<br />
<br />
<br />
<br />
<br />
<br />
<br />
<br />
<br />
<br />
<br />
<br />
<br />
<br />
DELTA<br />
<br />
FERRITE<br />
<br />
(δ) bcc<br />
1600<br />
<br />
<br />
<br />
<br />
<br />
<br />
0.1<br />
0.16<br />
1496 (Peritectic <br />
Temperature)<br />
<br />
<br />
1536<br />
<br />
<br />
<br />
<br />
<br />
<br />
<br />
<br />
<br />
<br />
<br />
<br />
<br />
<br />
1500<br />
<br />
<br />
<br />
<br />
<br />
<br />
<br />
<br />
<br />
<br />
<br />
<br />
<br />
<br />
<br />
<br />
<br />
<br />
<br />
<br />
<br />
<br />
<br />
<br />
<br />
<br />
<br />
<br />
<br />
1400<br />
γ + L<br />
0.54<br />
<br />
<br />
<br />
<br />
<br />
<br />
<br />
<br />
<br />
<br />
<br />
<br />
<br />
1300<br />
<br />
<br />
<br />
<br />
<br />
<br />
<br />
<br />
<br />
AUSTENITE (γ) fcc<br />
<br />
<br />
<br />
<br />
<br />
<br />
<br />
<br />
<br />
<br />
<br />
<br />
<br />
<br />
<br />
<br />
<br />
<br />
<br />
<br />
<br />
1200<br />
2 <br />
% <br />
Maximum <br />
Carbon<br />
<br />
<br />
<br />
<br />
<br />
<br />
Solubility<br />
at 1148 <br />
<br />
<br />
<br />
<br />
<br />
<br />
<br />
<br />
<br />
1100<br />
<br />
<br />
<br />
o <br />
<br />
C<br />
<br />
<br />
<br />
<br />
<br />
<br />
<br />
<br />
<br />
<br />
<br />
<br />
<br />
<br />
<br />
<br />
<br />
<br />
<br />
<br />
<br />
<br />
<br />
1000<br />
<br />
<br />
<br />
<br />
<br />
<br />
<br />
723 (Eutectoid Temperature)<br />
<br />
<br />
<br />
<br />
<br />
900<br />
<br />
<br />
<br />
<br />
<br />
<br />
<br />
<br />
<br />
<br />
<br />
<br />
<br />
<br />
<br />
<br />
<br />
<br />
<br />
<br />
<br />
<br />
<br />
<br />
<br />
<br />
<br />
<br />
<br />
<br />
<br />
<br />
800<br />
α + γ<br />
<br />
<br />
<br />
<br />
<br />
<br />
<br />
<br />
<br />
<br />
<br />
<br />
<br />
<br />
<br />
<br />
<br />
<br />
<br />
<br />
<br />
<br />
<br />
<br />
<br />
<br />
<br />
<br />
<br />
<br />
700<br />
<br />
<br />
<br />
<br />
<br />
<br />
<br />
<br />
FERRITE <br />
(α) bcc α + Fe <br />
<br />
<br />
<br />
<br />
<br />
<br />
3C γ + Fe3C 600<br />
<br />
<br />
<br />
<br />
<br />
<br />
0 0.1 0.2 0.3 0.4 0.5 0.6 0.7 0.8 0.9 1.0<br />
Fe<br />
Weight Percent Carbon<br />
Consider a steel with a composition of 0.16 wt % carbon, the peritectic alloy. A peritectic<br />
reaction is one where liquid + solid -> new solid. In the case of plain carbon steels, this reaction<br />
is described as:<br />
Liquid (0.54 Carbon) + δ Ferrite (0.1 Carbon) -> Austenite (0.16 Carbon)<br />
The peritectic alloy, on casting from about 1600 o C, goes through the following phase changes on<br />
solidification in order: First, nucleation and growth of δ dendrites of composition 0.025 C at 1525<br />
o C; Second, growth of δ dendrites until 1496 o C is reached at which point the dendrites of composition<br />
0.1 C (the dendrites have no trouble maintaining the equilibrium carbon composition<br />
122
ecause of the very high diffusion rate of carbon at these temperatures) react via the peritectic<br />
reaction with the remaining liquid of composition 0.54 C to form austenite of composition 0.16<br />
carbon. This reaction involves a long range diffusion problem for the carbon in the system; the<br />
carbon must diffuse from the liquid through the forming austenite layer to the interface between<br />
the austenite and the δ ferrite, illustrated on the schematic by points a and b. :<br />
Liquid (0.54 C)<br />
δ (0.1 C)<br />
At 1496, before Peritectic Reaction<br />
Thus the austenite “layer” takes on the dendritic shape of the primary delta ferrite, the interface of<br />
the product austenite growing in both directions, into the liquid and into the solid ferrite with the<br />
rate of the reaction governed by the rate at which diffusion of carbon can occur across the austenite<br />
layer and into the volume which is carbon poor. Fortunately the high rate of carbon diffusion at<br />
these temperatures allows the reaction to be completed very quickly; thus the liquid and the primary<br />
delta is transformed to austenite. Further cooling of this austenite to room temperature<br />
results in the solid state reactions to proeutectoid ferrite (between 875 and 723 o C) and finally a<br />
significant amount of pearlite (below 723 o C) as dictated by the binary phase diagram on page 74.<br />
Segregation of Alloying Elements During Solidification of Steel<br />
The product of the peritectic reaction, the austenite phase, is quite homogeneous in carbon<br />
content because of the relatively high diffusion rate of interstitial carbon in the austenite. Unfortunately<br />
this is not the case for other substitutional alloy elements like manganese, chromiun,<br />
nickel, copper, molybdenum, etc. These elements will initially be segregated during the nucleation<br />
and growth of the primary delta ferrite, and then will find a huge barrier awaiting them when<br />
the peritectic reaction occurs. Their diffusion rate in the austenite is slow enough at the peritectic<br />
temperature that a large fraction is left behind in the liquid which is being depleted by the growing<br />
austenite interface. The final solid austenite product then contains regions of grossly different<br />
alloy composition (microsegregation) which mirrors the original delta dendritic appearance. Consider<br />
for example the element manganese. The equilibrium Fe - Mn binary diagram predicts an<br />
equilibrium distribution coefficient of about 0.6 in the range of compositions 0 to 5 weight percent<br />
manganese. This means that in the initial dendritic solidification of delta ferrite the new solid<br />
that forms will only contain about one half of the amount included in the alloy. The remainder of<br />
the Mn will be left out in the liquid, where it will remain until the austenite begins to form in the<br />
peritectic reaction. Fortunately the solubility of Mn in the austenite phase is quite large, and so the<br />
austenite interface advancing into the liquid can include those Mn atoms that it encounters in its<br />
sweep toward the completion of solidification. However, the diffusion coefficient of the substitutional<br />
Mn atom is not rapid enough to allow the original Mn-poor delta volume to achieve equilibrium<br />
during the time of the peritectic reaction or even after solidification is complete. The<br />
diffusion coefficient of Mn in austenite is given by the relationship:<br />
D Mn = 0.055 exp [- 29995 / T] (cm2/sec)<br />
123<br />
a<br />
b<br />
Liquid (0.54 C)<br />
δ (0.1 C)<br />
γ (0.16 C)<br />
At 1496, During Peritectic Reaction
Where DMn is the diffusion coefficient of manganese and T is the absolute temperature in o K.<br />
Using the simple approximation that the time required for diffusion over a distance x, is given by:<br />
t = x 2 / 2DMn, and assuming that the distance required for Mn atoms to move is on the order of 100 microns<br />
(10-2 cm), solving for time required at the melting point of ~ 1500oC (1777oK) gives :<br />
t = (10-2 ) 2 / 2 (0.055 exp[- 29995 / 1777 ]) = (19476 Sec) or 325 min.<br />
Even with a very small distance x, of 10 microns (10 -3 cm), the time is on the order of 3 minutes,<br />
a much longer time than what is usually available during the cooling of the casting. The net result<br />
is that significant manganese segregation will remain within the casting, segregation which has<br />
strong implications for the microstructures and therefore mechanical properties that are attainable<br />
in these materials. Consider a steel with a manganese concentration of 0.7 %.(A typical cast steel<br />
will have manganese concentrations in the range 0.25 - 1.0 wt. percent.). The sketch below illustrates<br />
schematically the Mn concentration gradients that could be expected within a solidified<br />
microstructure and therefore also at room temperature.<br />
Original Delta <br />
Ferrite Dendrite<br />
<br />
Solidified Austenite<br />
<br />
<br />
<br />
2<br />
kC0 = 0.6x0.7 = 0.42<br />
<br />
<br />
<br />
<br />
<br />
<br />
<br />
<br />
<br />
<br />
0 x-> 1<br />
<br />
<br />
<br />
<br />
<br />
Manganese (Wt. %)<br />
<br />
<br />
<br />
<br />
<br />
1<br />
<br />
C0 =0.7 Mn<br />
0<br />
0 Distance x<br />
1<br />
Microprobe Trace for Manganese<br />
Thus a solidified cast steel with such a composition variation could be expected to reflect that<br />
variation in the microstructure of the casting. Because of the effect that Mn has in moving the<br />
boundaries of the Fe - C phase diagram (increasing Mn reduces the carbon content of the eutectoid<br />
and reduces the eutectoid temperature) the low Mn areas corresponding to dendrite centers<br />
will be ferritic and the remainder pearlitic in slowly cooled cast steels. These concentration variations<br />
and therefore microstructural variations will also persist in rolled steels, a situation where<br />
the rolling operation “strings out” the segregated dendrites so that “bands” of segregation result.<br />
This, of course, results in bands (in the rolling direction) of different microstructural products<br />
which depends upon the subsequent heat treatment. This “banding” can lead to premature failure,<br />
or reduced mechanical properties in a direction perpendicular to the bands. See the schematic rep-<br />
124
esentation below:<br />
<br />
<br />
<br />
<br />
<br />
<br />
<br />
<br />
“Ferrite” Dendrites in<br />
a Pearlitic Matrix<br />
<br />
<br />
Melting and Refining of Steel<br />
Melting in modern steel foundries is most often accomplished by the use of electric arc<br />
furnaces or electric induction furnaces. Most melting is accomplished in relatively small furnaces<br />
(compared to those used to produce continuous cast steel for bars and plates) and the charges are<br />
carefully blended to give the correct composition at the finish of the melting sequence. In many<br />
instances the only extra processing needed is to deoxidize the steel just prior to pouring, a process<br />
accomplished by adding Si, Mn, or Al. Each of these elements will combine with the oxygen that<br />
is present and form oxides which can then in principle be skimmed from the slag. In larger arc furnaces<br />
into which a variety of steel scrap (even that high in carbon) is charged, a refining step may<br />
be added in which oxygen or mill scale (FeO) is added to provoke a carbon boil, an event in which<br />
the carbon reacts with the oxygen to form CO bubbles which then leave the melt. This action<br />
reduces the carbon to the desired range after which the deoxidation step (adding Si, Mn, or Al) is<br />
taken to remove the detrimental effect of high oxygen content in the melt. Details on the thermodynamics<br />
of the processes can be obtained in a number of texts, including “Making, Shaping, and<br />
Heat Treating of Steel”, 10th edition.<br />
In recent years, steel foundries have identified oxide inclusions as the most prominent<br />
defect in their castings, defects which can be macro-sized (large enough to see with the naked<br />
eye) or present as microinclusions. Interestingly many of these inclusions result from the inability<br />
of these oxide particles to be removed by the slag, particles which can subsequently grow when<br />
new oxygen is encountered that comes into contact with the molten metal. This “reoxidation”<br />
event is responsible for a large fraction of the inclusions observed in steel castings, inclusions<br />
which are currently the subject of intense research to reduce or eliminate, the so-called clean steel<br />
initiative pursued by the Steel Founders Society of America (SFSA). The direction which has<br />
born the most fruit in this effort has been to be much more careful in handling molten metal so<br />
that there is a minimum of new contact with oxygen. One interesting device in the forefront of<br />
125<br />
Rolling Mill<br />
Ferrite “Bands” in a Pearlitic Matrix<br />
<br />
It is important to point out that most significant rolling<br />
occurs in the austenite range, so that the structures<br />
shown here would appear after the rolling operation.
clean steel technology is the use of the plasma ladle furnace, or PLF, a device illustrated below:<br />
Tightly Sealed<br />
Cover<br />
Plasma Arc<br />
Molten<br />
Slag<br />
Molten<br />
Steel<br />
Refractory<br />
Lining<br />
<br />
<br />
<br />
<br />
<br />
<br />
<br />
<br />
<br />
<br />
<br />
<br />
<br />
Argon Gas Stirring<br />
Argon<br />
Graphite Electrode<br />
Bottom Pour<br />
Stopper Rod<br />
Mechanical Properties of Cast Steel<br />
The mechanical properties of cast steel are determined, like every other material, by the<br />
microstructure of the material and by the extent to which defects or discontinuities are present.<br />
Clearly a steel casting with all kinds of processing defects, i.e. shrinkage porosity, gas porosity,<br />
slag inclusions, sand, oxide entrapment, and other detrimental inclusions will not have optimum<br />
properties. However, because of the remarkable combination of properties that are attainable by<br />
heat treatment and because of the relatively low cost of this material, steel castings will continue<br />
to play a major role in the development of modern society. No other material is quite so friendly<br />
when it comes to fabrication that involves welding. Few other materials can boast of the great<br />
combination of toughness and strength that is attained in steel castings. The biggest competitor for<br />
steel’s markets are steel forgings and ductile iron. Ductile iron has been very successful in replacing<br />
steel in many applications, and austempered ductile iron will continue to put the pressure on<br />
steel castings. Because of the active competition with ductile cast iron the minimum tensile prop-<br />
126<br />
PROCESSING SCHEME<br />
1. Molten Steel transferred from EAF to PLF<br />
2.Electrode strikes arc with molten bath<br />
providing heat for refining operation<br />
3.Argon flowing through electrode forms<br />
and stabilizes the plasma arc<br />
4. Argon introduced through porous plug on<br />
the bottom of the ladle to stir and remove<br />
oxygen from melt (Sievert’s Law)<br />
5. Sulfur is also removed during this stirring<br />
6. Oxygen and sulfur levels < 10ppm<br />
7. Bottom pour direct from refining vessel<br />
8. Tightly sealed cover and argon inflow<br />
keeps air contamination to minimum<br />
9. Net result is cleaner steel<br />
Taken from Modern <strong>Casting</strong> articles by<br />
J. Svoboda and M. L. Philbin
erties attainable in ASTM grades of cast steel are plotted with the ductile iron data below:<br />
Ultimate Tensile and Yield Strength (ksi)<br />
<br />
<br />
<br />
<br />
<br />
<br />
<br />
<br />
<br />
<br />
<br />
<br />
<br />
<br />
<br />
<br />
<br />
<br />
<br />
<br />
<br />
<br />
<br />
<br />
<br />
<br />
<br />
<br />
<br />
<br />
<br />
<br />
4<br />
<br />
<br />
<br />
<br />
<br />
200<br />
A148 Quenched $ TM = Temp Mart<br />
<br />
<br />
Tempered<br />
P = Pearlite<br />
<br />
<br />
<br />
<br />
<br />
<br />
<br />
<br />
<br />
<br />
<br />
<br />
<br />
<br />
<br />
A148 Normalized F = Ferrite <br />
<br />
<br />
<br />
<br />
<br />
<br />
<br />
<br />
<br />
<br />
& Tempered<br />
<br />
ADI <br />
= <br />
Austem. <br />
Duct. <br />
Iron<br />
<br />
<br />
<br />
<br />
<br />
<br />
<br />
<br />
<br />
180<br />
3<br />
<br />
Normalized &<br />
Tempered UTS Yield<br />
<br />
<br />
<br />
<br />
<br />
<br />
(Guaranteed Minimums)<br />
<br />
<br />
<br />
<br />
<br />
<br />
ASTM<br />
<br />
DUCTILE IRONS<br />
<br />
<br />
<br />
<br />
<br />
<br />
<br />
<br />
<br />
<br />
<br />
<br />
160 Grades of ADI<br />
Yield<br />
<br />
<br />
<br />
<br />
<br />
<br />
<br />
<br />
<br />
<br />
<br />
<br />
UTS<br />
<br />
<br />
<br />
<br />
<br />
<br />
(Guaranteed 2<br />
(Guaranteed<br />
<br />
Minimums)<br />
<br />
<br />
<br />
<br />
<br />
Minimums,UTS)<br />
CAST STEEL, ASTM <br />
<br />
Grades<br />
<br />
<br />
<br />
<br />
<br />
<br />
<br />
<br />
<br />
<br />
<br />
<br />
<br />
<br />
<br />
<br />
<br />
<br />
140<br />
<br />
<br />
<br />
<br />
<br />
<br />
<br />
<br />
<br />
<br />
<br />
<br />
<br />
<br />
<br />
<br />
<br />
<br />
<br />
<br />
<br />
<br />
<br />
<br />
<br />
<br />
<br />
<br />
<br />
<br />
<br />
TM<br />
<br />
<br />
120<br />
<br />
<br />
<br />
<br />
<br />
<br />
1<br />
<br />
<br />
<br />
<br />
<br />
<br />
<br />
A148<br />
<br />
<br />
<br />
<br />
<br />
<br />
<br />
<br />
<br />
<br />
<br />
<br />
<br />
<br />
<br />
<br />
<br />
<br />
<br />
<br />
<br />
<br />
<br />
<br />
<br />
<br />
<br />
<br />
<br />
<br />
<br />
<br />
P<br />
<br />
<br />
100 <br />
<br />
<br />
<br />
<br />
<br />
<br />
<br />
<br />
<br />
<br />
<br />
<br />
<br />
<br />
<br />
<br />
<br />
<br />
<br />
<br />
<br />
<br />
<br />
<br />
<br />
<br />
<br />
<br />
<br />
<br />
<br />
<br />
<br />
<br />
<br />
<br />
<br />
<br />
<br />
<br />
<br />
<br />
<br />
<br />
<br />
<br />
<br />
<br />
<br />
<br />
<br />
<br />
<br />
<br />
<br />
<br />
<br />
<br />
<br />
<br />
<br />
<br />
<br />
<br />
<br />
<br />
<br />
<br />
<br />
<br />
<br />
<br />
<br />
<br />
<br />
<br />
<br />
80<br />
P+F<br />
UTS<br />
F+P<br />
F A217<br />
60<br />
Yield<br />
A352<br />
<br />
<br />
<br />
<br />
<br />
<br />
<br />
<br />
<br />
<br />
<br />
<br />
<br />
<br />
<br />
<br />
<br />
<br />
<br />
<br />
<br />
<br />
<br />
<br />
<br />
40<br />
0 2 4 6 8 10 12<br />
Percent Elongation<br />
14 16 18 20 24<br />
UTS v. % Elongation -Summary of Common As-Cast and Austempered Grades of Ductile Iron and Cast Steel<br />
It can be seen in the above summary of tensile data that cast steels as a rule have excellent ductility<br />
for a given strength, in general much higher ductility than ductile cast irons. This is due to the<br />
lack of graphite nodules in steel, which serve as nucleation sites for cracks and voids in ductile<br />
cast iron. It can be seen that the ADI grades are very competitive, however.<br />
It is important to emphasize that for the ASTM grades of steel plotted above, the tensile<br />
data represent minimum values guaranteed, and that maximum values of both ductility and<br />
strength can easily exceed the boundaries of the above scale. For example it is not unusual for<br />
quality steel of lower strength to have tensile ductilities in excess of 40%, and tensile strengths up<br />
to and exceeding 300 ksi are within reach for either higher alloy grades or smaller section sizes of<br />
plain carbon grades which have been quenched and tempered at the appropriate temperatures.<br />
Quenching and Tempering (Q & T) of steel involves the following procedure:<br />
A. Austenitize at Tγ for a period of time to ensure that 100% austenite is produced. This<br />
time will depend upon the section size of the casting and whether or not the casting is put<br />
into a hot furnace or a cold furnace. A hot furnace will accelerate heating so that shorter<br />
austenitizing times can be realized. According to the Steel <strong>Casting</strong>s Handbook of the<br />
SFSA, the most efficient austenitization schedule would involve determining the time<br />
required for the center of the heaviest section to reach Tγ and then adding 15 minutes.<br />
127
Temperature<br />
B. Quench to a temperature below the martensite finish, M F , temperature in a media which<br />
will guarantee that in the center of the heaviest section of the casting the austenite transforms<br />
to martensite, and does not undergo any diffusional transformations to pearlite<br />
(lamellar α + Fe 3 C) or bainite (acicular ferrite with discrete particles of Fe 3 C either within<br />
the ferrite or on the surface of the ferrite). See the schematic ITT diagram below. Alloying<br />
elements such as Mn, Cr, Mo, Ni, V, etc.may be added to increase the hardenability of the<br />
steel (moving the ITT diagram to longer times, thereby effectively buying time) so diffusional<br />
transformation products are avoided during quenching.<br />
C. Heat to a temperature (tempering) to obtain the desired mechanical properties in the<br />
casting. This will usually involve heating in an air furnace for a period of about one hour’s<br />
time. The effect of the tempering process on hardness of a typical Quenched & Tempered<br />
steel is illustrated below:<br />
Isothermal Transformation (ITT) Diagram<br />
<br />
<br />
Austenite<br />
1% Pearlite<br />
99%<br />
Bainite<br />
MS MF <br />
<br />
<br />
<br />
<br />
<br />
<br />
<br />
<br />
<br />
<br />
<br />
<br />
<br />
<br />
<br />
<br />
<br />
<br />
<br />
<br />
<br />
<br />
<br />
<br />
<br />
<br />
<br />
<br />
<br />
<br />
<br />
<br />
<br />
<br />
<br />
<br />
<br />
<br />
<br />
<br />
<br />
<br />
<br />
<br />
<br />
<br />
<br />
<br />
<br />
<br />
<br />
<br />
<br />
<br />
<br />
<br />
<br />
<br />
<br />
<br />
<br />
Hardnesss<br />
<br />
<br />
<br />
<br />
<br />
<br />
<br />
<br />
<br />
<br />
<br />
<br />
<br />
<br />
<br />
<br />
<br />
<br />
<br />
<br />
<br />
<br />
“C”<br />
<br />
<br />
<br />
<br />
<br />
<br />
<br />
<br />
<br />
<br />
<br />
<br />
<br />
<br />
<br />
<br />
<br />
<br />
<br />
<br />
<br />
<br />
<br />
Rockwell<br />
Tγ<br />
Surface<br />
Center<br />
100% Martensite, RC 30 - 65<br />
60<br />
50<br />
40<br />
30<br />
20 <br />
<br />
<br />
<br />
<br />
<br />
<br />
Typical Tempering Curve<br />
Tempering Time, 1 Hour<br />
As - Cast<br />
Hardness<br />
Time<br />
Toughness and Stiffness of Cast Steel and Cast Irons<br />
As indicated above, cast steel is a material with unmatched impact properties. Charpy Vnotched<br />
specimens can have an absorbed impact energy of up to 65 - 70 ft lb, while the best any of<br />
the cast irons can muster is about 10-12 ft lb in malleable iron. The reason for this big difference<br />
is, of course, due to the presence of the graphite. In addition to remarkable toughness, steels are<br />
also selected for duty because of superior stiffness, although not as great a difference is observed<br />
here. Cast steel has a Young’s modulus of about 30 million psi, with ductile iron at about 25 million<br />
psi, and gray iron from about 10 - 20 million psi. Again it is the presence of the graphite in<br />
cast iron which is the reason for their lowered stiffness values in comparison to steel.<br />
Weldability of Cast Steels and Cast Irons<br />
Weldability refers to the ease with which the joining process of welding (which involves<br />
local melting of the material to be welded) is accomplished. Welding processes are generally utilized<br />
to repair surface defects in castings and to join the casting to another part in a fabrication<br />
process. It is generally true that cast steels are considered quite weldable and cast irons are welded<br />
with some difficulty. Cast steels are selected quite often for specific applications because they can<br />
be easily joined, producing weld joints with properties equivalent to the base material. On the<br />
other hand, cast irons are never selected because of their ability to be joined. Welding processes in<br />
cast iron are almost always done to repair a defective casting or to cosmetically cover up some<br />
gross surface defect. The reason why steels are weldable and cast irons are mostly not weldable<br />
128<br />
0<br />
Tempering Temperature ( o <br />
<br />
<br />
<br />
<br />
<br />
<br />
<br />
<br />
<br />
<br />
<br />
400 800 1200<br />
F)
esult from the response of each of these materials to the melting, rapid solidification, and rapid<br />
cooling in the solid state that is characteristic of the welding process. The thermal and the physical<br />
nature of weldments are described below:<br />
Temperature<br />
Heating and Cooling Curves during Welding<br />
T<br />
<br />
<br />
<br />
Melting Temp<br />
m<br />
<br />
<br />
<br />
<br />
<br />
<br />
T <br />
E<br />
Eutectoid Temp<br />
Time<br />
Application of a weld bead to the surface of either cast iron or steel would result in local melting,<br />
creation of a weld bead, and local heating near the weld bead where the temperature will have<br />
entered the austenitization range. Rapid cooling would follow after the heating, a period of time<br />
when the weld metal would solidify and the austenite in the HAZ would transform to martensite<br />
or some form of α + Fe 3 C (pearlite, bainite, etc.).Typical scenarios for each material are given:<br />
Steel Weld <strong>Metal</strong> -> austenite -> α + Fe 3 C or martensite<br />
HAZ -> austenite -> α + Fe 3 C or martensite<br />
Cast Iron Weld <strong>Metal</strong> -> Eutectic Fe 3 C + γ; and then γ −> α + Fe 3 C or martensite<br />
HAZ -> austenite -> α + Fe 3 C or martensite<br />
The most desirable structure to have throughout the weld bead and HAZ after welding would be a<br />
continuous matrix of ferrite with an even distribution of Fe 3 C. Creation of martensite in either the<br />
weld bead or the HAZ is not desirable because of the brittle nature of this austenite decomposition<br />
product. Minimizing the carbon content and alloy content of the material to be welded makes it<br />
likely that no martensite would form, a characteristic of low alloy plain carbon steels. These steels<br />
make up the bulk of steel castings produced and are therefore highly weldable. Cast irons, on the<br />
other hand have two strikes against them in this welding process. First, the rapidly cooling molten<br />
iron weld bead is likely to solidify with the formation of the continuous iron carbide eutectic, the<br />
hard and brittle white iron that gray and ductile iron processing so studiously avoids by proper<br />
inoculation. Secondly the matrix carbon contents of cast irons are almost always greater than 0.6<br />
wt %, making it very likely that the HAZ would transform to the hard, brittle martensite. Both the<br />
eutectic carbide and the martensite are very detrimental to production of a successful weldment.<br />
The problem of eutectic carbide formation in cast iron weldments have been solved by proper<br />
choice of electrode material; high nickel alloys have been used successfully. Unfortunately these<br />
alloys are expensive. The problem of martensite formation in the HAZ and the weld bead can be<br />
dealt with by proper preheating and postheating schemes. However, these too are costly and cannot<br />
always be done conveniently. It is clear therefore that cast steel is a much more friendly material<br />
when it comes to welding than cast iron.<br />
129<br />
Weld <strong>Metal</strong><br />
Heat Affected Zone (HAZ)<br />
<br />
<br />
<br />
<br />
<br />
Base <strong>Metal</strong> (Steel or Iron) with Weld Bead
Surface Hardening of Steel and Iron <strong>Casting</strong>s by Selective Heat Treatment<br />
There are many applications of steel and iron castings in which the desired properties are<br />
achieved by selective heat treatment of surfaces, a process in which a thin surface layer is austenitized<br />
very quickly followed by a rapid quenching action in which the austenite is allowed to<br />
transform to martensite or some other combination of phases. The objective is usually to produce<br />
a very hard, wear resistant surface while retaining a tough ductile core. Success in these processes<br />
requires that the starting microstructure be of a type (pearlite, bainite, tempered martensite) which<br />
will respond to the austenitizing treatment in the short time available. All of these structures have<br />
very small iron carbide particles in a matrix of ferrite, a combination which is amenable to austenitization<br />
in short times because of the small diffusion distances requiredto allow the austenite to<br />
form. Processes which commonly are used to create these kinds of structures include induction<br />
hardening, flame hardening and laser hardening. Details of these treatments are given in many<br />
texts on heat treatment. A surface treatment process is illustrated here for surface hardening of a<br />
camshaft similar to those used on automobiles. In the diagram below, the conventionally surface<br />
hardened cam lobe is illustrated on the right, and the surface austempered lobe is shown on the<br />
left. The conventional treatment results in the production of martensite as-quenched which is sub-<br />
1. Cam Lobe Surface<br />
Heated to 1600 o F<br />
to a depth of 0.12 in.<br />
2. Austenite Quenched<br />
in Salt Bath at 650 o F<br />
and held for time needed<br />
to form 100% Ausferrite<br />
in 0.12 in. layer.<br />
Ausferrite<br />
Layer<br />
Austempered Conventional<br />
(Cast Iron) (Cast Iron or Steel)<br />
Cam<br />
Lobes<br />
Camshaft<br />
sequently tempered to the necessary hardness, a treatment which can be performed on both cast<br />
irons and steels. Surface austempering to produce an ausferrite structure can only be done with<br />
cast irons. It has been observed that these surface ausferrite structures wear as well or better than<br />
the tempered martensite, the austenite matrix transforming to a hard, durable martensite in service.<br />
130<br />
Tem. Mart.<br />
Layer<br />
1. Cam Lobe Surface<br />
Heated to 1600 o F<br />
to a depth of 0.12 in.<br />
2. Austenite Quenched<br />
in water to form<br />
100% Martensite in<br />
0.12 in. layer.<br />
3. Tempered at 400 o F<br />
to retain 55R C for<br />
Wear Resistance
XVII. Cast Copper Alloys<br />
Cast copper alloys have a broad range of application, used in every market category from<br />
plumbing to precision electronic components to marine and nuclear equipment. Cast copper<br />
alloys are selected most often for their excellent corrosion resistance, favorable mechanical properties,<br />
good friction and wear properties, bifouling resistance (inhibiting marine organisms from<br />
attaching themselves to submerged surfaces), high electrical and thermal conductivity, good<br />
castability and excellent machinability and fabricability.<br />
Like other cast materials, solidification of copper based alloys usually takes place by<br />
nucleation and growth of dendrites of a copper-rich face centered cubic solid solution in which<br />
all of the problems associated with dendritic growth can and will occur. These problems include<br />
microsegregation of alloying elements within the dendrites producing cored structures, entrapment<br />
of solidification shrinkage and gas porosity in between dendrite arms, and the presence of<br />
complex interdendritic phases. In addition, like the transformations that occur in aluminum and<br />
ferrous alloys, solid state phase transformations such as eutectoid transformations, martensitic<br />
transformations and precipitation hardening are all possible in these materials. It is beyond the<br />
scope of these notes to discuss all of the possibilities that exist in the production of castings of<br />
copper base alloys. It is useful, however, to provide a more detailed look at casting of a Cu - Sn-<br />
Ni alloy, a material which has potential for excellent wear resistance and strength. The appropriate<br />
phase diagram is a ternary in which the Ni is completely soluble in the Cu in the solid state and<br />
the Sn is soluble up to about 13 wt. % in the solid state.Schematic phase diagrams of the Cu - Ni<br />
and Cu-Sn systems are given below:<br />
Temperature<br />
<br />
<br />
<br />
<br />
<br />
<br />
<br />
<br />
<br />
<br />
<br />
<br />
1083 o <br />
<br />
<br />
C<br />
<br />
<br />
<br />
<br />
<br />
<br />
<br />
<br />
<br />
<br />
<br />
<br />
<br />
Liquid<br />
α<br />
<br />
<br />
<br />
<br />
<br />
<br />
<br />
<br />
5<br />
Cu<br />
C’ C0 Wt. Percent Nickel<br />
C”<br />
Ni<br />
1083 o C<br />
<br />
<br />
α + L<br />
1455 o <br />
<br />
C<br />
Consider an alloy with 10 wt. pct. Sn and 5 wt. Pct Ni. Examination of the binary phase<br />
diagrams above shows the complete solubility of Ni in Cu in the solid solution α, and the solubility<br />
of about 13 % Sn also in α. The Cu - Ni phase diagram contains a miscibility gap at low temperatures,<br />
where the single phase α solid solution of composition C 0 will separate into two α<br />
phases α’ + α” of composition C’ and C” respectively at temperature T 1 , phases with the identical<br />
crystal structure of the parent α but with different compositions as dictated by the tie lines on the<br />
phase diagram. It can also be seen that the Cu - Sn phase diagram is quite complex, with a number<br />
of intermetallic phases present in equilibrium with α between melting and room temperature. It<br />
can also be seen that the equilibrium distribution coefficients of Ni in Cu and Sn in Cu are of<br />
131<br />
Temperature<br />
<br />
13.5<br />
<br />
<br />
<br />
<br />
<br />
kNi = 1.8 kSn = 0.15<br />
α + β β<br />
α<br />
322 o C<br />
<br />
<br />
<br />
<br />
<br />
<br />
<br />
<br />
α' + α”<br />
T 1<br />
<br />
<br />
<br />
<br />
Cu 10<br />
Wt. Percent Tin<br />
L<br />
α + γ<br />
α + δ<br />
α + ε
opposite sign. The Ni atoms segregate negatively, that is there will be more Ni in the first to freeze<br />
(FTF) part of the dendrite than at the edge of the dendrite, the last to freeze (LTF) volume; on the<br />
other hand Sn atoms segregate positively, with less Sn in the FTF than in the LTF. Thus a composition<br />
profile across the α dendrite in such an alloy would have the general appearance as is<br />
shown in the sketch below:<br />
Weight Pct Alloy<br />
<br />
<br />
<br />
<br />
12<br />
<br />
<br />
<br />
<br />
10 <br />
<br />
8<br />
6<br />
4<br />
2<br />
<br />
<br />
<br />
<br />
<br />
Nickel<br />
<br />
<br />
<br />
<br />
<br />
<br />
<br />
<br />
<br />
<br />
<br />
<br />
<br />
Tin<br />
<br />
<br />
<br />
<br />
<br />
0<br />
0<br />
1<br />
FTF<br />
Wt. Fraction Solidified<br />
LTF<br />
The above schematic is not quite accurate because in a 10 percent Sn alloy there will be a significant<br />
amount of the interdendritic δ phase which results from the non-equilibrium coring during<br />
solidification. This interdendritic phase is a rather hard intermetallic compound which will contribute<br />
to the wear resistance of the casting; binary alloys of 10% Sn are used in gear applications<br />
where good sliding wear resistance is necessary, wear resistance provided in large measure by the<br />
interdendritic δ. The rather high level of Ni within the dendrite promotes a certain amount of solid<br />
solution strengthening of the dendrite, but has the added potential for contributing much more<br />
strengthening to this material by precipitation hardening. This hardening is accomplished through<br />
formation of the coherent a’ + a” phases on aging the casting at low temperatures. These phases<br />
are illustrated on the phase diagram on page 128, but form in a manner quite different than a normal<br />
nucleation and growth process. Instead of the precipitates nucleating and growing individually<br />
the α’ + α” phases grow as composition waves within the structure as illustrated below:<br />
<br />
<br />
Wt. Pct Ni<br />
In this transformation (sometimes called spinodal decomposition) a random composition variation<br />
of composition C 0 at time t 0 will spontaneously increase in amplitude (composition) with<br />
132<br />
<br />
<br />
<br />
<br />
<br />
<br />
C”<br />
<br />
<br />
<br />
<br />
<br />
<br />
<br />
<br />
t<br />
t 3<br />
2<br />
<br />
<br />
<br />
<br />
<br />
<br />
<br />
<br />
<br />
<br />
<br />
<br />
<br />
<br />
<br />
<br />
t1 <br />
<br />
<br />
<br />
<br />
<br />
<br />
<br />
<br />
<br />
C <br />
0<br />
t0 <br />
<br />
<br />
<br />
<br />
<br />
<br />
<br />
<br />
<br />
<br />
<br />
<br />
<br />
<br />
<br />
<br />
<br />
C’<br />
<br />
<br />
<br />
Distance x<br />
α”<br />
α’
aging time until the composition limits C’ and C” are reached by the composition wave. This<br />
composition variation creates barriers to defect motion and therefore strengthens the matrix.<br />
An age hardening response for an alloy containing 10.5 Sn and 4.4 Ni in the as - cast condition is<br />
shown in the figure below:<br />
220<br />
200<br />
180<br />
160<br />
140<br />
120<br />
350 o C<br />
425 o C<br />
0 4 8 12 16 20 24 28 32<br />
Aging Time (Hours)<br />
Aging Response of an As-Cast Cu - 10.5 Sn - 4.4 Ni Alloy<br />
(Split Cast Iron Mold, 1 in.Plate)<br />
It should be noticed that the hardness increase on aging was much greater at 350 o C than at 425 o C,<br />
a consequence of the larger composition difference (C” - C’) at 350 than at 425 o C. See the phase<br />
diagram on pg. 128 to appreciate how this difference increases with decreasing temperature. This<br />
increase in hardness resulted in significant increases in tensile strength as well. These results are<br />
133
illustrated in the Figure below for specimens aged at 350 o C.<br />
70<br />
60<br />
50<br />
40<br />
30<br />
20<br />
As-Cast &Aged<br />
350C, 8 Hr<br />
Yield<br />
UTS<br />
As-Cast<br />
& Aged<br />
350C<br />
4.5 Hr<br />
0 10 20 30 40 50 60<br />
Percent Elongation<br />
This figure also illustrates the large gain in elongation following solution treatment at 780 o C, a<br />
process whereby most of the Ni and Sn available for precipitation were put back into solution. It is<br />
interesting to note that the yield, a parameter which is very dependent on the microstructure of the<br />
matrix, is much more sensitive to aging than the UTS.<br />
XVIII. Homogenization of <strong>Casting</strong>s<br />
Most alloy castings have significant segregation present in the as-cast structure, a result<br />
which is usually detrimental to the mechanical properties of the casting. This segregation can take<br />
the form of gradients in composition across dendrites or as interdendritic phases which would not<br />
be present at equilibrium. Removal or elimination of this segregation requires heating to temperatures<br />
near the melting point and holding for a period of time sufficient to allow diffusion of the<br />
atomic species involved. Singh and Flemings have analyzed the kinetics of homogenization in<br />
cast Al - Cu alloys, alloys in which both Cu gradients and the non-equilibrium interdendritic θ<br />
phase is present. A part of the Al - Cu phase diagram, microstructure and expected Cu gradient for<br />
134<br />
Creating<br />
New Ppts<br />
As<br />
Cast<br />
As-Cast Ppts<br />
into Solution<br />
Solution<br />
Treated<br />
780C,8 Hr<br />
Variation of Tensile Properties of Cast 10.5 Sn - 4.4 Ni alloy with Heat Treatment
an Al - 4.5 % Cu alloy are given in the sketch below:<br />
Dendrite Center Interdendritic<br />
Cu -rich θ Phase<br />
Microprobe Line Scan Position across Dendrite<br />
53.5 Wt % Cu<br />
53.5<br />
5.65<br />
C0 = 4.5<br />
kC0 = 0.77<br />
0<br />
Maximum Solubility of Cu<br />
Distance<br />
It can be seen in the above sketch of the Cu concentration vs. distance that a significant fraction of<br />
Cu is present as the θ phase; an eyeball estimate of the average concentration of Cu in the dendrite<br />
is about 1.5 %. Thus the θ phase must contain about 3 % (4.5 - 1.5) of the Cu; this translates to<br />
about 6 wt % of the interdendritic q phase in the as-cast condition in an alloy in which the equilibrium<br />
structure would contain none of the θ phase after solidification is complete (see diagram<br />
above). The primary reason why Cu is added to Al is to take advantage of the potential for age<br />
hardening the matrix a phase (this is the basis for the development of the 2000 series wrought aluminum<br />
alloys). Unfortunately for the cast alloy, as is seen in the above sketch, most of the Cu is<br />
not available on direct aging for the generation of precipitates. Thus it becomes necessary to<br />
homogenize (or solutionize) the cast material, to put the Cu atoms into solution in the aluminum<br />
rich matrix (dissolve the θ phase particles) so that then the alloy can be heat treated to take advantage<br />
of the Cu that is present.<br />
Singh and Flemings showed that the rate at which the θ phase would dissolve into the a<br />
phase is a function of the diffusion coefficient of Cu in the Matrix, D Cu , and the secondary dendrite<br />
arm spacing, d. Their expression for the variation of the volume fraction of the θ phase, X θ ,<br />
with time at temperature is given by:<br />
X θ = X θo exp - [π 2 Dt / d 2 ]<br />
where:<br />
X θo = Volume fraction of θ in as-cast condition,<br />
t = time.<br />
Heat treatment to homogenize requires that the casting be heated up into the single phase α field,<br />
to a temperature range of about 520 to 570 o C. It can be seen in the above equation that the value<br />
of X θ will decrease with time in an exponential fashion until (at an infinite time) all of the interdendritic<br />
phase will be dissolved into the dendritic matrix. Clearly this is not practically acceptable;<br />
rather it is necessary only to put most of the Cu into solution in the dendrites. Assuming that<br />
95 percent of the θ phase is an acceptable amount to be dissolved into the matrix α gives an<br />
expression for the time for homogenization, t H of:<br />
135<br />
Center of<br />
Interdendritic<br />
θ Phase<br />
α L<br />
α + θ<br />
Al 33<br />
4.5 Wt.% Cu<br />
θ<br />
53.5
tH = - ln [ 0.05 d 2 ] / π 2 DCu or<br />
tH ~ d 2 / 2DCu For Al - Cu alloys, DCu = 0.29 exp [- 15662 / T], ( cm2 / sec), where T is the absolute temperature<br />
in oK. Thus realistic times for homogenization depend strongly on T and d, the dendrite arm spacing.<br />
Secondary dendrite arm spacing measurements have been made on a wide variety of aluminum<br />
alloy castings, measurement which are summarized in the figure below:<br />
1000<br />
100<br />
10<br />
1<br />
0.1<br />
0.01<br />
Ingot <strong>Casting</strong><br />
MY 423<br />
Lab<br />
Sand <strong>Casting</strong><br />
Die <strong>Casting</strong><br />
Gas Atomiz.<br />
10 -2 1 100 10 4 10 6<br />
Cooling Rate (C o / sec)<br />
Clearly the SDAS measurements made in the MY 423 laboratory include a small part of the very<br />
broad range of SDAS values obtainable in industrial processes. The production of semi continuous<br />
cast ingots for breakdown into sheet and plate gives the largest SDAS while rapid solidification<br />
by splat quenching or in the production of thin ribbons of alloy gives the smallest values of<br />
SDAS. Of course, most of the alloys produced are in the range of the larger SDAS. Obviously the<br />
homogenization time of these materials is going to be very different depending upon the type of<br />
cast product. Smaller values of d will require shorter times. The relationship between t H , T, and<br />
136<br />
Water Atomiz.<br />
Laser Skin Melting<br />
Splat Quenching<br />
10 8
SDAS, d, is summarized in the Figure below:<br />
10 7<br />
10 6<br />
10 5<br />
10 4<br />
10 3<br />
10 2<br />
10<br />
1<br />
10 -1<br />
10 -2<br />
10 -3<br />
0.01<br />
One Week<br />
One Day<br />
One Hour<br />
One Minute<br />
0.1<br />
450 o C 500 o C<br />
1 10 100 1000<br />
Secondary Dendrite Arm Spacing, d (Microns)<br />
It can be seen in this figure that homogenization of large ingots take on the order of days to successfully<br />
dissolve the interdendritic phases, where atomized powders require times that are insignificant.<br />
Certainly the homogenization cost can be reduced if effort is taken to reduce SDAS by<br />
increasing the cooling rate. Thus there is a large driving force to produce continuous cast strip on<br />
the order of a few centimeters thick. This would reduce energy costs to homogenize as well as to<br />
break down by rolling. This is the direction that nonferrous metals is taking, following the continuous<br />
casting example set in steel, where it is currently possible to continuously cast strip on the<br />
order of inches in thickness.<br />
It should be mentioned that the above relationship for t H is generally usable with other<br />
castings as well, plugging in the appropriate diffusion coefficients. This “rule of thumb” relation-<br />
137<br />
550 o C<br />
ATOMIZA TION<br />
DIE & SAND CASTING<br />
INGOTS
ship applies even though there may be no significant interdendritic phase, for situations in which<br />
there are only composition variations from inside the dendites to outside of the dendrites. A<br />
selected group of diffusion coefficient data is given in Table 12:<br />
Table 12: Selected Diffusion Coefficients in Al, Cu and Fe<br />
D = D 0 exp [-Q/RT], (cm 2 / sec)<br />
Matrix Solute D 0 Q/R( o K)<br />
Al Cu 0.29 15662<br />
Al Mg 4.4 16859<br />
Al Li 4.5 16759<br />
Cu Ni 1.4 27428<br />
Cu Sn 0.027 18762<br />
Cu Zn 0.083 (for 10% Zn) 19879<br />
Fe, In Austenite Mn 0.055 29995<br />
Fe, In Austenite Mo 0.068 29693<br />
Fe, In Austenite Ni 0.344 32964<br />
Fe, In Austenite N 0.91 20262<br />
Fe, In Austenite C 16.2 16575<br />
Fe, In Austenite Si (0 -2%) D Si = 4 x 10 -10 (1206 o C), 1.7 x 10 -9 (1293 o C)<br />
Fe, In Austenite Cu 3.6 32964<br />
Data from Smithell’s <strong>Metal</strong> Reference Book; Shewmon’s Text, Diffusion in Solids<br />
Problem: A ductile cast iron with a nominal composition 3.7 C, 1.99 Si, 0.29 Mn, 0.18 Mo, 1.33<br />
Ni, 0.77 Cu, 0.052 Mg was produced at MTU and cast into sand molds (4 inch Y-Block). The elements<br />
Si, Ni, and Cu segregate negatively (high concentration in the center of the dendrites and<br />
near the nodules[FTF], while Mn and Mo segregate positively (high concentrations in the interdendritic<br />
regions [LTF]). The extremes in concentration observed in this alloy is given in the table<br />
below:<br />
Table 13:<br />
Location Si Ni Cu Mn Mo<br />
FTF 2.9 1.65 1.55 0.2 0.05<br />
LTF 1.0 0.65 0.3 1.1 1.7<br />
138
The SDAS observed in this heavy section casting was in the range of 200 microns (0.02 cm).<br />
Show that homogenization of this alloy is not practical (Tm = 1150 o C).<br />
XIX. Environmental Concerns in <strong>Metal</strong> <strong>Casting</strong><br />
Product Life Cycle and the Environmental Concern Envelope<br />
Everything material has a life cycle, which means there is a birth, a useful life, and a death. Obviously<br />
the most desirable situation is one in which the useful life is infinite. Of course this is purely<br />
wishful thinking because of wear, corrosion, and obsolescence. A Product Life Cycle begins<br />
when raw materials are brought together for the purpose of producing or manufacturing a specific<br />
product for consumption by the public. In the past the product life cycle ended when the specific<br />
product reached the end of its useful life. A general schematic of this process for a system in<br />
which there was no closure (including mining) is given below.<br />
Landfill<br />
Product Life Cycle, No Closure<br />
Resource<br />
Extraction<br />
Product<br />
Disposal<br />
In this modern age of environmental concern, the product life cycle has been modified to include<br />
closure of the life cycle and to reflect the concern for the environmental “cost” of producing and<br />
using the product. This “cost” includes an awareness , both qualitative and quantitative, of the<br />
energy and material inputs and outputs during the process of producing the product. The Product<br />
Life Cycle indicated above has been updated to reflect the Environmental Cost in the figure on<br />
page 137. In this Figure the several options of Life Cycle Closure (Recycling, Remanufacturing<br />
or Reusing) are included together with the introduction of the Environmental Concern Envelope.<br />
This envelope emphasizes the material and energy inputs and the solid, liquid, and gaseous out-<br />
139<br />
Product<br />
Manufacturing<br />
Product<br />
Use<br />
Packaging<br />
& Transport
puts resulting from processes throughout the cycle.<br />
Product Life Cycle,ENVIRONMENTAL CONCERN ENVELOPE<br />
Landfill<br />
SOLID WASTE BURDEN<br />
Resource<br />
Extraction<br />
Recycling<br />
Product<br />
Disposal<br />
Product<br />
Manufacturing<br />
Reuse or<br />
Remanufacturing<br />
The primary difference in the product life cycles as depicted by these figures is the closure<br />
through recycling, reuse, or remanufacturing shown above. The driving force for closure is clearly<br />
a combination of the desire by manufacturing centers to reduce their costs to produce the product,<br />
together with the need to comply with existing and future environmental regulation. It will be the<br />
responsibility of the designer of the future to consider the environmental envelope at the beginning<br />
of the product life cycle, to minimize the impact of the product manufacturing and use on the<br />
environment by minimizing energy and material requirements and minimizing deleterious material<br />
outputs. Obviously the goal of the designer will be to produce a product with zero negative<br />
discharges, to select and help design products and processes which generate useful byproducts<br />
instead of outputs which will materially harm the environment.<br />
Product Life, Dissipation of Mass<br />
The second law of thermodynamics, with its requirement that entropy increases (that randomness<br />
prevails) can be demonstrated by a critical look at the fate of products. In a discussion of product<br />
140<br />
Packaging<br />
& Transport<br />
Product<br />
Use<br />
AIR AND WATER POLLUTION
life cycles, it is useful to look at whether or not product matter is dissipated during the lifetime of<br />
the product and/or after it has ceased to be useful. In this discussion, dissipation implies loss of<br />
mass external to the product. A schematic product life—dissipation diagram,shown below, illustrates<br />
product use on a scale from “dissipative” to “non-dissipative.” This figure shows that<br />
highly dissipative products are those which are usually produced for their controlled chemical<br />
reactions (gasoline, blast furnace coke, explosives, fertilizer, pesticides), while non-dissipative<br />
products are most often produced for their electronic or electrical properties (TVs, computers,<br />
batteries). In the former, the reaction products are invariably dissipated to the environment and<br />
cannot be conveniently recovered. In the latter, the product does not dissipate matter to its surroundings<br />
but ceases to be useful by obsolescence, by nonreversible chemical reactions, or by<br />
internal mass flow. In many of these instances, it is interesting to note that product function<br />
ceases by atomic dissipation (diffusion) within the product and not by dissipation to the environment.<br />
The “in between” products shown below invariably have a component of mechanical or<br />
chemical use in which dissipation of matter can occur to different degrees depending upon the<br />
product. This is illustrated by automotive parts which move against other parts and lose mass by<br />
wear, and by auto body parts which corrode. If there is enough wear or corrosion, the part will<br />
eventually cease to function and will require replacement or repair.<br />
Product Life - Dissipation Diagram<br />
Dissipative Use<br />
Products<br />
Useful Product Life<br />
Decreasing Tendency to Dissipate<br />
Increasing Tendency to Dissipate<br />
Chemical Uses Mechanical Uses<br />
Material Flow in a <strong>Metal</strong> <strong>Casting</strong> Facility<br />
The majority of metal castings produced in the world are made by pouring molten metal into a<br />
sand mold made of sand grains (Usually Silica, SiO 2 ) which are bound together by a variety of<br />
binder materials including clay-water and a large variety of organic and inorganic chemicals.<br />
These kinds of manufacturing facilities, like most manufacturing facilities, experience large<br />
quantities of materials moving in response to the needs of the process. <strong>Metal</strong> movement occurs<br />
in the solid and liquid state, sand in huge quantities (sand / metal ratios of 3-10) are needed to<br />
make the molds, air flow is required to move and remove combustion products, water is needed<br />
141<br />
Non-Dissipative Use<br />
Electronic or<br />
Electrical Uses<br />
Gasoline<br />
Coke<br />
Automobile Brake Pads<br />
Automobile Disc Brake Rotors<br />
Televisions<br />
Computers<br />
Explosives<br />
Fertilizers<br />
Internal Combustion Engines<br />
Automobile Bodies<br />
Batteries<br />
Copper Cable<br />
Pesticides<br />
Foundry Sand<br />
Beverage Cans<br />
NOT RECYCLABLE GENERALLY RECYCLABLE
for cooling and scrubbing air, and chemicals are sometimes necessary to bind sand grains and create<br />
metal penetration resistant layers. This dynamic flow situation is illustrated schematically<br />
below, a flow diagram which is representative of a foundry of 1950. In this schematic the solids<br />
To Scrapyard<br />
Disposal in Land• ll<br />
SCRAP<br />
METAL<br />
[IN]<br />
Consumer<br />
FOUNDRY<br />
BOUNDARY<br />
AIR<br />
[IN]<br />
CASTING<br />
<strong>Metal</strong><br />
Returns<br />
WATER [IN]<br />
Schematic Material Flow in Foundry, A D 1950<br />
are depicted as entering the casting process from right and left, the water enters from the bottom,<br />
and the air enters from the top. All material input is focussed upon the casting process in the center<br />
of the figure. Note that in 1950 the only recycled material was the metal, the remaining solid,<br />
liquid and gas being dispensable. As a result of environmental, financial, and social pressures, the<br />
foundry industry, like most other American industry has responded by paying much more attention<br />
to the flow of materials, other than the metals which make up their product, into and out of<br />
their manufacturing centers. Those materials, gases, solids, and liquids, which are absolutely necessary<br />
in the process of producing the product but don’t appear in the product are also very important<br />
This concern is illustrated schematically in the figure on page 140, a schematic flow diagram<br />
for a typical foundry in the year 2000, in which solid, liquid and gaseous waste problems are<br />
142<br />
DUST<br />
CHEMICALS<br />
AIR<br />
[OUT]<br />
Reprocessed<br />
Sand<br />
SLUDGE<br />
CHEMICALS<br />
WATER<br />
OTHER CHEMICALS<br />
BINDERS<br />
SAND<br />
[IN]<br />
SPENT SAND<br />
[TO LANDFILL]<br />
[OUT]
eing addressed by attempts to “close the loops” with appropriate technology.<br />
To Disassembly<br />
for Remanufacture<br />
Recycle or Reuse<br />
FOUNDRY<br />
BOUNDARY<br />
Consumer<br />
SCRAP METAL<br />
[IN]<br />
CASTING<br />
WATER<br />
[IN]<br />
AIR<br />
[IN]<br />
<strong>Metal</strong><br />
Returns<br />
Material Flow in a Foundry in AD 2000<br />
It can be seen that the solid, liquid, and gas loops have been closed by the incorporation of<br />
devices for scrubbing and cleaning the air and water, and by sand reclamation devices which will<br />
scrub the sand grains for reuse. These efforts to control material flow into and out of metal casting<br />
plants have been made in response to the need to improve the environment of people. Environmental<br />
specialists within the industry respond to health concerns related to the industrial output of<br />
solids, liquids, and gases affecting workers (close proximity to the industrial output), affecting<br />
near neighbors (within a few blocks of the industrial setting), and all residents on earth (green<br />
house gas emission, acid rain, etc.).<br />
Spent Molding Media<br />
The greatest fraction of castings produced are made in molds in which an aggregate of some<br />
refractory material is used as molding media, most often silica sand. As described earlier in these<br />
notes, the process of making molds requires a pattern around which sand with an appropriate<br />
bonding medium is packed. The pattern is removed, leaving a cavity in the sand into which molten<br />
metal is poured. As indicated previously, bonding media vary from clay + H 2 O to complex<br />
organic resins which, as a result of the heat from the liquid metal, burn and produce a residual<br />
143<br />
AIR<br />
[OUT]<br />
Air Treatment<br />
Baghouse<br />
Reprocessed<br />
Sand<br />
Water<br />
Treatment<br />
OTHER CHEMICALS<br />
BINDERS<br />
SAND<br />
[IN]<br />
WATER<br />
[RECIRCULATED]<br />
Waste for<br />
Disposal<br />
Sand<br />
Reclamation<br />
SPENT SAND<br />
Dust<br />
Sludge<br />
Byproduct<br />
from Dust
coating on the sand grain surfaces. This new carbon-containing surface results in difficulty in<br />
rebonding the shakeout sand. As a result, a significant amount of this “spent sand” is disposed of<br />
in landfills (1 million tons per year in Michigan and 15 million tons in the U.S., 1990 estimate).<br />
The figure below is a schematic flow diagram for sand in a typical green sand (clay-water bond)<br />
foundry. This figure shows that after the casting operation the shakeout sand is divided into two<br />
components. The major component is reused for making new molds (reconditioned sand), while<br />
the minor component is treated as waste, screened fines and lumps created by the contact with<br />
high temperatures.<br />
Add Water<br />
and clay<br />
Reconditioned<br />
Sand<br />
Add Water<br />
and clay<br />
Mining of Sand<br />
Dunes and Old Lake Beds<br />
Washing, Screening,<br />
and Sizing<br />
Molding Sand Core Sand<br />
Production of<br />
Molds and Cores<br />
Pouring of<br />
Molten <strong>Metal</strong> into<br />
Sand Molds<br />
Separation of <strong>Casting</strong>s<br />
from Sand<br />
[SHAKEOUT]<br />
Shakeout Sand<br />
1. Sand Unaffected by Heat<br />
2. Heat Afected Sand (Lumps, Fines)<br />
RECLAMATION<br />
Mechanical and Thermal<br />
Scrubbing of Sand Grains<br />
Fines<br />
There are opportunities available for sand (lumps and fines shown above) which is no longer satisfactory<br />
for direct use in molding, including:<br />
A. Subjecting the sand grains to a cleaning process whereby the interfering layer is removed<br />
144<br />
Bonding Media<br />
CASTINGS<br />
Screened Lumps &<br />
Fines Removal<br />
To Landfill<br />
or Alternate Use
so that the grains can be used again as molding medium. These cleaning processes are generically<br />
called reclamation and are shown closing the product cycle in the above sketch. This process is an<br />
expensive addition to the foundry handling system and has been discussed in some detail on pages<br />
64 - 67 of these notes.<br />
B. Using the sand grains (lumps and fines) for an alternate use, some of which are:<br />
1. Aggregate in asphalt<br />
2. Aggregate in concrete<br />
3. Charge stock in a cement kiln<br />
4. Charge stock in glass making<br />
5. Daily cover in a landfill<br />
Option A is not currently in wide use in the State of Michigan because for many foundries it is not<br />
yet cost effective; i.e., the cost of landfilling is still not high enough to offset the increased capital<br />
cost requirement to clean these grains. However, the rate of increase in the cost of disposal is<br />
large, and it is simply a matter of time before Option A will become attractive and become a part<br />
or the sand system in each foundry. Option B is in its beginning stage, with B1, B3 and B5 currently<br />
in process in several locations in this country. Which option each foundry uses will depend<br />
upon its own unique circumstances.<br />
Environmental Concern of <strong>Metal</strong> <strong>Casting</strong> Facilities.<br />
<strong>Metal</strong> casting facilities have long been known as “recyclers” because of their basic function<br />
of taking scrap metal and turning it into useful products. Unfortunately, because of the other<br />
material needs of these processes which are described above, metal casting facilities had also<br />
earned the reputation of being very dirty places to work at or live near. This reputation has<br />
changed, however, with governmental pressure responding to peoples’ physical and health needs<br />
as well as the drive for environmental responsibility on the part of industry. As a result of these<br />
pressures, significant federal legislation has been passed which has been directed at forcing closure<br />
of the above loops illustrated on page 140, legislation dealing with clean water, clean air, and<br />
the generation and disposal of solid waste, both hazardous and non-hazardous. A partial summary<br />
of the most significant of these legislations is given below:<br />
1963 - Clean Air Act (CAA)<br />
1965 - Solid Waste Disposal Act - First Law dealing with safe disposal of household,<br />
municipal, commercial and industrial waste.<br />
1970 - Resource Recovery Act<br />
1970 - Clean Air Act (CAA), Amendments to CAA, Most of Basic Structure of CAA<br />
were established in these amendments - Emission Standards for industrial<br />
plants and automobiles.<br />
1970 - Clean Water Act (CWA)<br />
1976 - Resource Conservation and Recovery Act (RCRA) - regulates generation, storage,<br />
transportation, treatment and disposal of hazardous waste<br />
1977 - Clean Air Act, Amendments to CAA<br />
1977 - Clean Water Act, Requires at least secondary treatment of all publicly owned treatment<br />
works, stipulating that such facilities provide at least 85% BOD (biochemical<br />
oxygen demand) removal.<br />
1980 - Comprehensive Environmental Response, Compensation and Liability Act (CER-<br />
CLA) , Requires Cleanup of sites which pose a threat to human health or<br />
145
the environment (Superfund), Amendment to RCRA<br />
1984 - Hazardous and Solid Waste Amendments, Amendment to RCRA<br />
1986 - Superfund Amendments and Reauthorization Acts (SARA)<br />
1990 - Clean Air Act Amendments (Goal to reduce air pollution by 90% by year 2000)<br />
EPA (Environmental Protection Agency) Identified Iron and Steel Foundries<br />
as potential major source categories of acrolein, benzene, Cr, Co, Pb,<br />
Mn, Ni, Se, formaldehyde, phenol, toluene, xylene, polycyclic organic<br />
matter. This from a list of 189 hazardous air pollutants (HAP) added to<br />
existing list from 1970<br />
All of these legislations have had and do affect the manner in which metal casting facilities<br />
deal with their own solid, liquid,and gaseous waste, and therefore their own processes. The<br />
net result of these far-reaching environmental laws has been that metal casting facilities are very<br />
sensitive to any change, or potential change in their process which could improve their current<br />
environmental position. Whereas most industrial producers of castings didn’t even know what an<br />
environmental engineer was in the mid 1960s, the necessity to comply with the law has seen a<br />
large increase in the number of environmental engineers in positions of responsibility. Indeed it is<br />
not an exaggeration to say that all engineers currently employed in most industrial situations will<br />
find their careers being driven in part by environmental concerns.<br />
The ideal industrial organization, from an environmental point of view, would know<br />
exactly what materials are entering their facility and have complete control of what happens to<br />
those materials in that facility, so that nothing leaves the process in any way, shape, or form<br />
which could now or in the future be a danger to human health. Clearly this is an impossible task<br />
for metal casting plants which use and handle large quantities of materials. Rather than expecting<br />
to achieve the ideal situation, foundries of the present and future will need to optimize their processes<br />
to minimize the potential danger from emissions which exit their work space. On examination<br />
of the loops in the schematic on page 140, one’s eyes are drawn to the center of the foundry<br />
enclosure, the focus point of all of the inputs and outputs where casting of the metal takes place. It<br />
is clear that minimizing the potentially dangerous emissions from each process will require knowing<br />
much more about the materials which are going into the process and understanding what happens<br />
to materials during the process. The inputs and outputs and the processes involved in a<br />
146
hypothetical green sand foundry is illustrated in the schematics that follow:<br />
INPUTS<br />
Scrap <strong>Metal</strong><br />
Sand<br />
Chemicals<br />
Air<br />
Other Gases<br />
Water<br />
Melting<br />
<strong>Casting</strong><br />
Core Making<br />
Mold Making<br />
<strong>Casting</strong> Shakeout<br />
Sand Processing<br />
Reclamation<br />
<strong>Casting</strong> Cleaning<br />
<strong>Casting</strong> Painting<br />
PROCESS ENVELOPE<br />
It is the foundry’s responsibility, according to the federal laws summarized on pages 142 & 143,<br />
to be responsible for the materials generated in the foundry processes. The schematic above<br />
shows significant outputs other than the primary output, castings, all of which are potential<br />
sources of pollution. All five of the outputs listed (other than castings) constitute waste products<br />
which could contain toxic components, components which according to the law require mitigation<br />
in one way or another. Two examples follow in which the law is applied to current practice.<br />
CAA of 1990<br />
Consider the complexity of this situation where volatiles are concerned. Potentially harmful<br />
gases can be generated in many of the common processes involved in producing castings, as<br />
illustrated by the arrows in the above schematic. These gases include CO and CO 2 from combustion<br />
during melting and casting, many potentially toxic combustion gases from the organic binder<br />
materials, solvents associated with painting processes, etc. Most of the CO and CO 2 , as well as a<br />
good fraction of the combustion products from core binders is released to the atmosphere in the<br />
foundry, or is captured by the air handling system and released external to the foundry. Some of<br />
these gases will find their way into a scrubber system and can be captured in a sludge as the gaseous<br />
species or as another reacted compound. Most, however, will escape and be emitted into the<br />
surrounding atmosphere. According to G. Mosher, the Director of Environmental Affairs for the<br />
American Foundrymen’s Society (Modern <strong>Casting</strong>, October, 1994, pages 28 - 31) it is the intent<br />
of the current law that state air pollution agencies will, in the future, require each foundry to<br />
supply information about what hazardous air pollutants and how much of each (of the 189 hazardous<br />
air pollutants defined by Congress) they emit per year before operating permits can be<br />
obtained. There are two ways this information can be obtained. First, and most expensive, stack<br />
tests can be obtained and air samples analyzed for their content. Accurate analysis, however,<br />
requires very careful sampling over a reasonable time span. The second way to answer this question<br />
(satisfactorily for the EPA) is to use the EPA’s Emission Factors, factors based upon 1970s<br />
AFS research done on emissions due to binder combustion. This requires knowing how much of a<br />
particular binder is used in a given facility per year and then simply summing the various combustion<br />
products,as determined by the AFS research, from that binder. As an example Table 14 sum-<br />
147<br />
Foundry Boundary<br />
OUTPUTS<br />
Volatiles (Gases)<br />
Dusts<br />
Sludges<br />
Slags<br />
Spent Sands<br />
<strong>Casting</strong>s<br />
Inputs and Outputs Illustrating the Sources of Volatiles in a Typical Foundry
marizes the emissions from 1 pound of a phenolic No-Bake binder (This assumes that the binder<br />
is completely combusted in a manner typical for a ferrous foundry).<br />
Table 14: Emissions (in lbs) from One Pound of No-Bake Phenolic Resin; after Mosher<br />
Emission<br />
Amnt<br />
10 -6 Lb<br />
ppm<br />
Emission<br />
Amnt<br />
10 -6 Lb<br />
ppm<br />
Emission Factors for 12 of the most common binders or sand additives are available for calculational<br />
purposes. Granting of an operating permit will depend upon the individual state’s law and<br />
on the total amount of HAP emitted per annum.<br />
This method is a common sense approach (What Goes In Must Come Out) and a conservative<br />
estimate of emissions, because all of the binder is assumed to be combusted during the<br />
casting operation. However, it is common knowledge that a significant part of the binder will be<br />
lost to solid waste streams, most notably the core butts and broken cores which never see the heat<br />
of molten metal. Thus the foundry can be fairly confident of their air emission responsibility provided<br />
that they keep good records of the input binder purchases.<br />
RCRA of 1976<br />
The Resource Conservation and Recovery Act of 1976 regulates the generation, storage,<br />
handling and disposal of toxic waste material. A toxic substance is harmful or fatal if ingested or<br />
absorbed. Toxicity is determined using a standardized laboratory test called the extraction procedure,<br />
a process which in essence is supposed to simulate the leaching action which could occur if<br />
the substance were allowed to be exposed to rainfall in an open landfill. A substance is designated<br />
as being EP Toxic if an extract (the leachate from the test) contains any of the eight toxic elements<br />
or six pesticides that follow in concentrations greater than the values given (in milligrams<br />
per liter): Arsenic (5); Barium (100); Cadmium (1); Chromium (5); Lead (5); Mercury (0.2); Selenium<br />
(1); Silver (5); Endrin (0.02); Lindane (0.4); Methoxychlor (10); Toxaphene (0.5);<br />
2,4-D(10); 2,4,5 TP Silvex (1). It should be noted that a hazardous substance is a more allencompasing<br />
term than a toxic substance, though the two are often used interchangeably.<br />
148<br />
Emission<br />
NH 3 39 Benzene* 11209 Phenol* 975<br />
Total Hydrocarbons<br />
12159 Formaldehyde*<br />
10 Toluene* 634<br />
NOX 29 HCN* 29 Total Aromatic Amines* 49<br />
Amnt<br />
10 -6 Lb<br />
ppm<br />
SO 2 15107 M-Xylene* 97 Total C 2 to C 5 Aldehydes* 3070<br />
H 2 S 1462 Napthalene* 49 Total HAPs (With*) 16174<br />
Acroleine* 5 O-Xylene* 49 TOTALS** 44972<br />
** Thus for one pound of binder, 0.0449 pounds of Objectionable gaseous emissions and<br />
0.0162 pounds classified as hazardous emisssions are released to the atmosphere. Presumably<br />
the remainder of the one pound of binder will be emitted as the combustion products of water,<br />
CO 2, and CO (The OSHA emission standard for CO is 50 ppm)
According to the EPA there are over 400 listed hazardous wastes and there is more than one ton of<br />
hazardous waste per person per year generated in the U.S. (This amounts to ~ 250 million tons<br />
of hazardous waste generated in the U.S. Of this amount only a small portion is contributed<br />
by metal casting facilities, perhaps - as a guess - only 1 million tons at maximum.) All<br />
of the elements in the above list are potentially present in the output from foundries. Certainly<br />
lead and cadmium are likely to show up in ferrous materials as carry over from scrap in the<br />
charge. This distribution of lead as an impurity is illustrated in the input - output schematic below:<br />
INPUTS<br />
Scrap <strong>Metal</strong><br />
Sand<br />
Chemicals<br />
Air<br />
Other Gases<br />
Water<br />
Pb<br />
or<br />
PbO<br />
Melting<br />
<strong>Casting</strong><br />
Core Making<br />
Mold Making<br />
<strong>Casting</strong> Shakeout<br />
Sand Processing<br />
Reclamation<br />
<strong>Casting</strong> Cleaning<br />
<strong>Casting</strong> Painting<br />
Pb<br />
or<br />
PbO<br />
PROCESS ENVELOPE<br />
Sources of lead in the charge include 1. Leaded steels (lead is used to improve machinability of<br />
steels); 2. Leaded paints on scrap (Lead was a prominent element in paints for many years); 3.<br />
Lead included in automobile shredding products (lead-acid batteries). It can be seen from the<br />
above schematic that the melting operation results in lead being ever more widely distributed<br />
(entropy in action) throughout the foundry work area, perhaps to the immediate neighborhood of<br />
the foundry, and to the landfill site through leaching action of rainfall. The foundry is required by<br />
law to make sure that emissions of lead from their stacks is within state - accepted tolerances and<br />
that the air within their foundry contains no more than a certain allowable maximum amount.<br />
Clearly the solution to this problem includes careful monitoring of input charge materials and<br />
using an air handling system within the foundry which captures effluent from the melting area by<br />
the use of a scrubber ( a device using water to entrap particulate matter) or a baghouse (a big filter<br />
which captures particulate matter).<br />
Of course, the scrubber sludge and the baghouse dust may now contain lead in quantities large<br />
enough to be classified as a toxic waste. This material will then either have to be transported to a<br />
toxic waste site (very expensive- ~ 5 to 10 times the cost of a normal landfill fee), or the lead will<br />
have to be rendered non-leachable by chemically combining it with another material or by coating<br />
the lead particles in a material which will not leach (another costly operation).<br />
While lead is of concern as an impurity in charge materials which then ends up in the baghouse<br />
or in scrubber sludge, the fraction of solid waste from metal casting plants which is classified<br />
as hazardous is quite small indeed. The largest component of waste materials from foundries<br />
is spent sand which, for the most part, is not hazardous and can be disposed of in local landfills at<br />
reasonable cost. In fact most of the spent sand from foundries is used for daily cover at the land-<br />
149<br />
OUTPUTS<br />
Volatiles (Gases)<br />
Dusts<br />
Sludges<br />
Slags<br />
Spent Sands<br />
<strong>Casting</strong>s<br />
Foundry Boundary<br />
Hazardous<br />
Waste Landfill<br />
or<br />
Chemical<br />
Treatment<br />
Inputs and Outputs Illustrating the Flow of Lead in a Typical Iron or Steel Foundry
fill, which usually means that the foundry will pay less per ton to dispose of the spent sand. Even<br />
in the instance of lead and cadmium containing dusts and sludges, there are industrial organizations<br />
which “mine” these wastes for their heavy metals, and as such will either purchase these<br />
“byproducts” from the foundry or will take them at no cost. Of course the monetary exchange is<br />
determined by the grade of the “ore” that is the dust or the sludge.<br />
Pollution Prevention<br />
The above examples of air emissions and lead emissions are only two environmental concerns<br />
which foundries face on a daily basis. Obviously there are many other examples as well,<br />
examples which will change from one foundry to another, from one metal to another, and even<br />
from one state to another (depending on state statutes). The challenge for the foundry industry<br />
(and every other industrial sector which uses large quantities of materials) is to look closely at<br />
their processes and purchases with the intent of minimizing or eliminating waste. This engineering<br />
and management strategy is referred to as pollution prevention, as opposed to the end-ofpipe<br />
treatment which has dominated the environmental area for the first 20 years of the environmental<br />
revolution.<br />
Pollution Prevention in the future of metal casting facilities will require efforts to:<br />
1. Take a closer look at the fundamental material handling processes with<br />
an eye to implementing design changes which will minimize waste.<br />
2. Explore alternate molding media (to sand) with the intent of developing<br />
dimensionally more stable aggregates which are more resistant to the rigors<br />
of metal casting and more reclamation friendly.<br />
3. Develop new core and mold binders which will combust more completely<br />
and produce a minimum of the hazardous combustion products.<br />
4. Develop and use more sophisticated equipments for screening incoming<br />
charge material to minimize problems from contaminants such as lead or<br />
cadmium.<br />
5. Increase the overall industry wide casting yield, by using innovative<br />
casting techniques and developing new casting techniques which minimize<br />
gating and risering systems.<br />
6. Explore new sources of charge material; for example in the cast iron<br />
industry take a serious look at direct reduced iron as an alternate to scrap.<br />
7. Other?<br />
150