Time Series - Data and Statistical Services - Princeton University
Time Series - Data and Statistical Services - Princeton University
Time Series - Data and Statistical Services - Princeton University

Create successful ePaper yourself
Turn your PDF publications into a flip-book with our unique Google optimized e-Paper software.
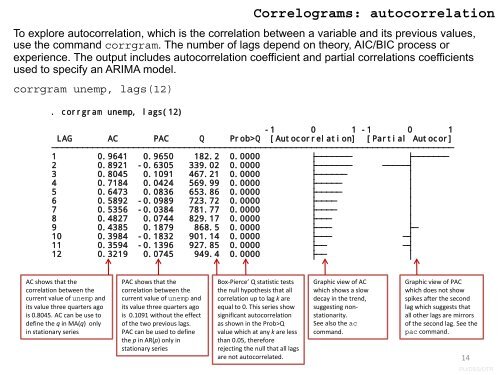
To explore autocorrelation, which is the correlation between a variable <strong>and</strong> its previous values,<br />
use the comm<strong>and</strong> corrgram. The number of lags depend on theory, AIC/BIC process or<br />
experience. The output includes autocorrelation coefficient <strong>and</strong> partial correlations coefficients<br />
used to specify an ARIMA model.<br />
corrgram unemp, lags(12)<br />
. corrgram unemp, lags(12)<br />
Correlograms: autocorrelation<br />
-1 0 1 -1 0 1<br />
LAG AC PAC Q Prob>Q [Autocorrelation] [Partial Autocor]<br />
1 0.9641 0.9650 182.2 0.0000<br />
2 0.8921 -0.6305 339.02 0.0000<br />
3 0.8045 0.1091 467.21 0.0000<br />
4 0.7184 0.0424 569.99 0.0000<br />
5 0.6473 0.0836 653.86 0.0000<br />
6 0.5892 -0.0989 723.72 0.0000<br />
7 0.5356 -0.0384 781.77 0.0000<br />
8 0.4827 0.0744 829.17 0.0000<br />
9 0.4385 0.1879 868.5 0.0000<br />
10 0.3984 -0.1832 901.14 0.0000<br />
11 0.3594 -0.1396 927.85 0.0000<br />
12 0.3219 0.0745 949.4 0.0000<br />
AC shows that the<br />
correlation between the<br />
current value of unemp <strong>and</strong><br />
its value three quarters ago<br />
is 0.8045. AC can be use to<br />
define the q in MA(q) only<br />
in stationary series<br />
PAC shows that the<br />
correlation between the<br />
current value of unemp <strong>and</strong><br />
its value three quarters ago<br />
is 0.1091 without the effect<br />
of the two previous lags.<br />
PAC can be used to define<br />
the p in AR(p) only in<br />
stationary series<br />
Box-Pierce’ Q statistic tests<br />
the null hypothesis that all<br />
correlation up to lag k are<br />
equal to 0. This series show<br />
significant autocorrelation<br />
as shown in the Prob>Q<br />
value which at any k are less<br />
than 0.05, therefore<br />
rejecting the null that all lags<br />
are not autocorrelated.<br />
Graphic view of AC<br />
which shows a slow<br />
decay in the trend,<br />
suggesting nonstationarity.<br />
See also the ac<br />
comm<strong>and</strong>.<br />
Graphic view of PAC<br />
which does not show<br />
spikes after the second<br />
lag which suggests that<br />
all other lags are mirrors<br />
of the second lag. See the<br />
pac comm<strong>and</strong>.<br />
14<br />
PU/DSS/OTR