Pietruch R., Grzanka A., Konopka W.: Vowels recognition
Pietruch R., Grzanka A., Konopka W.: Vowels recognition
Pietruch R., Grzanka A., Konopka W.: Vowels recognition

Create successful ePaper yourself
Turn your PDF publications into a flip-book with our unique Google optimized e-Paper software.
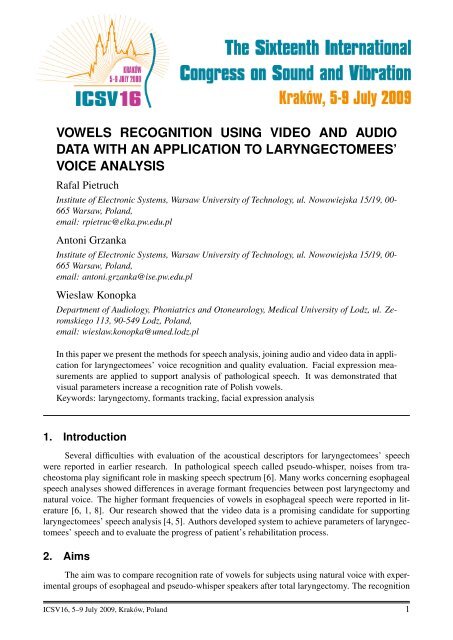
VOWELS RECOGNITION USING VIDEO AND AUDIO<br />
DATA WITH AN APPLICATION TO LARYNGECTOMEES’<br />
VOICE ANALYSIS<br />
Rafal <strong>Pietruch</strong><br />
Institute of Electronic Systems, Warsaw University of Technology, ul. Nowowiejska 15/19, 00-<br />
665 Warsaw, Poland,<br />
email: rpietruc@elka.pw.edu.pl<br />
Antoni <strong>Grzanka</strong><br />
Institute of Electronic Systems, Warsaw University of Technology, ul. Nowowiejska 15/19, 00-<br />
665 Warsaw, Poland,<br />
email: antoni.grzanka@ise.pw.edu.pl<br />
Wieslaw <strong>Konopka</strong><br />
Department of Audiology, Phoniatrics and Otoneurology, Medical University of Lodz, ul. Zeromskiego<br />
113, 90-549 Lodz, Poland,<br />
email: wieslaw.konopka@umed.lodz.pl<br />
In this paper we present the methods for speech analysis, joining audio and video data in application<br />
for laryngectomees’ voice <strong>recognition</strong> and quality evaluation. Facial expression measurements<br />
are applied to support analysis of pathological speech. It was demonstrated that<br />
visual parameters increase a <strong>recognition</strong> rate of Polish vowels.<br />
Keywords: laryngectomy, formants tracking, facial expression analysis<br />
1. Introduction<br />
Several difficulties with evaluation of the acoustical descriptors for laryngectomees’ speech<br />
were reported in earlier research. In pathological speech called pseudo-whisper, noises from tracheostoma<br />
play significant role in masking speech spectrum [6]. Many works concerning esophageal<br />
speech analyses showed differences in average formant frequencies between post laryngectomy and<br />
natural voice. The higher formant frequencies of vowels in esophageal speech were reported in literature<br />
[6, 1, 8]. Our research showed that the video data is a promising candidate for supporting<br />
laryngectomees’ speech analysis [4, 5]. Authors developed system to achieve parameters of laryngectomees’<br />
speech and to evaluate the progress of patient’s rehabilitation process.<br />
2. Aims<br />
The aim was to compare <strong>recognition</strong> rate of vowels for subjects using natural voice with experimental<br />
groups of esophageal and pseudo-whisper speakers after total laryngectomy. The <strong>recognition</strong><br />
ICSV16, 5–9 July 2009, Kraków, Poland 1
16 th International Congress on Sound and Vibration, 5–9 July 2009, Kraków, Poland<br />
was made using analysis of acoustical and facial expression parameters.<br />
3. Methods<br />
3.1 Computer system<br />
Presenting system’s platform is Windows XP. Program is based on DirectShow filters technology.<br />
It extracts speech parameters from digital movie files (mostly in MPEG format), visualizes them,<br />
and provides methods for archiving. We implemented automatic face detection algorithm for frontal<br />
view image sequence. The system automatically tracks elements of face in real time, extracts visual<br />
parameters including lips shape, compares them with acoustical descriptors and updates vocal tract<br />
model parameters. Neural network simulation and learning were made on Linux platform Ubuntu<br />
8.04 distribution. We used GNU Octave program version 3.0.0 with nnet-0.1.9 package.<br />
3.2 Acoustical model<br />
In this work we used the model of vocal tract divided into 10 sections of resonance cavities.<br />
We assumed that the palate is closed and the waves don’t pass through the nasal cavity. There is no<br />
energy loss and only reflection effect is taken into consideration. With these assumptions the vocal<br />
tract model is equivalent to lattice filter with PARCOR parameters equal to negative reflection coefficients<br />
[7]. Reversed lattice filter can be then transformed into transversal filter [3], which parameters<br />
can be estimated from speech signal using linear prediction method. Adaptive recursive least squares<br />
algorithm was used to estimate transversal filter LPC coefficients [3]. There is reversed transformation<br />
that from given LPC parameters derives related cross-sectional diameters of vocal tract sections.<br />
Transversal filter coefficients were used to track formant frequencies of six Polish vowels [6]. Two<br />
first formants F1 and F2 were chosen as the acoustical descriptors in audio <strong>recognition</strong> system.<br />
3.3 Formants tracking<br />
In the system with vowel <strong>recognition</strong> functionality the formant tracking algorithm was implemented.<br />
There was used Christensen algorithm for finding formants candidates from spectrum [2].<br />
All minimums of spectrum second derivative are chosen. For 4kHz bandwidth that was assumed in<br />
our study we can find up to 5 candidates f K = {f K 1 , f K 2 , · · · , f K nK } and we need to assign 4 formants<br />
numbers F = {F 1, F 2, · · · , F nF }. There can be three situations:<br />
2<br />
1. nK = nF<br />
Then candidates are assigned respectively to formants numbers with a function fK→F according<br />
to equation 1.<br />
fK→F : f K j → F i ⇔ i = j (1)<br />
where : i, j ∈ 1, 2, · · · , nF<br />
2. nK < nF<br />
In this situation nF − nK formants will be rejected. Function 2 will specify which formants<br />
need to be unassigned. The function can be given using BF matrix where each row represents<br />
candidate and each column represents one of formant (equation 3). This transformation is found<br />
using best-fit, minimum cost algorithm 7.<br />
fK→F : f K j → F i (2)<br />
BF (j, i) = 0 ⇔ fK→F (j) = i (3)
16 th International Congress on Sound and Vibration, 5–9 July 2009, Kraków, Poland<br />
3. nK > nF<br />
In this situation nK − nF candidates will stay unassigned. There can be one extra candidate<br />
in our situation. We are looking for the function 4 that will assign formant numbers to limited<br />
candidates according to matrix BT F , where columns represents each candidate and each row is<br />
related to formant number. Matrix elements are found according to equation 5.<br />
fF →K : F i → f K j<br />
B T F (i, j) = 0 ⇔ fF →K(i) = j (5)<br />
Best fit, minimal cost algorithm to find related transformation takes into account candidates<br />
frequencies f K and mean frequencies from previously assigned formants: ¯F = { ¯ F 1, ¯ F 2, · · · , ¯ F nF },<br />
where for n-th sample: ¯ F i(n) = M m=1 F i(n − m). In our program we make an assumption: M = 9.<br />
In the algorithm the sum of costs of changing previous formant frequencies ( ¯ F i) into new ones (f K j )<br />
is minimized according to equation 6.<br />
where CF (i, j) = | ¯ F i − f K j |<br />
max<br />
BF<br />
nF<br />
i=1<br />
(4)<br />
nK<br />
BF (i, j) · CF (i, j) (6)<br />
j=1<br />
∀j1,j2∈{1,2,...,nK}∀i1,i2∈{1,2,...,nF } for which fK→F (j1) = i1 ∧ fK→F (j2) = i2 :<br />
f K j1 < f K j1 ⇔ i1 < i2 (7)<br />
∀j1,j2∈{1,2,...,nK}∀i1,i2∈{1,2,...,nF } for which fF →K(i1) = j1 ∧ fF →K(i2) = j2 :<br />
i1 < i2 ⇔ f K j1 < f K j2 (8)<br />
There is natural assumption that formant candidates should be assigned to formants with respect<br />
to their order (equations 7, 8). Then we need to check all combinations min{nF , nK} - elements set<br />
of max{nF , nK} - elements set.<br />
3.4 Video methods<br />
Within our system novel computer vision techniques were used to automatically segment the<br />
eyes, mouth and nose regions [5]. Following parameters are tracked within the system: distance<br />
between the eyes L0, lips height LH and width LW , distance between line joining the eyes and the<br />
bottom of a jaw LJ. From lips shape the mouth opening area is estimated. Jaw angle and area of<br />
mouth opening were chosen as representatives of facial expression descriptors.<br />
3.5 Face elements tracking<br />
Facial elements tracking algorithms start from color space conversion, RGB to HSV. Then for<br />
each pixel (with respect to assumed margins) values of 5 features is counted. According to adaptive<br />
thresholds the binarization of 5 regions is made. The thresholds are updated according to region sizes.<br />
Related regions specifies red colored pixels (RED), dark pixels (DARK), moving objects (MOV),<br />
vertical differences (VDIFF) and horizontal differences (HDIFF).<br />
3
16 th International Congress on Sound and Vibration, 5–9 July 2009, Kraków, Poland<br />
• Red color intensity IRED(x, y) for pixel coordinates (x, y), where x ∈ {1, · · · , W }, y ∈<br />
{1, · · · , H}, (W - picture width, H - picture height), is counted from Hue component (H)<br />
according to equation 9.<br />
⎧ <br />
⎪⎨ GRED BRED − H(x, y)<br />
IRED(x, y) =<br />
⎪⎩<br />
<br />
dla H(x, y) < BRED<br />
0 dla BRED ≤ H(x, y) ≤ HMAX − BRED<br />
<br />
GRED H(x, y) + BRED − HMAX dla H(x, y) > HMAX − BRED<br />
(9)<br />
where:<br />
HMAX = 2 8 , GRED = 2 4 , BRED = 15<br />
• Local, dynamic changes are counted for every pixel (x, y) for n-th sample according to equation<br />
10.<br />
IMOV (n) = λIMOV (n − 1) + (1 − λ) V (n) − V (n − 1) , (10)<br />
where λ = 0.875.<br />
• Horizontal differences for pixel at (x, y) are counted according to Value component (V) using<br />
equation 11.<br />
IHDIF F (x, y) = V (x, y) − V (x − 1, y) (11)<br />
• Vertical differences for pixel at (x, y) are counted according to V component using equation 12.<br />
IV DIF F (x, y) = 1<br />
• Darkness of pixel (x, y) is counted using equation 13.<br />
<br />
<br />
V (x − 1, y − 1) − V (x − 1, y) <br />
4<br />
+ 1<br />
<br />
V (x, y − 1) − V (x, y) <br />
2<br />
+ 1<br />
<br />
V (x + 1, y − 1) − V (x + 1, y) . (12)<br />
4<br />
IDARK(x, y) = 2 8 − V (x, y) − 1 (13)<br />
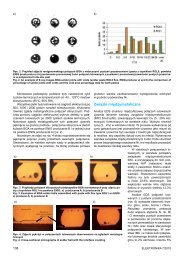
The examples of extracted regions are presented on figure 1.<br />
Face shape is extracted from HDIFF and RED regions. Face is the most red region in picture<br />
and from left and right sides it should be horizontal contrast. Face borders are found from assumptions<br />
14 and 15.<br />
For every y coordinate:<br />
4<br />
• the nearest point, beginning from left margin, that fulfils below assumption is chosen:<br />
x ∈ {SMAX, · · · , 1<br />
2 W } ∧ ZHDIF<br />
SMAX <br />
F (x, y) ∧<br />
i=1<br />
ZRED(x + i, y) > SMIN<br />
• the nearest point, beginning from right margin, that fulfils below assumption is chosen:<br />
x ∈ { 1<br />
2 W, · · · , W − SMAX}<br />
SMAX <br />
∧ ZHDIF F (x, y) ∧<br />
i=1<br />
ZRED(x − i, y) > SMIN<br />
(14)<br />
(15)
16 th International Congress on Sound and Vibration, 5–9 July 2009, Kraków, Poland<br />
(a) Dark region. (b) Moving region.<br />
(c) Horizontal differences. (d) Vertical differences.<br />
(e) Red region. (f) Face shape<br />
(g) Face elements (h) Face borders, elements, symmetry<br />
lines, eyes points and mouth contour<br />
Figure 1. Results of video processing.<br />
5
16 th International Congress on Sound and Vibration, 5–9 July 2009, Kraków, Poland<br />
where: SMAX = 32, SMIN = 16<br />
Example of evaluated face region is given on figure 1(f) indicated by black pixels.<br />
Face elements segmentation is done according to regions sets combination (equation 16). for<br />
every coordinate (x, y) .<br />
ZELEM = (ZRED ∧ ZV DIF F ) ∨ (ZDARK ∧ ZMOV ) (16)<br />
Example of evaluated face elements are shown on figure 1(g) indicated by black pixels.<br />
Middle points between left and right borders are taken as potential points of face symmetry.<br />
First the line that covers the most of middle points is evaluated using Hough transform. Points that<br />
lays in distance from line greater than defined are removed from set. Face symmetry line is estimated<br />
then using MLS (Minimum Least Squares) criteria from left points.<br />
From face symmetry line we create orthogonal lines between the borders. For every line the<br />
middle point of face elements region symmetry is found. The symmetry lines for facial elements<br />
is estimated with the same algorithm as facial symmetry from the set of facial elements symmetry<br />
points. The result of described methods is shown on figure 1(h).<br />
Symmetrical face elements can consists of regions that lays on symmetry line or two symmetrical<br />
regions on both sides of line. Symmetry points of the same parity of symmetrical regions are<br />
grouped using binary filtering: hB = [1 1 1 1 1]. The greatest sets with odd number of symmetric<br />
regions are taken as nose and mouth candidates, and sets with even numbers of symmetrical regions<br />
are potential eyes regions. Then assumptions of regions relative positions are taken into account, and<br />
symmetrical regions are assigned to mouth, eyes and nose elements. Lips contour is evaluated by<br />
inflation of symmetry middle point.<br />
3.6 Neural network<br />
We used neural network (NN) for both audio and visual <strong>recognition</strong> systems. Feed forward<br />
structure was used with two dimensional input vectors. The ’tansig’ transfer function was used in the<br />
first layer of NN and linear transfer function was chosen for output layer. We used mean of squared<br />
errors (MSE) performance function and back propagation NN training function. Network was trained<br />
according to gradient descent with momentum.<br />
Audio and video parameters were both limited to 2 dimensions. NN was trained to assign<br />
maximum value (1) for output related to spoken vowel and minimum value (-1) to other outputs. In<br />
NN simulation the maximum the output of maximum value was chosen and the vowel assigned to it<br />
was recognized. For visual data hidden layer size was 3 and output layer size was 4. Only 4 groups<br />
of vowels {’a’, ’e’}, {’i’, ’y’}, {’u’} and {’o’}were represented by n1:4 output neurons respectively.<br />
The input vectors [x1, x2] were formed by facial parameters converted by following method: x1 =<br />
4LHLW /L 2 0 −1, x2 = (LJ −LJm)/L0, where LJm is a jaw opening in neutral position. For acoustical<br />
parameters first layer had 5 neurons and output had 6 neurons. Every output n1:6 was related to each<br />
Polish vowel: ’a’, ’i’, ’e’, ’y’, ’o’, ’u’respectively. Input vectors [x1, x2] were normalized to achieve<br />
values from (-1; 2) in following way: x1 = F 2/1000 − 1.5, x2 = F 1/1000 − 0.7.<br />
3.7 Subjects<br />
Control group (C) of 10 laryngeal speakers formed the training set for neural networks. Experimental<br />
groups of 10 esophageal speakers (E) and 10 pseudo-whisper patients (P) were test sets.<br />
The system was evaluated with the experimental study of 34 subjects articulating 6 Polish isolated<br />
vowels: ’a’, ’i’, ’e’, ’y’, ’o’, ’u’(see Appendix A. for related IPA symbols). Control group (C)<br />
of 10 laryngeal speakers formed the training set in both cases: NN for visual descriptors (NN-v) and<br />
NN for acoustical parameters (NN-a). Experimental groups of 10 esophageal speakers (Ev) and 10<br />
6
16 th International Congress on Sound and Vibration, 5–9 July 2009, Kraków, Poland<br />
Figure 2. IPA symbols of Polish vowels<br />
pseudo-whisper patients (Pv) formed test sets for visual analyses. Mean age of group Ev was 64 and<br />
was formed by men.<br />
For acoustical analyses experimental group consisted of 10 esophageal speakers (Ea). Mean<br />
age of group Ea was 64 but it differed from Ev group with 4 subjects including one woman. Pseudowhisper<br />
group was not taken into consideration as the extraction of formants in this group failed, as<br />
discussed in [6].<br />
4. Results<br />
The neural network parameters were reported in [5]. From audio data we achieved a vowels<br />
<strong>recognition</strong> rate of 98 percent in C group and 66 percent in Ea group. The <strong>recognition</strong> rate for visual<br />
data was 94 percent in C group, 76 percent in Pv and 76 percent in Ev group.<br />
5. Discussion<br />
In present state the algorithm is sensitive to variable conditions of face (beard, glasses, and<br />
long hair). Video data measurements were supported by operator. No algorithm for extraction of<br />
jaw opening length has been implemented yet in our system. Every result of visual parameter was<br />
compared with subjective, manual measurement made on picture grabbed from related video frame.<br />
Our methodology demonstrated an improvement of vowels <strong>recognition</strong> especially for pseudo-whisper<br />
speakers as compared with formants analysis [6]. We expect that the further improvement of <strong>recognition</strong><br />
will be achieved in our future work by evaluating and extracting hybrid audio-video parameters<br />
using presented system.<br />
6. Conclusion<br />
The proposed hybrid framework of joined audio and video feature extraction is to be achieving<br />
higher <strong>recognition</strong> accuracies and its integration would yield significant improvement of speech<br />
analysis. System is easy to extend. In future we are going to analyze real time images from video<br />
camera.<br />
7. Appendix<br />
7.1 IPA symbols for Polish vowels<br />
Polish vowels transcriptions are given in figure 2.<br />
7
16 th International Congress on Sound and Vibration, 5–9 July 2009, Kraków, Poland<br />
8. Acknowledgement<br />
The work described in this paper is funded by Polish Ministry of Science and Higher Education<br />
under grant number N N518 0929 33.<br />
REFERENCES<br />
1 T. Cervera, J. L. Miralles, and J. González A. Acoustical analysis of spanish vowels produced<br />
by laryngectomized subjects. Journal of Speech, Language, and Hearing Research, 44:988–996,<br />
2001.<br />
2 J. M. Christensen and B. Weinberg. Vowel duration characteristics of esphageal speech. Journal of<br />
Speech and Hearing Research, 19:678–689, 1976.<br />
3 S. Haykin. Adaptive filter theory. Prentice Hall, Inc., Upper Saddle River, 1991.<br />
4 R. <strong>Pietruch</strong>, M. Michalska, W. <strong>Konopka</strong>, and A. <strong>Grzanka</strong>. An analysis of face expression images for<br />
evaluation of laryngectomees voice quality. In Mirjana Sovilj and Dimitris Skanavis, editors, First<br />
European Congress on Prevention, Detection and Diagnostics of Verbal Communication Disorders,<br />
pages CD–ROM, Patra, Grecja, grudzień, 15-17 2006.<br />
5 R. <strong>Pietruch</strong>, M. Michalska, W. <strong>Konopka</strong>, and A. <strong>Grzanka</strong>. Evaluation of laryngectomees’ voice<br />
quality usin correlations with facial expression. In Seiji Niimi, editor, Proceedings of the 5th International<br />
Conference on Voice Physiology and Biomechanics, pages 96–99, Tokio, Japonia, lipiec,<br />
12-14 2006.<br />
6 R. <strong>Pietruch</strong>, M. Michalska, W. <strong>Konopka</strong>, and A. <strong>Grzanka</strong>. Methods for formant extraction in speech<br />
of patients after total laryngectomy. Biomedical Signal Processing and Control, 1/2:107–112, 2006.<br />
7 S. Saito. Speech Science and Technology. Ohmsha, Ltd., Tokyo, 1992.<br />
8 M. Sisty and B. Weinberg. Formant frequency characteristics of esophageal speech. Journal of<br />
Speech and Hearing Research, 15:439–448, 1972.<br />
8