4. The Draw a Person Test for Ghana
4. The Draw a Person Test for Ghana
4. The Draw a Person Test for Ghana
Create successful ePaper yourself
Turn your PDF publications into a flip-book with our unique Google optimized e-Paper software.
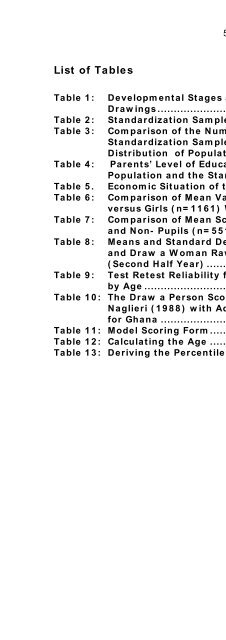
List of Tables<br />
5<br />
Table 1: Developmental Stages and <strong>Ghana</strong>ian Children’s<br />
<strong>Draw</strong>ings .....................................................................10<br />
Table 2: Standardization Sample by Age and Pupil Status ........19<br />
Table 3: Comparison of the Number of Children in the<br />
Standardization Sample and the Regional<br />
Distribution of Population in <strong>Ghana</strong>............................20<br />
Table 4: Parents’ Level of Education in the <strong>Ghana</strong>ian<br />
Population and the Standardization Sample ................21<br />
Table 5. Economic Situation of the Families in the Sample .......22<br />
Table 6: Comparison of Mean Values of Boys (n=1144)<br />
versus Girls (n=1161) Weighted as to Regions ...........23<br />
Table 7: Comparison of Mean Scale Values of Pupils (n=1754)<br />
and Non- Pupils (n=551) Weighted as to Regions.......23<br />
Table 8: Means and Standard Deviations in the <strong>Draw</strong> a Man<br />
and <strong>Draw</strong> a Woman Raw Scores per Age Group<br />
(Second Half Year) ......................................................25<br />
Table 9: <strong>Test</strong> Retest Reliability <strong>for</strong> the Man and Woman Scores<br />
by Age .........................................................................26<br />
Table 10: <strong>The</strong> <strong>Draw</strong> a <strong>Person</strong> Scoring System as Developed by<br />
Naglieri (1988) with Added Images and Explanations<br />
<strong>for</strong> <strong>Ghana</strong> ....................................................................32<br />
Table 11: Model Scoring Form.....................................................36<br />
Table 12: Calculating the Age .....................................................56<br />
Table 13: Deriving the Percentile Score from the Raw Score ......57


