4. The Draw a Person Test for Ghana
4. The Draw a Person Test for Ghana
4. The Draw a Person Test for Ghana

You also want an ePaper? Increase the reach of your titles
YUMPU automatically turns print PDFs into web optimized ePapers that Google loves.
23<br />
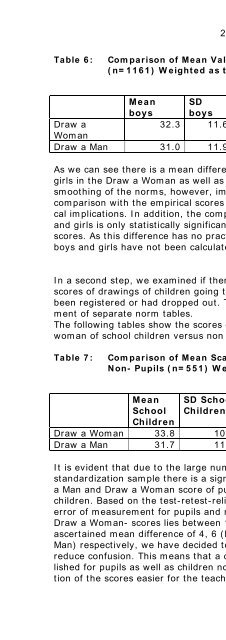
Table 6: Comparison of Mean Values of Boys (n=1144) versus Girls<br />
(n=1161) Weighted as to Regions<br />
Mean SD Mean SD F P<br />
boys boys girls girls<br />
<strong>Draw</strong> a<br />
Woman<br />
32.3 11.6 33.0 11.0 7.0 .04<br />
<strong>Draw</strong> a Man 31.0 11.9 30.0 11.0 5.1 .10<br />
As we can see there is a mean difference of one point between boys and<br />
girls in the <strong>Draw</strong> a Woman as well as the <strong>Draw</strong> a Man raw scores. <strong>The</strong><br />
smoothing of the norms, however, implied changes up to 2 raw scores in<br />
comparison with the empirical scores so that this difference has no practical<br />
implications. In addition, the comparison of mean scores between boys<br />
and girls is only statistically significant as concerns the <strong>Draw</strong> a Woman<br />
scores. As this difference has no practical significance separate norms <strong>for</strong><br />
boys and girls have not been calculated.<br />
In a second step, we examined if there were significant differences in the<br />
scores of drawings of children going to school and those who had never<br />
been registered or had dropped out. This would necessitate the establishment<br />
of separate norm tables.<br />
<strong>The</strong> following tables show the scores of the drawings of a man and of a<br />
woman of school children versus non pupils.<br />
Table 7: Comparison of Mean Scale Values of Pupils (n=1754) and<br />
Non- Pupils (n=551) Weighted as to Regions<br />
Mean<br />
School<br />
Children<br />
SD School<br />
Children<br />
Mean<br />
Non<br />
Pupils<br />
SD<br />
Non<br />
Pupils<br />
F p<br />
<strong>Draw</strong> a Woman 33.8 10.9 29.2 11.9 73.0 .00<br />
<strong>Draw</strong> a Man 31.7 11.2 26.7 11.4 89.8 .00<br />
It is evident that due to the large number of children captured by the<br />
standardization sample there is a significant difference in the mean <strong>Draw</strong><br />
a Man and <strong>Draw</strong> a Woman score of pupils versus non school attending<br />
children. Based on the test-retest-reliability of a sub sample the standard<br />
error of measurement <strong>for</strong> pupils and non pupils in the <strong>Draw</strong> a Man and<br />
<strong>Draw</strong> a Woman- scores lies between 11.5 and 10.5. Since it exceeds the<br />
ascertained mean difference of 4, 6 (<strong>Draw</strong> a Woman) and 4, 5 (<strong>Draw</strong> a<br />
Man) respectively, we have decided to limit ourselves to one norm table to<br />
reduce confusion. This means that a common norm table has been established<br />
<strong>for</strong> pupils as well as children not going to school to make interpretation<br />
of the scores easier <strong>for</strong> the teachers.