4. The Draw a Person Test for Ghana
4. The Draw a Person Test for Ghana
4. The Draw a Person Test for Ghana

Create successful ePaper yourself
Turn your PDF publications into a flip-book with our unique Google optimized e-Paper software.
19<br />
be assessed in the respective regions in the two samples from 2003 and<br />
2005.<br />
<strong>The</strong> tables provided by the <strong>Ghana</strong> Statistical Service divided the age<br />
groups into 5 to 9 years and 10 to 14 years. But since our normative<br />
sample was to be made up of children from 5 to 12 years, we decided to<br />
use the number of children aged 5 to 9 years in the population as a frame<br />
of reference <strong>for</strong> the regional composition of the sample.<br />
A proportional stratified sample was used to gather data from a representative<br />
sample of children allowing <strong>for</strong> the following factors: age, sex, and<br />
educational background of their parents, region and urban or rural residence.<br />
<strong>The</strong> sample there<strong>for</strong>e took into account those demographic variables<br />
which characterize the population of interest. Individuals were then<br />
selected at random from school records, but proportional to the demographic<br />
make-up of the <strong>Ghana</strong>ian population.<br />
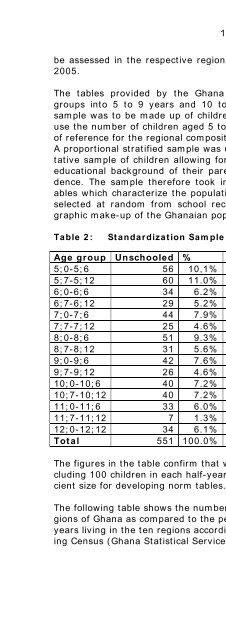
Table 2: Standardization Sample by Age and Pupil Status<br />
Age group Unschooled % School % Total %<br />
5;0-5;6 56 10,1% 114 6,5% 170 7,4%<br />
5;7-5;12 60 11.0% 113 6.4% 173 7.5%<br />
6;0-6;6 34 6.2% 131 7.5% 165 7.2%<br />
6;7-6;12 29 5.2% 123 7.0% 152 6.6%<br />
7;0-7;6 44 7.9% 101 5.8% 145 6.3%<br />
7;7-7;12 25 <strong>4.</strong>6% 119 6.8% 144 6.2%<br />
8;0-8;6 51 9.3% 97 5.5% 148 6,4%<br />
8;7-8;12 31 5.6% 115 6.6% 146 6.3%<br />
9;0-9;6 42 7.6% 99 5.7% 141 6.1%<br />
9;7-9;12 26 <strong>4.</strong>6% 112 6.4% 138 6.0%<br />
10;0-10;6 40 7.2% 107 6.1% 147 6.4%<br />
10;7-10;12 40 7.2% 146 8.3% 186 8.1%<br />
11;0-11;6 33 6.0% 110 6.3% 143 6.2%<br />
11;7-11;12 7 1.3% 79 <strong>4.</strong>5% 86 3.7%<br />
12;0-12;12 34 6.1% 187 10.7% 221 9.6%<br />
Total 551 100.0% 1 754 100.0% 2 306 100.0%<br />
<strong>The</strong> figures in the table confirm that we were able to attain our goal of including<br />
100 children in each half-year age group in order to assure a sufficient<br />
size <strong>for</strong> developing norm tables.<br />
<strong>The</strong> following table shows the number of children assessed in different regions<br />
of <strong>Ghana</strong> as compared to the percentage of children aged 5 to 9<br />
years living in the ten regions according to the 2000 Population and Housing<br />
Census (<strong>Ghana</strong> Statistical Service, 2002).