Calibation of XRF Dating of Desert Varnish - Inside Mines ...
Calibation of XRF Dating of Desert Varnish - Inside Mines ...
Calibation of XRF Dating of Desert Varnish - Inside Mines ...

Create successful ePaper yourself
Turn your PDF publications into a flip-book with our unique Google optimized e-Paper software.
Project Description: Calibration <strong>of</strong> X-ray Fluorescence <strong>Dating</strong> <strong>of</strong> <strong>Desert</strong> <strong>Varnish</strong><br />
Background<br />
This proposal is a resubmission from last year with major revisions based on comments from the reviewers<br />
<strong>of</strong> that proposal and additional research. Below are the main concerns identified by last year’s reviewers and<br />
the responses and/or changes for this year’s submission:<br />
• Several reviewers mentioned the desert varnish micro-lamination (VML) work <strong>of</strong> Liu and Broecker<br />
(2007), and questioned how a surface X-ray fluorescence (<strong>XRF</strong>) measurement could provide a reliable<br />
chronometric signal for a laminated varnish. Addressing this question has changed the direction <strong>of</strong> the<br />
research project entirely. As discussed at length below, it is possible to use the time markers <strong>of</strong> the<br />
VML microstratigraphy along with micro-probe scans to calibrate the <strong>XRF</strong> Manganese (Mn) signal<br />
with age. The process is demonstrated below using the Liu and Broecker data from alluvial fans in<br />
Death Valley. A knowledge <strong>of</strong> the desert varnish composition also allows a more accurate description<br />
<strong>of</strong> x-ray propagation in the medium.<br />
• One reviewer pointed out the challenge <strong>of</strong> measuring Manganese with <strong>XRF</strong> due to the large iron peak<br />
located nearby. Iron does indeed pose a challenge to measuring manganese, but it is met by using an<br />
X-ray detector with a response width significantly less than the energy difference between the iron and<br />
manganese peaks as demonstrated in Figure 5 <strong>of</strong> this proposal where the Mn peak (blue) clearly stands<br />
out above the low-energy tail <strong>of</strong> the iron peak (red)<br />
• Several reviewers suggested including an archaeologist in the study. First, the PI does in fact work<br />
closely with archaeologists whenever petroglyphs are involved. Indeed, he has worked with Winston<br />
Hurst, Abajo Archaeology, in the Bluff, Utah region, Leigh Grench, BLM Archaeologist for the Moab,<br />
Utah region, and Michael Bies, BLM Archaeologist for the Thermopolis, Wyoming region. Second, at<br />
this early stage in the development <strong>of</strong> the method the proposed work is more physics and geomorphology<br />
than archaeology. Indeed, the validation studies proposed in this submission will primarily involve nonarchaeological<br />
features such as alluvial fans and other geological features where archaeological context is<br />
not relevant. Nevertheless, it still belongs in the Archaeometry program because the principal eventual<br />
application is archaeological.<br />
• Several reviewers commented that the proposed work was “risky”. This is entirely fair; this is a new<br />
method that, while promising, has many sources <strong>of</strong> error that are not yet quantified. It may not<br />
work well enough to be consistently useful, but we won’t know until the uncertainties are identified<br />
and quantified. This constitutes the principal focus <strong>of</strong> the new proposal. The project duration was<br />
reduced from three years to two years to allow a demonstration <strong>of</strong> the feasibility <strong>of</strong> the method on<br />
non-archaeological features before using it in archaeological contexts as part <strong>of</strong> a possible follow-up<br />
proposal.<br />
Introduction<br />
Petroglyphs or rock art, consisting <strong>of</strong> pecked, scratched, or painted images, on rock surfaces comprises<br />
an important class <strong>of</strong> archaeological features. Rock art is distributed world wide and is especially prevalent<br />
around the Colorado Plateau (Cole, 2009). The many subjects, styles, and themes provide glimpses into the<br />
life, behaviors and customs <strong>of</strong> the prehistoric (and historic) peoples who created them. Rock art is widely<br />
distributed geographically and is composed <strong>of</strong> a broad sweep <strong>of</strong> themes relating to essentially everything <strong>of</strong><br />
social significance: hunting, religion, ritual, agriculture, warfare, birth, water, migration, and much more.<br />
As such, rock art holds the promise <strong>of</strong> providing valuable information about ancient cultures, including their<br />
customs, beliefs, migration, activities, and cultural affiliations. However, to fully realize this promise, an<br />
accurate and non-destructive method to date them is needed.<br />
There are presently several techniques used to attempt to date petroglyphs which can be broadly categorized<br />
as direct and indirect. For a review <strong>of</strong> rock art dating methods see Chapter 5 in Francis and Loendorf<br />
(2002). Relative dates can be discerned through superimposition and through relative levels <strong>of</strong> re-patination<br />
although Dorn (2007) warns against this practice due to micro-environmental diversity and other effects.<br />
Themes and styles can also provide approximate dates principally through association with dateable artifacts<br />
<strong>of</strong> similar theme located nearby. Direct physical dating <strong>of</strong> rock art has been attempted using a variety <strong>of</strong><br />
methods including atomic mass spectroscopy (AMS) measurements <strong>of</strong> 14C, Particle-induced X-ray Excitation<br />
(PIXE), analysis <strong>of</strong> (K+Ca)/Ti cation ratios, and studies <strong>of</strong> micro-laminations in the desert varnish (Dorn,<br />
1
1981,1989, 1994, 1998a-b, 2007). There are some successes with these approaches, but some cautionary tales<br />
as well (Beck, 1998). The major drawbacks to these methods is their cost and the requirement for a physical<br />
sample to be extracted from the petroglyph which, though usually small, damages the feature.<br />
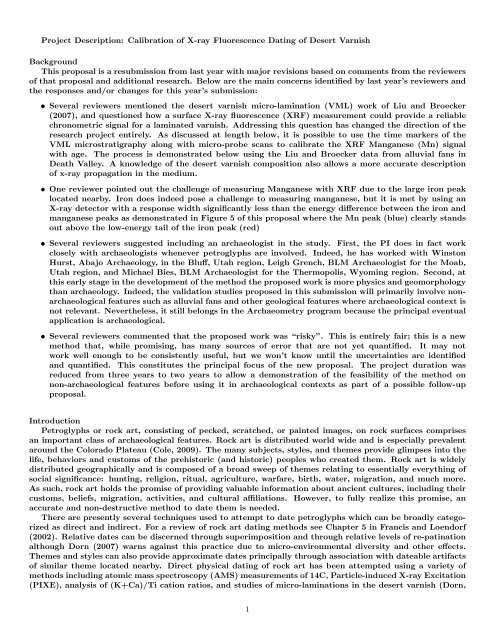
Figure 1. <strong>Varnish</strong> micro-lamination sample from Death Valley (reproduced from Liu and Broecker, 2007a,<br />
Figure 9C ).<br />
Dorn and Liu (1996) and Liu and Broecker (2007b) and showed that thin sections (∼30 µm) <strong>of</strong> desert<br />
varnish showed laminations that could be correlated with climate events such as the Younger Dryas and<br />
Heinrich events; however these early studies showed no laminate structure in the Holocene which is the<br />
primary time frame needed for petroglyphs <strong>of</strong> the southwestern United States. A major breakthrough<br />
came with the development by T. Liu <strong>of</strong> “ultra-thin” (∼5-15 µm) sectioning techniques that revealed 12<br />
identifiable laminations in the Holocene. Figure 1 shows one example from an alluvial van in Death Valley.<br />
Subsequently, T. Liu and W. Broecker (2007a) were able to identify several <strong>of</strong> these laminations with specific<br />
regional climate events enabling dates to be correlated with these laminations as shown in Figure 2. They<br />
tested their method on the geological features that could be independently dated such as alluvial fan debris<br />
and found consistent lamination patterns in samples taken over a wide area indicating a regional effect at<br />
work.<br />
The present work intends to build on this breakthrough by using micro-scans <strong>of</strong> the ultra-thin sections<br />
<strong>of</strong> samples taken from background varnish near the target feature to correlate Mn/Ba levels with dates in<br />
that local environment thereby enabling one to date the feature with a non-destructive X-ray fluorescence<br />
measurement <strong>of</strong> the Mn/Ba levels. The first pro<strong>of</strong>-<strong>of</strong>-principle application will be to date the same alluvial<br />
fans in Death Valley that Liu and Broecker studied but using <strong>XRF</strong> instead <strong>of</strong> direct examination <strong>of</strong> varnish<br />
samples.<br />
Despite the admonishments <strong>of</strong> Dorn (2007), Lytle et al. (2003, 2009) used portable X-ray fluorescence<br />
(<strong>XRF</strong>) experiments to measure the level <strong>of</strong> manganese accumulation in petroglyphs <strong>of</strong> the southwest which,<br />
if the manganese level can be correlated to known dates, could provide a means to estimate the age <strong>of</strong> the<br />
rock art. They used a commercial <strong>XRF</strong> machine with a measurement area <strong>of</strong> approximately 1 cm 2 , and thus<br />
could only be used an petroglyphs with pecked areas this size or larger. The fundamental method relies on<br />
the peculiar fact that desert varnish, the dark pigment that accumulates on rock surfaces throughout the<br />
desert southwest, is unusually rich in manganese while the underlying base rock generally contains very little<br />
<strong>of</strong> it.<br />
Dorn (1981) found that the manganese accumulates through a metallogenic microbial process. Since the<br />
underlying rock is poor in manganese, the manganese must arrive on the rock surface as dust from elsewhere<br />
which is then greatly concentrated by the metallogenic microbes. However, this process is poorly understood<br />
and other processes that transport or process Mn may be involved. The study <strong>of</strong> this process is intrinsically<br />
interdisciplinary involving geochemistry, microbiology, and climatology. The operating assumption <strong>of</strong> Lytle,<br />
et al. is that when a glyph is pecked onto a rock surface, the patina is removed and the manganese accumulation<br />
process begins anew. Over time the Mn accumulation darkens the glyph, eventually returning it to<br />
the same color as the background desert varnish. As biological processes are involved, growth rates can be<br />
highly variable, depending on micro environmental conditions such as moisture, dust, surface orientation and<br />
texture, over/under hang, etc. Furthermore, manganese oxide can also catalyze further manganese oxidation<br />
which competes with the microbiological process for reduced Mn radicals. In addition the pecked surface <strong>of</strong><br />
petroglyphs are more susceptible to erosion and spalling further complicating the process <strong>of</strong> correlating Mn<br />
levels to age.<br />
2
Figure 2. Liu and Broecker assignments <strong>of</strong> dates to Holocene laminations in desert varnish. (reproduced<br />
from Liu and Broecker, 2007a, Figure 8).<br />
Lytle, et al. used several independent data to correlate their Mn measurements to dates determined<br />
though other methods including cosmogenic 10 Be and 26 Al levels as well as geologically significant events<br />
such as the Bonneville Flood at 14,300 BP. They reported an approximately linear correlation between age<br />
and Mn accumulation. By using a Mn thin-film target <strong>of</strong> known thickness, the Lytle, et al. calibration line was<br />
found to have a slope <strong>of</strong> approximately 130 years per µg/cm 2 <strong>of</strong> Mn on the surface. Lytle’s calibration curve<br />
extends to 35,000 BP with the youngest cosmogenic standards dating over 10,000 BP and their youngest<br />
geological standards dating to around 1500 - 3000 BP (these latter data are systematically below their<br />
calibration line, however). They further claim that their calibration line, corrected for surface slope effects,<br />
is universal, independent <strong>of</strong> location or base rock, a claim which seems problematic if applied in regions that<br />
display large local variability in desert varnish accumulation.<br />
Scientific Objectives<br />
The overall goal <strong>of</strong> the proposed work is to develop an analytic method based on non-destructive <strong>XRF</strong><br />
measurements to assign dates to petroglyphs building on the work <strong>of</strong> Liu and Broecker to use micro-scans<br />
<strong>of</strong> VML to create local calibrations in contrast to Lytle’s universal calibration. To realize this goal three<br />
scientific objectives must be met. The first objective is to demonstrate pro<strong>of</strong>-<strong>of</strong>-principle using the existing<br />
data. As demonstrated below, using the Liu and Broecker results, one can construct a Mn/Ba level versus<br />
time calibration curve. For example, using the data from an alluvial fan in Death Valley shown in Figure 1,<br />
one can construct such a calibration curve as described below. Subsequently, by taking <strong>XRF</strong> measurements<br />
<strong>of</strong> the same alluvial fans, one can associate an age with the Mn/Ba levels and compare with Liu and Broecker<br />
(2007).<br />
The second scientific objective is to establish the accuracy and reliability <strong>of</strong> the method by identifying and<br />
quantifying the various sources <strong>of</strong> error. These include, but are not limited to, the variance in the Mn/Ba<br />
pr<strong>of</strong>iles in the VML scans, the degree to which erosion corrupts the laminations and the variance associated<br />
with differential rates <strong>of</strong> erosion on a given rock face, the variance associated with micro structures, such<br />
as microbasins, in the desert varnish base rock. Meeting this objective will occupy to bulk <strong>of</strong> the proposed<br />
2-year effort as it requires collecting a large body <strong>of</strong> data from a variety <strong>of</strong> sources distributed throughout<br />
the southwest. The pioneering work <strong>of</strong> Liu and Broecker provides an excellent starting point.<br />
The third scientific objective is to determine the practical feasibility <strong>of</strong> using X-ray fluorescence (<strong>XRF</strong>)<br />
measurements <strong>of</strong> Mn/Ba in the specific application <strong>of</strong> determining absolute ages <strong>of</strong> petroglyphs and their<br />
associated errors based on the variances discovered in the second phase <strong>of</strong> work. In addition the assumption<br />
Liu and Broecker make for the threshold time <strong>of</strong> about 200 years before the onset <strong>of</strong> varnish formation can be<br />
3
examined using dated graffiti measurements where Mn accumulation above the base rock has been measured<br />
for glyphs as young as 60 years. Refining this assumption will be important for applications to petroglyphs<br />
under 1,000 years <strong>of</strong> age.<br />
Lytle, et al. used a commercial <strong>XRF</strong> machine using a radioactive source with a relatively large sampling<br />
area <strong>of</strong> about 1 cm 2 . However, many petroglyphs consist <strong>of</strong> pecked lines which are much smaller than this;<br />
so it was necessary to build a device with mm scale spatial resolution and a stable platform to allow for<br />
long count times. Such a device was constructed from <strong>of</strong>f-the-shelf components with a custom machined<br />
collimator, used a laptop to control the instruments and a battery/inverter system to enable it to operate<br />
in the field. It differs from commercial hand-held units enabling precise spatial resolution and long count<br />
times, and is the only such device in existence that we know <strong>of</strong>. Figure 3 shows the <strong>XRF</strong> head-unit <strong>of</strong> the<br />
device and Figure 4 shows it deployed at a petroglyph panel near Moab, Utah.<br />
Preliminary field work with this device have demonstrated “pro<strong>of</strong> <strong>of</strong> principle” in obtaining precise and<br />
reproducible Mn measurements from petroglyphs, graffiti, background patina, and bare base rock in the<br />
southwestern United States. To date measurements were taken from four sites near Moab, Utah (e.g. Figure<br />
4, at the Sand Island petroglyph site near Bluff, Utah, as well as several panels from Legend Rock, Wyoming.<br />
Figure 3. <strong>XRF</strong> head-unit mounted on the platform boom (left), and Principal Investigator, J. A. McNeil,<br />
with his <strong>XRF</strong> device deployed at the “Dancing Bear” site near Moab, Utah.<br />
Figure 4. A close up <strong>of</strong> the “Dancing Bear” petroglyph panel (left) and Sand Island panel (right) showing<br />
dated graffiti collocated with petroglyphs.<br />
As an example, Figure 5 shows the <strong>XRF</strong> spectrum for the “Nelson” graffito and two adjacent petroglyphs<br />
(“Bearpaw” and “Lobehead”) shown in Figure 4 (left). Spectra were analyzed by subtracting the background<br />
and fitting the peaks to gaussians using the Mathematica “FindFit” function (Wolfram, 2009). The spectrum<br />
<strong>of</strong> a 158 nm thick film <strong>of</strong> Mn deposited on a glass slide was used to calibrate the data to an absolute Mn area<br />
4
density given in mg/cm2. In this fashion the “Nelson” graffito <strong>of</strong> Figure 4 was found to contain about 2.49<br />
+/- 0.59 µg/cm 2 <strong>of</strong> Mn, the “Bearpaw” petroglyph was found to contain 33.23 +/- 0.65 µg/cm 2 <strong>of</strong> Mn, and<br />
the “Lobehead” petroglyph was found to contain 51.02 +/- 1.6 µg/cm 2 <strong>of</strong> Mn. (Quoted errors are statistical<br />
only at 90% confidence). Assuming that the graffito was indeed made in 1964, this yields a measured Mn<br />
accumulation time <strong>of</strong> about 18 years per µg/cm 2 <strong>of</strong> Mn. If we assume a strictly linear Mn accumulation<br />
model and ignore attenuation, this would date the “Bearpaw” petroglyph at only about 600 years and the<br />
“Lobehead” petroglyph at about 930 years. These dates appear too young for the syles. It turns out that<br />
attenuation effects can alter these dates as discussed below.<br />
Lobehead<br />
Bearpaw<br />
Graffito<br />
Figure 5. Close-up <strong>of</strong> the <strong>XRF</strong> spectra in the Mn region for the “Harley Nelson” graffito and the “Lobehead”<br />
and “Bear Paw” petroglyphs immediately to right <strong>of</strong> the graffiti as shown in Figure 4. The red curve shows<br />
the tail <strong>of</strong> the Fe peak at 6.4 keV, the cyan curve is the gaussian fit to the Mn peak, the green curve is the<br />
gaussian fit to the Sm contribution (a small amount <strong>of</strong> which was detected in the base rock), and the blue<br />
curve is the sum.<br />
Calibration using VML<br />
While these preliminary results confirm the feasibility <strong>of</strong> measuring low levels <strong>of</strong> Mn (similar results hold<br />
for Ba as well) in desert varnish in the field, the bigger challenge is to convert these measurements into<br />
reliable dates. As discussed previously, there are problems with a linear extrapolation <strong>of</strong> graffiti data; so an<br />
alternative calibration method is proposed based on the desert varnish microstratigraphy studies <strong>of</strong> Liu and<br />
Broecker. Figure 6 shows one <strong>of</strong> Liu and Broeker’s micro-lamination samples from Death Valley along with<br />
a micro-scan showing Mn concentration as a function <strong>of</strong> depth. Similar data could be obtained for other<br />
elements as well.<br />
Figure 6. Microlamination sample and Mn concentration micro-scan <strong>of</strong> a sample from Death Valley (reproduced<br />
from Liu and Broecker (2007b), Figure 5A).<br />
5
A Mn level versus Age calibration curve can be obtained as follows. A mathematical representation <strong>of</strong> the<br />
Mn concentration pr<strong>of</strong>ile shown in Figure 6 was obtained using a nonlinear interpolation function shown as<br />
the solid line connecting the red points in Figure 7. Using the Mn versus depth pr<strong>of</strong>ile and energy-dependent<br />
mass attenuation coefficient data, the attenuation <strong>of</strong> the x-ray beam is modeled, and the effective Mn signal<br />
as a function <strong>of</strong> depth is calculated. (See the Appendix for details.) Figure 7 shows the bare Mn level versus<br />
depth (red) along with the effective Mn level (green) expected from an <strong>XRF</strong> surface probe at low voltage<br />
(10 kV) using the attenuation model described in the Appendix. The attenuation substantially reduces the<br />
contribution to the <strong>XRF</strong> signal from Mn in the deeper levels <strong>of</strong> the varnish for this relatively thick (∼60 µm)<br />
varnish. The attenuation-corrected Mn level is then integrated to give the total Mn expected in an <strong>XRF</strong><br />
measurement <strong>of</strong> the desert varnish background.<br />
Figure 7. Mn level in the Death Valley VML sample shown in Figure 6 (red) along with the effective Mn<br />
level (green) derived from including attenuation.<br />
Age yBP<br />
15 000<br />
10 000<br />
5000<br />
0<br />
Calibration <strong>of</strong> Measured Mn Level to Age<br />
0.0 0.2 0.4 0.6 0.8 1.0<br />
Mn background <br />
Figure 8. Calibration curve for determining age <strong>of</strong> a desert varnish sample in a Death Valley alluvial fan<br />
from its Mn level (measured as a fraction <strong>of</strong> that found in the calibration sample).<br />
Next, one assigns dates to the various layers using the Liu and Broecker (2007) microstratigraphy assignments<br />
shown in Figure 2 which gives an age versus depth function. Combining these to eliminate the<br />
depth dependence yields a calibration curve <strong>of</strong> age versus Mn level (now expressed as a fraction <strong>of</strong> the total<br />
integrated Mn in the background varnish) as shown in Figure 8. Note that the curve is reasonably linear for<br />
ages less than 5 kaBP. Using the example just described, an <strong>XRF</strong> measurement <strong>of</strong> the Mn in the background<br />
would imply an age <strong>of</strong> about 15 kaBP as that is the age <strong>of</strong> the desert varnish. Assuming that the desert<br />
varnish accumulated in the background rock at the same rate that it did in a nearby petroglyph, one can<br />
obtain an age for the petroglyph without taking a sample. This assumption can be tested using the alluvial<br />
fans in Death Valley already dated by Liu and Broecker. For a hypothetical example, if one were to measure<br />
the Mn in a sample <strong>of</strong> desert varnish in a petroglyph in the vicinity <strong>of</strong> the sample used for the background<br />
calibration and find, say, 20% <strong>of</strong> that found in the calibration sample, then the calibration curve would yield<br />
an age for the desert varnish <strong>of</strong> approximately 1500 yBP.<br />
6
One can use the attenuation model to correct the graffiti-calibrated dates in an approximate fashion in the<br />
absence <strong>of</strong> a background VML sample. Although we don’t have a VML sample from the previously studied<br />
“Dancing Bear” panel, one can approximate the effect <strong>of</strong> attenuation to correct the linear calibration model<br />
with a few reasonable assumptions. For example, suppose the desert varnish is composed <strong>of</strong> 70% silica, 10%<br />
hermatite, and 10% birnessite, then averaging over the energy spectrum <strong>of</strong> the x-ray source for the incoming<br />
beam and using the Mn Kα energy for the exiting x-ray, one calculates an effective attenuation coefficient <strong>of</strong><br />
0.03 µm −1 . Folding this into a uniform accumulation model, increases the calculated age <strong>of</strong> the “Bearpaw”<br />
petroglyph from 600 years to about 700 years and the “Lobehead” petroglyph from 930 years to 1200 years.<br />
As expected, the attenuation effect is more pronounced for the older glyph.<br />
The VML calibrations may also help us to understand the linear Mn versus time calibration curve <strong>of</strong><br />
Lytle, et al. Recall that his linear calibration constant was approximately 130 years/(µg/cm 2 ). First we note<br />
that the attenuation-corrected Mn versus age curve derived from the Death Valley VML scan (Figure 8) is<br />
indeed fairly linearly over the first 5,000 years. As yet no <strong>XRF</strong> measurements have been made <strong>of</strong> the Death<br />
Valley alluvial fan, but if we guess that the <strong>XRF</strong> signal for the background varnish will be about the same<br />
as that in the “Dancing Bear” panel, one finds a calibration constant <strong>of</strong> about 105 years/(µg/cm 2 ), close to<br />
Lytle’s value.<br />
It is fairly easy to perform such manipulations; however it is quite a different matter to quantify the<br />
uncertainty in the results. There are (at least) three major sources <strong>of</strong> error which make this entire enterprise<br />
somewhat <strong>of</strong> high risk in nature. Indeed the bulk <strong>of</strong> the effort expended in carrying out this proposal will<br />
be to identify and quantify the sources <strong>of</strong> error relying mostly on geological (non-archaeological) samples.<br />
First, the variance in the Mn measurements for a given petroglyph or background must be quantified. It<br />
is well known that a given petroglyph or background can show wide variation in the degree <strong>of</strong> patination over<br />
its area. One must develop objective criteria for consistently selecting or rejecting measurement locations<br />
and quantify the resulting variance.<br />
Second, one must show that one can in fact resolve the micro-laminations in the background patina<br />
associated with petroglyphs or other geological features that one wishes to date. Liu selects his samples<br />
from “microbasins” which shield the varnish therein from erosion. It may be that erosion damages the<br />
microlaminations in “generic” (e.g. not within a microbasin) background patina to the degree they cannot<br />
be resolved. If the microlaminations are in fact seriously degraded by erosion and not visible in the generic<br />
background varnish, then one will be forced to follow Liu in taking samples only from specially selected<br />
“microbasins”. (Obviously, the size <strong>of</strong> the X-ray probe beam cannot be larger than the microbasin ( 1 mm),<br />
but this problem has already been solved using a machined collimator.) If the background sample is taken<br />
from such a microbasin, then the measurement on the petroglyph must come from a similarly configured<br />
microbasin as well or the assumption that the varnish growth is the same in both is called into question.<br />
These assumption can be quantifiably tested on the alluvial fans at Death Valley.<br />
Third, since the spatial scale over which the <strong>XRF</strong> and micro-probe measurements differ by an order <strong>of</strong><br />
magnitude or more, one must examine the variance in the micro-probe elemental analysis in order to quantify<br />
the uncertainty in the Mn (Ba) versus depth function which will propagate errors to the calibrations. This<br />
can be done by taking many scans and performing the necessary statistical analysis on the results and<br />
propagating the errors to the final calibration curve. We note however that since only the fraction <strong>of</strong> the<br />
total Mn within the lamination date markers are relevant, one could have widely varying total Mn levels but<br />
still have similar fractional Mn values between date markers, yielding a stable and reproducible calibration.<br />
Only a detailed micro-probe analysis will determine if this is indeed the case.<br />
Research Plan<br />
The proposed calibration method is grounded in the pioneering work <strong>of</strong> Liu and Broecker who showed that<br />
southwestern USA desert varnish created in the Holocene is composed <strong>of</strong> laminations that can be correlated<br />
to climate events thereby providing a chronometry. They validated their use <strong>of</strong> this microstratigraphy in<br />
several geological contexts including alluvial fan deposits in Death Valley. The obvious first task then is to<br />
return to that site and perform <strong>XRF</strong> measurements <strong>of</strong> the same features.that Liu and Broecker have already<br />
dated. T. Liu has provided the location <strong>of</strong> the Death Valley alluvial fan on which their chronometric analysis<br />
was performed. The desert varnish from the various locations on the fan can then be tentatively dated using<br />
the single Mn microprobe results from Liu and Broecker using the calibration curve given in Figure 8. If<br />
this project is funded, this portion <strong>of</strong> the field work will be carried out in the summer <strong>of</strong> 2011.<br />
However, it is unlikely that their single scan <strong>of</strong> 1 mm width will coincide with the <strong>XRF</strong> average taken<br />
over 1 mm (as described in research issue three above); so additional microprobe analysis will be needed<br />
requiring new VML samples. Therefore, additional varnish samples will be collected in order to reproduce<br />
7
the Liu and Broecker results as well as provide a statistically accurate mapping <strong>of</strong> the Mn level with depth.<br />
Liu has provided detailed instructions on how he prepares ultra-thin sections. In this regard the PI will<br />
be assisted by J. Skok, Coordinator <strong>of</strong> the CSM Thin Section Laboratory as well as J. Chandler, Manager<br />
the CSM Electron Microscopy Laboratory (http://metallurgy.mines.edu/equipment.htm). This work will be<br />
carried out at CSM largely during the academic year for which no additional PI salary is needed, but funds<br />
are requested for an undergraduate student to assist in sample preparation and microprobe analysis. An<br />
additional benefit <strong>of</strong> this portion <strong>of</strong> the proposed work is that if this effort is successful, a second laboratory<br />
with VML capability will become available to complement that <strong>of</strong> T. Liu. As the AMS expert, Marvin Rowe,<br />
is fond <strong>of</strong> pointing out: when it comes to dating, the more laboratories doing the measurements, the better!<br />
Research will continue in the 2011-2012 academic year which will also be used to perfect sample preparation<br />
procedures, prepare thin-section samples, run them through electron microscopy, perform data extraction<br />
and error propagation analysis, refine and validate attenuation modeling, and plan for summer 2012<br />
field work as well as prepare a paper and a presentation for the April 2012 SAA meeting in Memphis.<br />
Based on the findings from the Death Valley alluvial fans, the data production and analysis will be refined<br />
requiring follow-up validation. The summer <strong>of</strong> 2012 is tentatively planned to involve taking measurements<br />
and samples from other dated alluvial fans and lava flows. Table 2 in Liu and Broecker (2007) lists several<br />
additional candidates that span the middle to late Holocene including Trail Canyon (540 - 6,260 yBP) and<br />
Leidy Creek (1,600-5,010 yBP). The 2012-13 academic year will involve the same analysis activities as the<br />
previous on the except on the samples taken from the field in 2012. In addition the PI will consult with<br />
Winston Hurst, Michael Bies, Leigh Grench, and other archaeologists to identify candidate petroglyph panels<br />
and seek the necessary permits to extract background varnish samples as part <strong>of</strong> a possible follow-up study<br />
to apply the method in archaeological contexts.<br />
Summary<br />
This proposal seeks NSF support for creating a new (mostly) non-destructive method to date the desert<br />
varnish <strong>of</strong> petroglyphs or geological features by building on the work <strong>of</strong> Liu and Broecker to VML as a<br />
calibration standard appropriate to the local environment. Archaeologists are not directly involved in this<br />
phase <strong>of</strong> the work as this is not yet an archaeological proposal; the work in this initial phase primarily involves<br />
physics and geomorphology. However, this work appropriately belongs in the Archaeometry program because<br />
special micro-sample methods must be perfected, and, if successful, this work will have its greatest value in<br />
archaeological applications. The bulk <strong>of</strong> the effort will involve sample collection, preparation, measurement<br />
and analysis to quantify the many uncertainties associated with the wide variability <strong>of</strong> desert varnish growth<br />
and erosion, and therefore it can rightly be considered “high risk”.<br />
The broader impacts <strong>of</strong> this work are to create a new VML capability at the Colorado School <strong>of</strong> <strong>Mines</strong> that<br />
would provide an independent laboratory for future dating studies, to train students in advanced analytic<br />
methods and data analysis, to foster interdisciplinary research between the “hard” and “s<strong>of</strong>t” sciences,<br />
to advance geomorphological understanding <strong>of</strong> desert varnish processes, and to provide a new tool to aid<br />
archaeologists in the study <strong>of</strong> ancient people and cultures <strong>of</strong> the American southwest.<br />
Plan for data sharing and dissemination A technical report <strong>of</strong> the experiment, data analysis method,<br />
and the resulting Mn levels for each sample measured will be written and archived at the Colorado School<br />
<strong>of</strong> <strong>Mines</strong> library. A publication will be submitted to an appropriate scholarly journal. If the method<br />
can be demonstrated to be reliable and accurate, publication in a major journal, such as Science, will be<br />
attempted. In addition, at least one presentation at a Society <strong>of</strong> American Archaeology meeting will be<br />
given. Presentations to rock art associations with broader public interest will also be given. The PI has<br />
prepared a report <strong>of</strong> his work at Sand Island for the Comb Ridge Heritage Initiative Project and given<br />
talks at the 2009 Utah Rock Art Research Association meeting in Cedar City and at the 2009 Four Corners<br />
Sectional meeting <strong>of</strong> the American Physical Society in Golden, Colorado.<br />
8
Appendix: Attenuation Model<br />
From a knowledge <strong>of</strong> the composition <strong>of</strong> the desert varnish as given for example in Figure 6, one can model<br />
the propagation <strong>of</strong> x-rays in the material. The x-ray propagation is treated in lowest order where multiple<br />
scatterings are ignored and the backscatter <strong>of</strong> the primary beam is treated via a background subtraction.<br />
Consider a small slab <strong>of</strong> desert varnish as shown in Figure 9 and focus on the Mn Kα response. The varnish<br />
has thickness, DV , with incident x-ray intensity, ϕ+(E, x), incoming from the left and with the Mn response<br />
at fixed energy, EMn = 5.9 keV, given by ϕ−(EMn, x), propagating to the left.<br />
Figure 9. Schematic <strong>of</strong> desert varnish slab (see discussion below).<br />
Suppose the depth-dependent mass pr<strong>of</strong>ile for each compositional component, i, is given by ρi(x) (g/cm 3 ).<br />
The energy-dependent mass attenuation coefficients, µi(E) (cm 2 /g), can be obtained from compilations<br />
such as McMaster, et al. (McMaster, 1969) or from modern web resources such as that maintained by<br />
the Center for Synchotron Radiation Research and Instrumentation <strong>of</strong> the Illinois Institute <strong>of</strong> Technology,<br />
(http://www.csrri.iit.edu/periodic-table.html). The compositional weighted attenuation coefficient for the<br />
forward propagating beam at location, x, for energy, E, is given by<br />
¯µ(E, x) = <br />
µi(E, x)ρi(x). (1)<br />
i<br />
The spectrum <strong>of</strong> the initial x-ray source intensity, ϕ(E, 0) when the tube voltage is below Kα excitation <strong>of</strong><br />
the production target is well approximated by the empirical relation <strong>of</strong> Kulenkampff (Tertian and Claisse,<br />
p. 38).<br />
ϕ+(E, 0) = NE 2 (E0 − E), (2)<br />
where E0 is the maximum energy given by the x-ray tube voltage and N is a constant. For the application<br />
at hand we can normalize the incoming intensity by the total integrated intensity from the maximum value,<br />
E0, to the K-edge for Mn, EK = 6.539 keV giving<br />
N = 12/(E 4 0 − 4E0E 3 K + 3E 4 K). (3)<br />
The change in the incoming intensity in passing through a thin section <strong>of</strong> width, dx, located at x is given<br />
by:<br />
dϕ+(E, x) = −¯µ(E, x)ϕ+(E, x)dx, (4)<br />
which gives the classic exponential fall-<strong>of</strong>f:<br />
ϕ+(E, x) = ϕ+(E, 0)e −<br />
x<br />
0 dx′ ¯µ(E,x ′ ) , (5)<br />
where ϕ+(E, 0) is given by Eq.(2). The change in the outgoing Mn response intensity in passing through the<br />
same thin section is given by:<br />
dϕ − (EMn, x) = −¯µ(EMn, x)ϕ − (EMn, x)dx + S(x)dx, (6)<br />
where the first term is the usual absorption effect and the second term is the source <strong>of</strong> Mn Kα x-rays arising<br />
from absorption <strong>of</strong> the incoming x-rays specifically on Mn, where ¯µMn(E, x) is the attenuation coefficient for<br />
energy, E, due to the Mn only in the desert varnish at location, x, giving,<br />
S(x) =<br />
E0<br />
EK<br />
dE ¯µMn(E, x)ϕ+(E, x), (7)<br />
9
where ϕ+(E, x) is given by Eq.(5). Assuming the baserock does not contain Mn (approximately true), the<br />
boundary condition is ϕ −(EMn, DV ) = 0 which gives:<br />
DV<br />
ϕ (EMn, x) =<br />
−<br />
x<br />
dx ′ S(x ′ ) e −<br />
x<br />
′<br />
x dx′′ ¯µ(EMn,x ′′ )<br />
, (8)<br />
where S(x) is given by Eq.(7). Note that the boundary condition is obviously satisfied. For the specific<br />
application to the desert varnish shown in Figure 6 reproduced from Liu and Broecker (2007) the Mn is<br />
assumed to be in birnessite (Mn2O4). The Mn versus depth pr<strong>of</strong>ile is extracted from Figure 6 (red dots<br />
in Figure 7) and fit to an interpolating function which is used in the integrations. To estimate the other<br />
compositional components not given in the Liu and Broecker scan an equal amount <strong>of</strong> hermatite (Fe2O3) is<br />
assumed with the remainder taken to be silica (SiO2). The energy dependent mass attenuation coefficients<br />
can be found in standard compilations such as McMaster, et al. (1969) or from web resources such as that<br />
maintained by the Center for Synchotron Radiation Research and Instrumentation <strong>of</strong> the Illinois Institute<br />
<strong>of</strong> Technology at URL: http://www.csrri.iit.edu/periodic-table.html. The energy dependence is fit to a sum<br />
<strong>of</strong> polynomials in the reciprocal energy, and then the needed integrals <strong>of</strong> Eq.(8) are performed to find the<br />
effective Mn response versus depth (green dots in Figure 7).<br />
10