Discharge Measurement and Rating Curve Development - Balwois
Discharge Measurement and Rating Curve Development - Balwois
Discharge Measurement and Rating Curve Development - Balwois

Create successful ePaper yourself
Turn your PDF publications into a flip-book with our unique Google optimized e-Paper software.
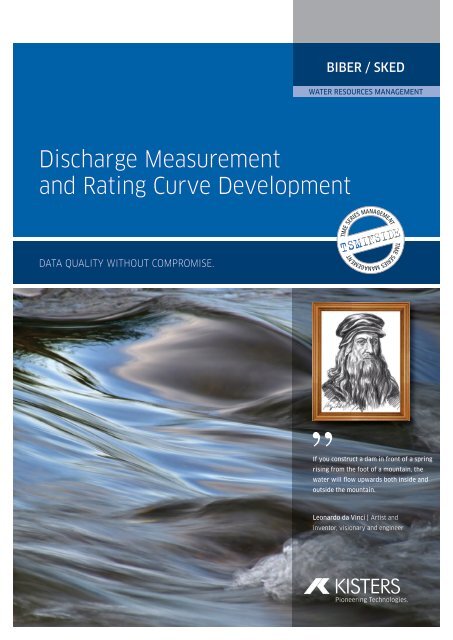
<strong>Discharge</strong> <strong>Measurement</strong><br />
<strong>and</strong> <strong>Rating</strong> <strong>Curve</strong> <strong>Development</strong><br />
Data quality without CoMpRoMise.<br />
BIBER / SKED<br />
WAtER REsouRcEs mAnAgEmEnt<br />
TIME SERIES MANAGEMENT<br />
If you construct a dam in front of a spring<br />
rising from the foot of a mountain, the<br />
water will flow upwards both inside <strong>and</strong><br />
outside the mountain.<br />
Leonardo da Vinci | Artist <strong>and</strong><br />
inventor, visionary <strong>and</strong> engineer
2<br />
A boat driven<br />
by a paddle wheel.<br />
For centuries ships were powered<br />
by the wind or the considerable use<br />
of human muscle. Leonardo da Vinci<br />
wanted to escape from this restriction,<br />
<strong>and</strong> designed a boat driven by a<br />
paddle wheel. using an elaborate gear<br />
mechanism <strong>and</strong> a flywheel, ships could<br />
be made to move forward using much<br />
less effort.<br />
BIBER <strong>and</strong> sKED:<br />
maximum data quality has no substitute.<br />
the quality of a rating curve often depends<br />
on the amount <strong>and</strong> quality of the<br />
available measurements. A distinct stagedischarge<br />
relationship can be depicted<br />
with relative ease on a rating curve.<br />
Hydraulically diversified <strong>and</strong> more complex<br />
correlations are often more difficult<br />
to illustrate, <strong>and</strong> only experts are able to<br />
transform such data into a rating curve.<br />
the evaluation of all available data,<br />
such as cross-sectional information <strong>and</strong><br />
changes, behaviour of vegetation <strong>and</strong><br />
civil works above or in the measuring<br />
cross section are necessary to translate<br />
the measured water level into the accompanying<br />
flow as precisely as possible.<br />
Likewise, comprehensive knowledge of<br />
the flow behaviour in the low, middle<br />
<strong>and</strong> high water ranges is required. timely<br />
data procurement can considerably influence<br />
the process of creating a rating<br />
curve under certain circumstances.<br />
Efficient <strong>and</strong> economical data procurement,<br />
storage <strong>and</strong> management requires<br />
software to be carried out efficiently.<br />
A specialised application is the only<br />
acceptable solution if data analysis is<br />
also necessary. BIBER <strong>and</strong> sKED are the<br />
two products in our range that specifically<br />
target these complex challenges.<br />
BiBeR allows discharge measurements to<br />
be recorded directly on site. any available<br />
measurement reports on completed flow<br />
measurements or measurement results can<br />
be entered into BiBeR through a wizard-supported<br />
manual entry system. evaluations<br />
of discharge measurements in compliance<br />
with the German “pegelvorschrift” (German<br />
Manual for water level Gauging <strong>and</strong><br />
<strong>Discharge</strong> <strong>Measurement</strong>s) <strong>and</strong> other international<br />
st<strong>and</strong>ards can be carried out within<br />
the BiBeR framework. evaluation results are<br />
presented concisely <strong>and</strong>, where appropriate,<br />
graphically. additional information <strong>and</strong> comments<br />
are also available to complement the<br />
flow characteristics, such as water level, flow,<br />
hydraulic radius or the profile value.<br />
the most important flow measurement<br />
evaluation results are available to you in<br />
sKeD for further analysis. a homogeneous<br />
data collective can be generated using a<br />
powerful filter, <strong>and</strong> an outflow curve can<br />
then be created through regression analysis<br />
on the basis of the resulting data. your rating<br />
curves, generated according to arbitrary
parameter conversions, can be managed in<br />
sKeD.<br />
since rating curves are managed in versions,<br />
you will never lose track of any rating curves<br />
used in the past. as an expert tool, sKeD<br />
offers comprehensive functions <strong>and</strong> wizards<br />
for the analysis of flow measurements, the<br />
setup of flow curves <strong>and</strong> the determination<br />
of validity. all conventional international<br />
rating curve types can be used in sKeD.<br />
Furthermore, sKeD offers tools to examine<br />
the quality of the generated rating curves.<br />
when used in conjunction with our wisKi<br />
water management system, rating curves <strong>and</strong><br />
validities generated in sKeD can be used to<br />
directly translate your water level values into<br />
discharge values.<br />
Evaluation procedures in BIBER<br />
BiBeR can provide gaugings of velocity<br />
measurements as well as various evaluations<br />
in graphical form. three procedures are available<br />
to determine the gaugings of a velocity<br />
measurement:<br />
spline interpolation according to the<br />
“pegelvorschrift” (German Manual for<br />
water level Gauging <strong>and</strong> <strong>Discharge</strong><br />
<strong>Measurement</strong>s, appendix D)<br />
Mean section procedure (iso748,<br />
appendix e)<br />
Mid section procedure (iso748,<br />
appendix e)<br />
<strong>Discharge</strong>s from the partial cross-section are<br />
displayed for all evaluation procedures, <strong>and</strong><br />
individual verticals may be excluded from<br />
the evaluation.<br />
BiBeR offers the following graphical<br />
evaluations:<br />
Measuring cross section with water level<br />
Measuring cross section with river bottom<br />
Measuring cross section with surface<br />
velocity<br />
Measuring cross section with velocity area<br />
(f v -line)<br />
Measuring cross section with h 3/2 line <strong>and</strong><br />
h 5/3 line<br />
Velocity distributions of individual<br />
verticals<br />
isotach diagram<br />
wet <strong>and</strong> dry profiles<br />
Comparison of current measurement with<br />
archived measurements <strong>and</strong> rating curves<br />
BIBER device manager<br />
the BiBeR device manager facilitates clear<br />
<strong>and</strong> simple management of sensors, current<br />
meters <strong>and</strong> their calibration equations as well<br />
as counters. you can configure your current<br />
meter from a selection of propellers, current<br />
meter bodies <strong>and</strong> centre pieces. simply<br />
enter your calibration equations <strong>and</strong> leave<br />
the continuity control to BiBeR. as well as<br />
Nautilus (by ott) <strong>and</strong> Flo-Mate (by Marsh<br />
McBirney) sensors, BiBeR is able to configure<br />
<strong>and</strong> manage sensors from any manufacturer.<br />
SKED direct measurement access<br />
sKeD has full access to BiBeR measurements.<br />
you can search for the appropriate selection<br />
of measurements needed to generate your<br />
rating curve by filtering on<br />
time range<br />
source value range<br />
target value range<br />
Meter<br />
team<br />
Raising / falling limb<br />
BIBER / SKED<br />
WAtER REsouRcEs mAnAgEmEnt<br />
Filter criteria can be sequentially applied<br />
<strong>and</strong> combined as necessary to derive the<br />
appropriate data set. Changes in the stagedischarge<br />
relation are easily recognised using<br />
cross-profiles. you can also blend in dry <strong>and</strong>/<br />
or wet profiles of the measurement.<br />
SKED analysis procedures<br />
let sKeD do the calculations. you can set<br />
regression ranges (bordering or overlapping)<br />
<strong>and</strong> select an appropriate regression process<br />
for each area. select from:<br />
linear regression<br />
power law function (solution via<br />
logarithms or according to the lauffer<br />
procedure)<br />
shifted power law function (solution via<br />
logarithms or according to the lauffer<br />
procedure)<br />
logarithmic regression<br />
polynomial of 1st to 5th order<br />
exponential function<br />
you can blend in the confidence interval for<br />
each segment <strong>and</strong> exclude single or multiple<br />
measurements from the regression.<br />
the regression range can be graphically<br />
altered, <strong>and</strong> the regression will be updated<br />
immediately. saving previous regression<br />
attempts improves the basis for comparison.<br />
you can go back a step at any time. areas<br />
that are only sparsely populated with<br />
measured data can be supplemented<br />
using construction points. Construction<br />
3
points influence regression just like actual<br />
measurements, but are clearly marked<br />
as construction points. you can choose<br />
between two forcing points to influence your<br />
regression results: one for high water <strong>and</strong> one<br />
for low water ranges.<br />
SKED rating curve procedure<br />
For st<strong>and</strong>ard cross sections following the<br />
power law, appropriate regressions can<br />
be applied as a rating curve at the push<br />
of a button. Natural cross sections, in<br />
certain circumstances influenced by aquatic<br />
growth, show an irregular distribution of<br />
measurements. here, regression is often<br />
only appropriate as a suggestion. the rating<br />
curve itself is constructed manually. you can<br />
graphically insert any number of descriptor<br />
points, <strong>and</strong> sKeD will connect them linearly<br />
or through a spline. the descriptor points can<br />
be moved individually to precisely construct<br />
your rating curve.<br />
Confidence intervals can be statistically<br />
calculated as a deduction from the rating<br />
curve <strong>and</strong> displayed as a plausibility check<br />
for each rating curve version. Velocities of<br />
flow, as well as wet <strong>and</strong> dry profiles, can<br />
be displayed <strong>and</strong> calculated <strong>and</strong> product<br />
analyses of individual regression curves (e.g.<br />
median flow cross section <strong>and</strong> mean velocity)<br />
can be carried out.<br />
similarly, you can display large deviations<br />
from the measured values in comparison<br />
with the rating curve. you can preview the<br />
relevant flow time series before your rating<br />
curve is released for flow calculation.<br />
BIBER / SKED<br />
WAtER REsouRcEs mAnAgEmEnt<br />
The roots of technical drawing<br />
the discoveries which<br />
Leonardo da Vinci<br />
recorded in his notebooks<br />
between 1452<br />
<strong>and</strong> 1519 are world<br />
famous. However,<br />
it was the style <strong>and</strong><br />
accuracy in which he recorded his<br />
thoughts which characterised his great<br />
underst<strong>and</strong>ing <strong>and</strong> marked a historic step<br />
forwards.<br />
Da Vinci was the visionary behind<br />
modern technical drawing <strong>and</strong><br />
cartography.<br />
up to the 16th century, topographical<br />
maps showed what man believed was<br />
present, <strong>and</strong> not what was really there.<br />
While da Vinci’s contemporaries were<br />
firmly rooted in the middle Ages <strong>and</strong><br />
produced wildly inaccurate maps, da<br />
Vinci had already produced accurate<br />
cartographic drawings of tuscany, for<br />
example.<br />
these maps are the first evidence of<br />
modern cartography.<br />
KIstERs Ag<br />
E-mail: info@kisters.eu<br />
Homepage: http://www.kisters.eu<br />
© KIstERs Ag | 2007