Brian S. Everitt A Handbook of Statistical Analyses using SPSS
Brian S. Everitt A Handbook of Statistical Analyses using SPSS
Brian S. Everitt A Handbook of Statistical Analyses using SPSS

Create successful ePaper yourself
Turn your PDF publications into a flip-book with our unique Google optimized e-Paper software.
Correlatic friendly manner<br />
doubts about ability<br />
cold and impersonal<br />
reassurance<br />
examines me carefully<br />
not enough respect<br />
doubt about the treatment<br />
competent and well<br />
trained<br />
interest in me<br />
unanswered questions<br />
jargon<br />
confidence<br />
confide<br />
not free to ask questions<br />
Descriptive Statistics<br />
Mean Std. Deviation Analysis N<br />
friendly manner<br />
1.66 .781 64<br />
doubts about ability<br />
1.92 .997 64<br />
cold and impersonal<br />
1.77 .868 64<br />
reassurance<br />
2.09 1.019 64<br />
examines me carefully 1.94 .852 64<br />
not enough respect<br />
2.02 .934 64<br />
doubt about the treatment 2.27 1.043 64<br />
competent and well<br />
trained<br />
1.67 .757 64<br />
interest in me<br />
1.91 .955 64<br />
unanswered questions 2.27 1.144 64<br />
jargon<br />
2.48 1.141 64<br />
confidence<br />
1.94 .941 64<br />
confide<br />
1.88 .864 64<br />
not free to ask questions 1.81 .941 64<br />
Correlation Matrix<br />
friendly<br />
manner<br />
doubts<br />
about<br />
ability<br />
cold and<br />
impersonal<br />
1.000 .556 .628 .639 .516 .704 .445 .611 .786 .315 .554 .688 .624<br />
.556 1.000 .584 .460 .443 .513 .478 .681 .576 .631 .271 .723 .505 .424<br />
.628 .584 1.000 .348 .495 .494 .280 .437 .662 .399 .325 .507 .595 .334<br />
.639 .460 .348 1.000 .519 .515 .335 .431 .547 .550 .206 .486 .536 .466<br />
.516 .443 .495 .519 1.000 .540 .376 .558 .656 .538 .130 .629 .507 .381<br />
.704 .513 .494 .515 .540 1.000 .631 .636 .642 .575 .261 .615 .730 .581<br />
.445 .478 .280 .335 .376 .631 1.000 .494 .344 .645 .224 .470 .443 .505<br />
.611 .681 .437 .431 .558 .636 .494 1.000 .703 .615 .242 .751 .495 .492<br />
.786 .576 .662 .547 .656 .642 .344 .703 1.000 .619 .174 .700 .659 .528<br />
.566 .631 .399 .550 .538 .575 .645 .615 .619 1.000 .253 .665 .532 .563<br />
.315 .271 .325 .206 .130 .261 .224 .242 .174 .253 1.000 .310 .240 .234<br />
.554 .723 .507 .486 .629 .615 .470 .751 .700 .665 .310 1.000 .654 .507<br />
.688 .505 .595 .536 .507 .730 .443 .495 .659 .532 .240 .654 1.000 .557<br />
.624 .424 .334 .466 .381 .581 .505 .492 .528 .563 .234 .507 .557 1.000<br />
reassurance<br />
examines<br />
me<br />
carefully<br />
not<br />
enough<br />
respect<br />
doubt about competent<br />
the and well<br />
treatment trained<br />
interest<br />
in me<br />
unanswered<br />
questions<br />
jargon confidence confide<br />
not free<br />
to ask<br />
questions<br />
.566<br />
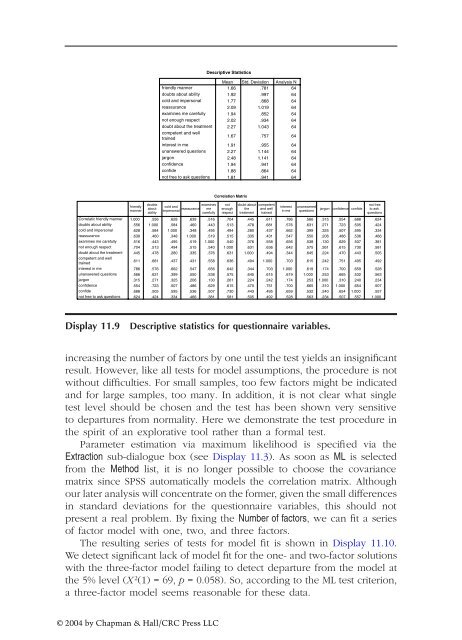
Display 11.9 Descriptive statistics for questionnaire variables.<br />
increasing the number <strong>of</strong> factors by one until the test yields an insignificant<br />
result. However, like all tests for model assumptions, the procedure is not<br />
without difficulties. For small samples, too few factors might be indicated<br />
and for large samples, too many. In addition, it is not clear what single<br />
test level should be chosen and the test has been shown very sensitive<br />
to departures from normality. Here we demonstrate the test procedure in<br />
the spirit <strong>of</strong> an explorative tool rather than a formal test.<br />
Parameter estimation via maximum likelihood is specified via the<br />
Extraction sub-dialogue box (see Display 11.3). As soon as ML is selected<br />
from the Method list, it is no longer possible to choose the covariance<br />
matrix since <strong>SPSS</strong> automatically models the correlation matrix. Although<br />
our later analysis will concentrate on the former, given the small differences<br />
in standard deviations for the questionnaire variables, this should not<br />
present a real problem. By fixing the Number <strong>of</strong> factors, we can fit a series<br />
<strong>of</strong> factor model with one, two, and three factors.<br />
The resulting series <strong>of</strong> tests for model fit is shown in Display 11.10.<br />
We detect significant lack <strong>of</strong> model fit for the one- and two-factor solutions<br />
with the three-factor model failing to detect departure from the model at<br />
the 5% level (X 2 (1) = 69, p = 0.058). So, according to the ML test criterion,<br />
a three-factor model seems reasonable for these data.<br />
© 2004 by Chapman & Hall/CRC Press LLC