Furuno vx2 - Jeppesen
Furuno vx2 - Jeppesen
Furuno vx2 - Jeppesen

You also want an ePaper? Increase the reach of your titles
YUMPU automatically turns print PDFs into web optimized ePapers that Google loves.
Optimize Chart Presentation<br />
Your chart plotter was shipped with default settings for<br />
normal operation. With some simple setting changes, the chart<br />
presentation may be customized for specific applications, such<br />
as sport or commercial fishing.<br />
The <strong>vx2</strong> offers a simple chart configuration to change the<br />
display selection: FULL, MEDIUM, LOW and CUSTOM (allows<br />
user to select personal preferences). If you feel you are missing<br />
important chart data select FULL view.<br />
Below are some recommended setups to optimize your chart<br />
plotter display when in CUSTOM CONFIGURATION:<br />
Go to MENU > CHART SET UP > CHART CONFIGURATION > CUSTOM<br />
FEATURE DEFAULT RE-SET TO<br />
Perspective Off ON<br />
DeClutter On OFF<br />
Chart Display Mode Custom no change<br />
Safety Status Off no change<br />
Waypoint Plotter/Overlay no change<br />
Waypoint Name Plotter/Overlay no change<br />
Names Plotter/Overlay no change<br />
Buoy Names Off PLOTTER/OVERLAY<br />
NavAids US no change<br />
Light Sectors Plotter/Overlay FLASHING<br />
Attention Areas Plotter/Overlay OFF<br />
Tides & Currents Plotter/Overlay no change<br />
Seabed Type Plotter/Overlay OFF<br />
Ports & Services Plotter/Overlay no change<br />
Tracks & Routes Plotter/Overlay OFF<br />
Underwater Objects Plotter/Overlay no change<br />
Rivers & Lakes Plotter/Overlay no change<br />
Land Features Plotter/Overlay no change<br />
Lat/Long Grid Off no change<br />
Chart Boundaries Plotter OFF<br />
Mixing On no change<br />
Chart Level Unlock no change<br />
Depth Configuration Auto Manual<br />
continued...<br />
Optimize Chart Presentation (cont.)<br />
Display Presentation > In the depth configuration menu is the ability to set depth<br />
shading by color. Changing the default setting from AUTO to MANUAL greatly<br />
enhances the presentation of depth contours. MENU > CHART SETUP > CHART<br />
CONFIG > (soft key) DEPTH CONFIG > DEPTH SHADING CONFIG > MANUAL<br />
Time Set-up > Local time reference for Tides, Current predictions and Time stamps<br />
on Marks and Waypoints. Base Time is Greenwich Mean Time (GMT/UTC). A time<br />
offset is required for Local time, MENU > SYSTEM CONFIG > GENERAL SETUP ><br />
LOCAL TIME > OFFSET (e.g. Eastern Standard - 5 hrs, Eastern Daylight Savings - 4 hrs)<br />
Course Vector > The default is Line, but we recommend changing it to Vector.<br />
MENU > PLOTTER SETUP > COURSE VECTOR<br />
Feature Comparison<br />
C-Map MAX vs. Navionics Gold+ Cartography<br />
FEATURES MAX Gold+<br />
Sirius Satellite Weather Overlay ü n/a<br />
Embedded Photos ü n/a<br />
Dynamic Currents and Tides ü n/a<br />
Flashing NavAids ü n/a<br />
Anti-Grounding Alarm (Guardian) ü n/a<br />
Safe Route Check ü n/a<br />
C-Marina Detailed Dock Plans ü n/a<br />
Points of Interest ü n/a<br />
Perspective View ü n/a<br />
Land Elevations ü n/a<br />
Safety Status Bar ü n/a<br />
Flexi-Zoom ü n/a<br />
B-Annual Chart Updates ü n/a<br />
Network Integration with MaxSea ü n/a<br />
Paper-Like Charts ü ü<br />
Seamless Cartography ü ü<br />
Safety Depths ü ü<br />
NavAid IDs ü ü<br />
Main and Coastal Roads ü ü<br />
Port Services ü ü<br />
PC Planning Compatibility ü ü<br />
*as identified on Navionics literature (May 2006)<br />
Get the most out of your chart plotter!<br />
C-Map by <strong>Jeppesen</strong><br />
<strong>Furuno</strong> <strong>vx2</strong><br />
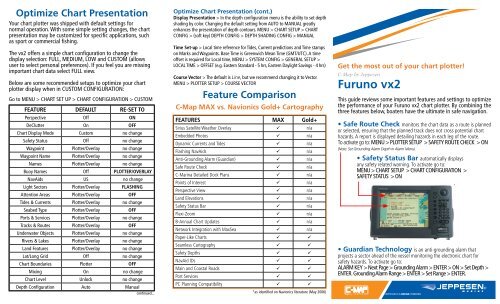
This guide reviews some important features and settings to optimize<br />
the performance of your <strong>Furuno</strong> <strong>vx2</strong> chart plotter. By combining the<br />
three features below, boaters have the ultimate in safe navigation.<br />
• Safe Route Check monitors the chart data as a route is planned<br />
or selected, ensuring that the planned track does not cross potential chart<br />
hazards. A report is displayed detailing hazards in each leg of the route.<br />
To activate go to: MENU > PLOTTER SETUP > SAFETY ROUTE CHECK > ON<br />
(Note: Set Grounding Alarm Depth in Alarm Menu).<br />
• Safety Status Bar automatically displays<br />
any safety related warning. To activate go to:<br />
MENU > CHART SETUP > CHART CONFIGURATION ><br />
SAFETY STATUS > ON<br />
• Guardian Technology is an anti-grounding alarm that<br />
projects a sector ahead of the vessel monitoring the electronic chart for<br />
safety hazards. To activate go to:<br />
ALARM KEY > Next Page > Grounding Alarm > ENTER > ON > Set Depth ><br />
ENTER. Grounding Alarm Range > ENTER > Set Range > ENTER.
Embedded Photos<br />
View photo images of inlets, marinas,<br />
harbors, lighthouses and other POIs. Move<br />
the cursor over a camera icon, press the<br />
knob for ENTER > Multimedia Content<br />
will be highlighted, select IMAGE using<br />
the hot key. For full screen image ><br />
ENTER.<br />
Perspective View<br />
Ideal when entering unfamiliar harbors. A<br />
perspective or “bird’s eye view” of the chart<br />
may be selected by using the MODE hot<br />
key. Note: Perspective View must be turned<br />
on in the CHART CONFIGURATION menu.<br />
Mode also offers North Up, Course Up and<br />
Perspective options for chart orientation.<br />
Streets, Roads and Points of<br />
Interest (POIs)<br />
Coastal roads, land elevations and Points<br />
of Interest for getting around an unfamiliar<br />
harbor easier.<br />
Safe Route Check<br />
This feature monitors the chart data ahead as a route is planned or<br />
selected, ensuring that the planned track does not cross potential chart<br />
hazards. A report is displayed detailing hazards in each leg of the route.<br />
MENU > PLOTTER SETUP > SAFE ROUTE CHECK > ON.<br />
Let the power of MAX bring your chart plotter to life!<br />
jeppesen.com/lightmarine<br />
Grounding Alarm<br />
When activated, a “search light” alarm<br />
area will lookout in advance of the boat<br />
and check chart data for depth and land<br />
area obstructions. An audible alarm sounds<br />
and a dialog box appears on the screen if<br />
your boat is in danger. Set the safe draught<br />
for your boat and ground alarm range<br />
dependent on boat speed (.5nm is typical). ALARM key > Next Page ><br />
Grounding Alarm > ENTER > ON > Set Depth > ENTER.<br />
Grounding Alarm Range > ENTER > Set Range > ENTER.<br />
Port Services<br />
Huge database of different marine services<br />
such as: Fuel Stations, SeaTow locations,<br />
Sail Maker (for repairs) and local Harbor<br />
Masters. Toggle through to find a load<br />
of helpful information. Place cursor over<br />
PORT icon > ENTER > FIND > scroll to Port<br />
Service > ENTER.<br />
C-Marina Charts<br />
Many marinas have highly detailed<br />
drawings showing docks and facility<br />
information. To locate, turn the<br />
Chart Boundaries ON in the CHART<br />
CONFIGURATION menu. A small chart<br />
boundary will be shown around the area of<br />
the marina.<br />
Safety Status Bar<br />
This menu bar automatically displays any safety related warning.<br />
MENU > CHART SETUP > CHART CONFIGURATION > SAFETY STATUS > ON.<br />
Tide Stations<br />
Place your cursor on a T icon and hit ENTER, then ENTER again to bring<br />
up the tidal graph. Press DATE to change to a different date. Search<br />
for other near by Tide Stations by pressing ENTER > FIND, scroll to Tide<br />
Stations, > ENTER.<br />
In order to demonstrate the following MAX features, the unit should have<br />
a GPS fix or be in simulation mode. To enable the simulation mode go to:<br />
MENU > SYSTEM CONFIGURATION > SYSTEM SET UP > SIMULATION.<br />
Enter Lat and Long to position vessel. Enter speed and heading if desired.<br />
Flashing NavAids<br />
This setting will bring your NavAids to life.<br />
When turned ON, the NavAids will flash<br />
on the chart based on their signal and<br />
period, as long as your GPS fix is within<br />
the specified visibility of the range of the<br />
NavAids. MENU > CHART SETUP > CHART<br />
CONFIG. > LIGHT SECTORS > FLASHING.<br />
Dynamic Currents<br />
Place cursor on any current arrow vector<br />
and a dialog box opens giving speed,<br />
velocity, date and time of current. The<br />
current vectors automatically change<br />
direction and color based on time and<br />
current flow.<br />
Current Predictions > With the cursor on<br />
the vector, press the knob for ENTER. You<br />
may now use the hot keys to set a specific time or advance/decrease the<br />
time in one hour increments.