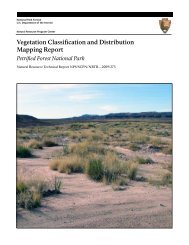
- Page 1 and 2: National Park Service U.S. Departme
- Page 3 and 4: ___________________________________
- Page 5 and 6: Contents Figures...................
- Page 7: Figures Figure 1. South Florida / C
- Page 11: Appendices Appendix A: Vegetation C
- Page 15: Summary The National Park Service V
- Page 18 and 19: Figure 1. South Florida / Caribbean
- Page 21 and 22: Methods Project Overview SFCN condu
- Page 23: esolution and converted to 8-bit ra
- Page 27: Level_3 = Virgin Islands Sub-format
- Page 30 and 31: visited and confirmed. We note that
- Page 32 and 33: 16 Figure 4. Vegetation mapping cel
- Page 34 and 35: 18 Figure 6. Map of classified vege
- Page 36 and 37: Table 2. Additional Description of
- Page 38 and 39: 22 Table 6. Vegetation mapping clas
- Page 41: Literature Cited Acevedo-Rodriguez,
- Page 44 and 45: VII. SPARSE VEGETATION.............
- Page 46 and 47: sandy substrate, in close proximity
- Page 48 and 49: This community encompasses a large
- Page 50 and 51: III.A.1.N.g. Semi-permanently flood
- Page 52 and 53: stage to taller woodland or dry for
- Page 54 and 55: XX. HIERARCHY PLACEMENT UNDETERMINE
- Page 56 and 57: Appendix B: Photointerpretation Key
- Page 58 and 59: Semi-deciduous Forest Virgin Island
- Page 60 and 61: Semi-deciduous Forest Virgin Island
- Page 62 and 63: Semi-evergreen Forest Virgin Island
- Page 64 and 65: Semi-deciduous Woodland Virgin Isla
- Page 66 and 67: Semi-deciduous Woodland Virgin Isla
- Page 68 and 69: Coastal Evergreen Shrubland Virgin
- Page 70 and 71: Fringing Mangrove Virgin Islands Su
- Page 72 and 73: Mixed Dry Shrubland Virgin Islands
- Page 74 and 75:
Mixed Dry Shrubland Virgin Islands
- Page 76 and 77:
Thicket/scrub Virgin Islands Sub-fo
- Page 78 and 79:
Rock Pavement Virgin Islands Sub-fo
- Page 80 and 81:
Beach Virgin Islands Sub-formation
- Page 82 and 83:
Developed Area Virgin Islands Sub-f
- Page 84 and 85:
Disclaimer * This is a list of vege
- Page 86 and 87:
Contents Introduction..............
- Page 88 and 89:
Scientific Name to Common Names Lis
- Page 90 and 91:
Common Name Scientific Name arana g
- Page 92 and 93:
Index of Species Alphabetically Aca
- Page 94 and 95:
Index of Species based on Form & Fa
- Page 96 and 97:
Herbs..............................
- Page 98 and 99:
Plumeria alba NPS EPMT Common pigeo
- Page 100 and 101:
Pilosocereus royenii NPS EPMT Commo
- Page 102 and 103:
Conocarpus erectus NPS SFCN Common
- Page 104 and 105:
Common fish poison tree Form Tree F
- Page 106 and 107:
Eugenia rhombea Pedro Acevedo-Rodri
- Page 108 and 109:
Sideroxylon obovatum NPS BUIS Commo
- Page 110 and 111:
NPS Vegetation Mapping Inventory Pr
- Page 112 and 113:
Tecoma stans NPS EPMT Common basora
- Page 114 and 115:
Melocactus intortus NPS SFCN Common
- Page 116 and 117:
Flueggea acidoton Reprinted from Fl
- Page 118 and 119:
Dalbergia ecastaphyllum NPS SFCN Co
- Page 120 and 121:
Eugenia procera NPS SFCN Common bli
- Page 122 and 123:
Melochia tomentosa NPS EPMT Common
- Page 124 and 125:
Duranta erecta NPS EPMT Common sage
- Page 126 and 127:
Sesuvium portulacastrum Common eyeb
- Page 128 and 129:
Psychilis macconnelliae NPS EPMT Co
- Page 130 and 131:
Sporobolus virginicus NPS BUIS Comm
- Page 132 and 133:
Tournefortia volubilis Photo by Ped
- Page 135 and 136:
Appendix E: Field Data Sheets Octob
- Page 137:
BUIS TRAINING POINTS FOR VEGETATION
- Page 140 and 141:
NPS Vegetation Mapping Inventory Pr
- Page 142 and 143:
A Guide to Caribbean Vegetation Typ
- Page 144 and 145:
Appendix One ......................
- Page 146 and 147:
Duane Kolterman University of Puert
- Page 148 and 149:
Review of Previous Classification E
- Page 150 and 151:
…the classification and Atlas can
- Page 152 and 153:
Chapter One Vegetation Classificati
- Page 154 and 155:
their associations. The four types
- Page 156 and 157:
Beard’s Classification Hierarchy
- Page 158 and 159:
Cuba Cuba is the largest island in
- Page 160 and 161:
the western Sierra de Baoruco (Fish
- Page 162 and 163:
name a few examples. Additionally,
- Page 164 and 165:
white map Beard developed of the is
- Page 166 and 167:
Classification Units versus Mapping
- Page 168 and 169:
understory species. These elements
- Page 170 and 171:
esponse to an unfavorable season. T
- Page 172 and 173:
saline/alkaline environments; for e
- Page 174 and 175:
Life Form (growth form) - A classif
- Page 176 and 177:
Perennial Forb Close-Grown Crops -
- Page 178 and 179:
Scrub - Vegetation dominated by shr
- Page 180 and 181:
Synusia - An association of plant s
- Page 182 and 183:
Chapter Four Vegetation of the Cari
- Page 184 and 185:
λ I.A.7.N.b. Montane pine forest B
- Page 186 and 187:
Formations: λ II.A.3.C.a Casuarina
- Page 188 and 189:
Matorral micrófilo montano con suc
- Page 190 and 191:
Order: HERB/NON VASCULAR DOMINATED
- Page 192 and 193:
Group: V.A.4. Tropical or subtropic
- Page 194 and 195:
Group: VII.C.1. Sparsely vegetated
- Page 196 and 197:
Appendix One Vegetation of the Cari
- Page 198 and 199:
Dacryodes excelsa - Sloanea massoni
- Page 200 and 201:
CONCEPT: Lowland forest community o
- Page 202 and 203:
CONCEPT: Tropical montane rain fore
- Page 204 and 205:
Magnolia hamorii - Brunellia comocl
- Page 206 and 207:
SYNONYMY: Palm Brake, in part (Kimb
- Page 208 and 209:
Tabebuia rigida - Ocotea spathulata
- Page 210 and 211:
DESCRIPTION: Seasonal evergreen for
- Page 212 and 213:
americana, Cassipourea elliptica, F
- Page 214 and 215:
may include Oxandra lanceolata, Oxa
- Page 216 and 217:
ibaguensis, Miconia splendens, Xylo
- Page 218 and 219:
(Rhabdadenia biflora, Sarcostemma c
- Page 220 and 221:
COMMENTS: Based on Borhidi (1991).
- Page 222 and 223:
Pinus ×maestrensis / Clethra cuben
- Page 224 and 225:
DESCRIPTION: This is a characterist
- Page 226 and 227:
II.A.1.N.a. Acoelorraphe wrightii W
- Page 228 and 229:
II.A.1.N.x. Saturated tropical or s
- Page 230 and 231:
dominated by Pinus caribaea var. ca
- Page 232 and 233:
Group: II.B.1. Tropical or subtropi
- Page 234 and 235:
shrub and vine species include Ilex
- Page 236 and 237:
Conocarpus erectus - Strumpfia mari
- Page 238 and 239:
DISTRIBUTION: Puerto Rico. SYNONYMY
- Page 240 and 241:
(TYPES TO BE DEFINED) III.A.5.N.c.
- Page 242 and 243:
III.C.1.N.c. Seasonally flooded tro
- Page 244 and 245:
V.A.1.N.b. Spartina patens Herbaceo
- Page 246 and 247:
on muddy and peaty substrates. Othe
- Page 248 and 249:
CONCEPT: Montane wet meadows in Mar
- Page 250 and 251:
(TYPES TO BE DEFINED) (HERBAZAL EST
- Page 252 and 253:
(VEGETACIÓN SATURADA PERENNE DE HE
- Page 254 and 255:
REFERENCES: Borhidi (1991). V.C.1.N
- Page 256 and 257:
REFERENCES: Borhidi (1991); Ciferri
- Page 258 and 259:
DISTRIBUTION: West Cuba. SYNONYMY:
- Page 260 and 261:
REFERENCES: Ciferri (1936); Asprey
- Page 262 and 263:
VII.C.2.N.b. Intermittently flooded
- Page 264 and 265:
EXOTIC AND ALTERED VEGETATION I.A.1
- Page 266 and 267:
III.A.1.N.a. Piper aduncum Shrublan
- Page 268 and 269:
Ellison, A. M. and E. J. Farnsworth
- Page 270 and 271:
Thompson, P. T. 1966. A test of the
- Page 272 and 273:
Smith, G. W., F. T. Short and D. I.
- Page 274 and 275:
First International Conference on S
- Page 276 and 277:
Menéndez, R., et al. 1986. Introdu
- Page 278 and 279:
Ciferri, R. 1934. Studi sull’ecol
- Page 280 and 281:
Ostenfeld, C. H. 1924. Plants from
- Page 282 and 283:
⎯⎯⎯. 1982. More additions to
- Page 284 and 285:
Gooding, E. R., A. R. Loveless and
- Page 286 and 287:
⎯⎯⎯. 1960. Flore agronomique
- Page 288 and 289:
Gill, A. M. 1969. The ecology of an
- Page 290 and 291:
⎯⎯⎯. 1991. Environmental grad
- Page 292 and 293:
William Edwards Assistant Director
- Page 294 and 295:
Carlos Rodriguez International Inst
- Page 296 and 297:
(DRAFT) Environmental Assessment fo
- Page 298 and 299:
I. PURPOSE AND NEED FOR ACTION A. N
- Page 300 and 301:
native plant survival. The park has
- Page 302 and 303:
Figure 1. Distribution of six invas
- Page 304 and 305:
well as continuous plant monitoring
- Page 306 and 307:
that will be taken to prevent any a
- Page 308 and 309:
Figure 3. L. Leucocephala crowding
- Page 310 and 311:
This initial control project has be
- Page 312 and 313:
Management Division for plotting on
- Page 314 and 315:
plants. This method was not propose
- Page 316 and 317:
Figure 8. View of salt pond on sout
- Page 318 and 319:
D. Human and Cultural Resources The
- Page 320 and 321:
and the Resource Management Plan, 1
- Page 322 and 323:
dioxide. Glyphosate has been found
- Page 324 and 325:
(c) Migratory Bird Act of 1918 prov
- Page 326 and 327:
VIII. BIBLIOGRAPHY Acevedo-Rodrigue
- Page 328 and 329:
IX. APPENDIX Appendix A. Examinatio
- Page 330 and 331:
simple test has provided some insig
- Page 332 and 333:
Crew will wear long pants and long
- Page 334 and 335:
F.3 Vegetation of Buck Island Reef
- Page 336 and 337:
Vesetatim of Buck Islam Reef Natima
- Page 340:
eproductive biology and life span o
- Page 347 and 348:
F.4 U.S. Virgin Islands vegetation
- Page 349 and 350:
Moist Forest U.S.V.I. Vegetation Co
- Page 351 and 352:
Drought-deciduous Forest (ddf) - Th
- Page 353 and 354:
Mixed Dry Shrubland (mds) - This ve
- Page 355 and 356:
Mangrove Woodland (mw) - Similar to
- Page 357 and 358:
Vascular Plant Inventory and Mappin
- Page 359 and 360:
Vascular Plant Inventory and Mappin
- Page 361 and 362:
Vascular Plant Inventory and Mappin
- Page 363 and 364:
Vascular Plant Inventory and Mappin
- Page 365 and 366:
Vascular Plant Inventory and Mappin
- Page 367 and 368:
Vascular Plant Inventory and Mappin
- Page 369 and 370:
Vascular Plant Inventory and Mappin
- Page 371 and 372:
Vascular Plant Inventory and Mappin
- Page 373 and 374:
Vascular Plant Inventory and Mappin
- Page 375 and 376:
Vascular Plant Inventory and Mappin
- Page 377 and 378:
Vascular Plant Inventory and Mappin
- Page 379 and 380:
Vascular Plant Inventory and Mappin
- Page 381 and 382:
Appendix A. List of plant species r
- Page 383 and 384:
Appendix A. List of plant species r
- Page 385 and 386:
Appendix A. List of plant species r
- Page 387 and 388:
F.6 The eradication of introduced r
- Page 389 and 390:
ABSTRACT The US National Park Servi
- Page 391 and 392:
LIST OF TABLES Table 1. Results of
- Page 393 and 394:
LIST OF APPENDICES Appendix I. Publ
- Page 395 and 396:
Island would also increase public a
- Page 397 and 398:
Figure 3. Buck Island aerial view w
- Page 399 and 400:
locks (peanut butter/molasses flavo
- Page 401 and 402:
Figure 5. Locating and flagging bai
- Page 403 and 404:
utter/molasses flavored) were place
- Page 405 and 406:
Island-wide Baiting Prior to establ
- Page 407 and 408:
though dogs are not allowed on the
- Page 409 and 410:
The final island-wide baiting was c
- Page 411 and 412:
During the December trapping sessio
- Page 413 and 414:
populations on Buck Island. The pro
- Page 415 and 416:
of the island (Fig. 11). Many more
- Page 417 and 418:
potential management strategies for
- Page 419 and 420:
APPENDICES Upon request. 26
- Page 423:
J :"' I - i ; ... FLORA OF BUCK ISL
- Page 426 and 427:
west ern end. As rec ent as the 192
- Page 428 and 429:
Puerto Rico, the tree specimens at
- Page 430 and 431:
A coastal plain forest, or beach fo
- Page 432 and 433:
Malpighia pal/ens, stingingbush, re
- Page 434 and 435:
Tragus berteronianus Schult. tNazia
- Page 436 and 437:
I I I Celosia nitida Yahl. A rather
- Page 438:
Cassia occidentalis L. (Ditremexa o
- Page 441 and 442:
• Securinega acidoton (L.) Fawcet
- Page 443:
herb on moist slopes. 43 . Turnerac
- Page 446 and 447:
Clerodendron aculeatum (L.) Schlech
- Page 448 and 449:
Beard , J. S. LITERATURE CITED 1949
- Page 451 and 452:
The Department of the Interior prot