Accuracy Assessment Report - the USGS
Accuracy Assessment Report - the USGS
Accuracy Assessment Report - the USGS

You also want an ePaper? Increase the reach of your titles
YUMPU automatically turns print PDFs into web optimized ePapers that Google loves.
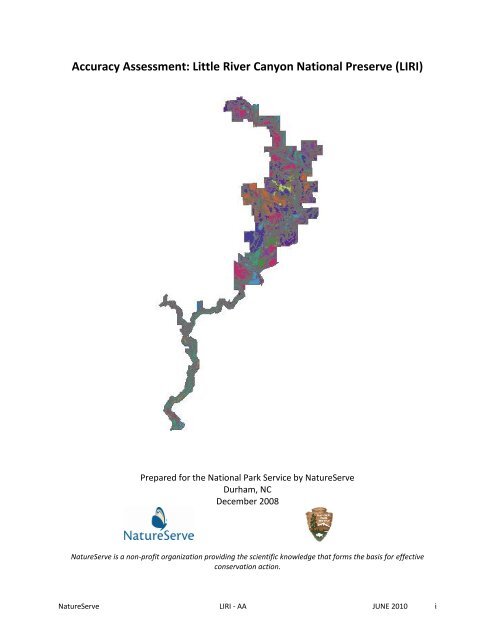
<strong>Accuracy</strong> <strong>Assessment</strong>: Little River Canyon National Preserve (LIRI)<br />
Prepared for <strong>the</strong> National Park Service by NatureServe<br />
Durham, NC<br />
December 2008<br />
NatureServe is a non-profit organization providing <strong>the</strong> scientific knowledge that forms <strong>the</strong> basis for effective<br />
conservation action.<br />
NatureServe LIRI - AA JUNE 2010 i
NatureServe LIRI - AA JUNE 2010 ii
A NatureServe Technical <strong>Report</strong><br />
Prepared for <strong>the</strong> National Park Service under Cooperative Agreement H 5028 01 0435<br />
Citation: Smart, L, R. Smyth,. and R. White. 2010. <strong>Accuracy</strong> <strong>Assessment</strong>: Little River Canyon National<br />
Preserve. NatureServe: Durham, North Carolina.<br />
© 2010 NatureServe<br />
NatureServe<br />
6114 Fayetteville Road, Suite 109<br />
Durham, NC 27713<br />
919-484-7857<br />
International Headquarters<br />
1101 Wilson Boulevard, 15 th Floor<br />
Arlington, VA 22209<br />
www.natureserve.org<br />
National Park Service<br />
Sou<strong>the</strong>ast Regional Office<br />
Atlanta Federal Center<br />
1924 Building<br />
100 Alabama St., S.W.<br />
Atlanta, GA 30303<br />
404-562-3163<br />
The view and conclusions contained in this document are those of <strong>the</strong> authors and should not be<br />
interpreted as representing <strong>the</strong> opinions of policies of <strong>the</strong> U.S. Government. Mention of trade names or<br />
commercial products does not constitute <strong>the</strong>ir endorsement by <strong>the</strong> U.S. Government.<br />
Electronic files have been provided to <strong>the</strong> National Park Service in addition to hard copies. Current<br />
information on all vegetation communities mentioned in this report can be found on NatureServe<br />
Explorer at www.natureserve.org/explorer.<br />
NatureServe LIRI - AA JUNE 2010 iii
Acknowledgements<br />
This report was prepared in cooperation with <strong>the</strong> Cumberland Piedmont Inventory and Monitoring<br />
Network, National Park Service, Department of <strong>the</strong> Interior. Network coordinator Teresa Leibfreid<br />
quickly responded and provided support whenever issues arose that needed to be addressed, as well as<br />
assisted with field data collection. We also greatly appreciate <strong>the</strong> contributions of o<strong>the</strong>r NPS staff who<br />
provided time on field crews, including Mary Shew, Shawn Waddell, Terri Hogan, Steve Thomas, and<br />
Lillian Scoggins.<br />
Marguerite Madden, Director of <strong>the</strong> Center for Remote Sensing and Mapping Science (CRMS) at <strong>the</strong><br />
University of Georgia (UGA), Tommy Jordan, <strong>the</strong> Associate Director of CRMS, and Phyllis Jackson, a<br />
photointerpreter/ecologist at CRMS, were actively involved in <strong>the</strong> creation of <strong>the</strong> vegetation map. We’re<br />
grateful for <strong>the</strong>ir help in providing data and answering <strong>the</strong> questions that arose in <strong>the</strong> process of<br />
conducting <strong>the</strong> accuracy assessment.<br />
Several NatureServe Sou<strong>the</strong>ast staff assisted with various aspects of this accuracy assessment. We thank<br />
Regan Lyons Smyth, Carl Nordman, and Mary Russo for <strong>the</strong>ir assistance with assessment point selection,<br />
field data collection, data entry, and data analysis.<br />
We fur<strong>the</strong>r thank Alabama Natural Heritage Program’s Al Schotz for his dedication to both improving <strong>the</strong><br />
classification and collecting most of <strong>the</strong> AA point data in <strong>the</strong> field. Finally, we thank contractor Maureen<br />
Mulligan for her fieldwork and thoughtful comments on improving <strong>the</strong> final key to communities.<br />
NatureServe LIRI - AA JUNE 2010 iv
NatureServe LIRI - AA JUNE 2010 v
TABLE OF CONTENTS<br />
Acknowledgements ......................................................................................................................................................IV<br />
Executive Summary ....................................................................................................................................................... 7<br />
Introduction ................................................................................................................................................................... 9<br />
Methods ........................................................................................................................................................................ 9<br />
Site Selection ............................................................................................................................................................ 10<br />
Field Data Collection ................................................................................................................................................ 10<br />
Data Analysis ........................................................................................................................................................... 11<br />
Results ......................................................................................................................................................................... 12<br />
Discussion .................................................................................................................................................................... 13<br />
Key Findings: ........................................................................................................................................................... 15<br />
References ................................................................................................................................................................... 15<br />
Appendix A ................................................................................................................................................................... 17<br />
Appendix B ................................................................................................................................................................... 23<br />
Table 1: List of CEGL Codes and Associated NVC Community Type Names ........................................................... 23<br />
Table 2: Contingency Matrix Considering Only Dominant Vegetation Class Matches ........................................... 25<br />
Table 3: Error Summaries Using Dominant Vegetation Only ................................................................................. 26<br />
Table 4: Contingency Matrix for Best Match Considering Grouped Classes and Dominant, Secondary, and<br />
Tertiary Vegetation Class Matches ......................................................................................................................... 27<br />
Table 5: Error Summaries Using <strong>the</strong> Combined Vegetation Classes ...................................................................... 28<br />
Table 6: GRTS-derived Weights Assigned to Each Mapped Vegetation Class ........................................................ 29<br />
Appendix C ................................................................................................................................................................... 30<br />
Figure 1: User’s and Producer’s accuracy measures for initial analysis. ................................................................. 30<br />
Figure 2: User’s and Producer’s accuracy measures for <strong>the</strong> grouped analysis. ...................................................... 31<br />
NatureServe LIRI - AA JUNE 2010 6
Executive Summary<br />
This report presents an accuracy assessment for <strong>the</strong> digital vegetation map of Little River Canyon<br />
National Preserve (LIRI). Vegetation at LIRI was mapped by The University of Georgia Center for<br />
Remote Sensing and Mapping Science (Jordan and Madden in press) with ecological consultation<br />
and assistance from NatureServe. The mapping was conducted as part of <strong>the</strong> National Park Service<br />
Vegetation Mapping Program.<br />
The map accuracy was assessed by comparing mapped vegetation types to field verified vegetation<br />
types at randomized evaluation points. The evaluation points were chosen prior to field work using<br />
statistical methods to ensure full representation of <strong>the</strong> range of map classes in <strong>the</strong> park. <strong>Accuracy</strong><br />
was calculated for each individual map class and for all map classes combined.<br />
The accuracy assessment process is not intended to exclusively judge <strong>the</strong> performance of <strong>the</strong><br />
mapper or <strong>the</strong> ecologists on <strong>the</strong> project since error can be caused at any point during <strong>the</strong> process<br />
relating to any of <strong>the</strong> following: remote sensing processes, ecological classification, and <strong>the</strong><br />
accuracy assessment exercise. Remotely-senses imagery is limited in its ability to differentiate<br />
between certain forest types and even <strong>the</strong> most experienced mappers can’t differentiate between<br />
certain species of oaks or pines in a remotely sensed image. Sources of error for <strong>the</strong> mapping<br />
project are varied and include more than solely “remote sensing error” but also included “ecologist<br />
error” caused by poor interpretation of <strong>the</strong> vegetation community concept, “field worker error”<br />
caused by mistakes made by fieldworkers while collecting <strong>the</strong> data (including misreading of <strong>the</strong><br />
key), and temporal error when conditions on <strong>the</strong> ground change between <strong>the</strong> mapping and<br />
assessment processes. It is difficult to isolate a single error that is causing accuracy issues without<br />
more research. The accuracy assessment, <strong>the</strong>refore, should be used more as a tool to discern<br />
usability of map classes ra<strong>the</strong>r than a way to judge <strong>the</strong> performance of <strong>the</strong> mapmakers.<br />
The University of Georgia (UGA) Team focused on generating <strong>the</strong> highest level of detail possible<br />
during park vegetation mapping to provide <strong>the</strong> most accurate information for <strong>the</strong> National Park<br />
Service. As a consequence, assessment of <strong>the</strong> finished project requires a two step approach: (1)<br />
assessing <strong>the</strong> overall accuracy of <strong>the</strong> finest-scale map produced, and (2) combining <strong>the</strong> most<br />
“confused” map classes to determine <strong>the</strong> accuracy measures at coarser scales. The report provides<br />
<strong>the</strong> best approximation of individual map class accuracy and also suggests combinations of map<br />
classes to produce a more reliable map at a coarser scale.<br />
For LIRI, <strong>the</strong> overall accuracy of <strong>the</strong> final map, which includes eight grouped map classes, is 73.4%,<br />
with a kappa statistic of 0.54 (54%). This version of <strong>the</strong> map is <strong>the</strong> most appropriate for use by <strong>the</strong><br />
standard user; what it misses in fine-scale detail, it makes up for in <strong>the</strong> relatively high level of<br />
accuracy of map classes. Vegetation associations displayed as grouped map classes on <strong>the</strong> coarsescale<br />
map include:<br />
a. Virginia Pine Successional Forest (CEGL002591), Early to Mid-Successional Loblolly Pine<br />
Forest (CEGL006011), Shortleaf Pine-Early Successional Forest (CEGL006327), Appalachian<br />
Low elevation Mixed Pine/Hillside Blueberry Forest (CEGL007119), and Mid to Late<br />
Successional Loblolly Pine-Sweetgum Forest (CEGL008462).<br />
NatureServe LIRI - AA JUNE 2010 7
. Rocky Bar and Shore (Alder-Yellowroot type) (CEGL003895), Sou<strong>the</strong>rn Cumberland High-<br />
Energy River Oak Terrace Forest (CEGL004098), Successional Sweetgum Floodplain Forest<br />
(CEGL007330), and Montane Sweetgum Alluvial Flat (CEGL007880).<br />
c. Successional Broomsedge Vegetation (CEGL004044) and Cultivated Meadow (CEGL004048).<br />
d. Cumberland Sandstone Glade (CEGL004622) and Cumberland Sandstone Glade with extra<br />
Virginia Pine (CEGL004622x).<br />
e. Successional Silktree Forest (CEGL007192) and Loblolly Pine-Tuliptree Successional<br />
Bottomland Forest (CEGL007546).<br />
f. Sou<strong>the</strong>rn Red Oak-White Oak Mixed Forest (CEGL007244), Xeric Ridgetop Chestnut Oak<br />
Forest (CEGL008431), Sou<strong>the</strong>astern Interior Sou<strong>the</strong>rn Red Oak-Scarlet Oak Forest<br />
(CEGL007247), Sou<strong>the</strong>rn Blue Ridge Escarpment Shortleaf Pine-Oak Forest (CEGL007493),<br />
Appalachian Shortleaf Pine-Xeric Oak Forest (CEGL007500), and Appalachian Shortleaf Pine-<br />
Mesic Oak Forest (CEGL008427).<br />
g. Cumberland Forested Acid Seep (CEGL007443), Upland Sweetgum-Red Maple Pond<br />
(CEGL007388), Sou<strong>the</strong>rn Ridge and Valley Small Stream Hardwood Forest (CEGL008428),<br />
Cumberland Plateau Dry-Mesic White Oak Forest (CEGL008430), Sou<strong>the</strong>rn Ridge and Valley<br />
Basic Mesic Hardwood Forest (CEGL008488), and Xeric Ridgetop Chestnut Oak Forest<br />
(CEGL008431).<br />
h. Rocky bar and shore (Cumberland/Ridge and Valley Type) (CEGL008495), Cobblebars<br />
(COBBLE), and Water-willow Rocky Bar and Shore (CEGL004286).<br />
The accuracy assessment for this version of <strong>the</strong> map considered points as a match if <strong>the</strong> vegetation<br />
observed on <strong>the</strong> ground matched any of <strong>the</strong> dominant, secondary, or tertiary vegetation types<br />
attributed to <strong>the</strong> map by <strong>the</strong> mapmaking team. It <strong>the</strong>n grouped toge<strong>the</strong>r <strong>the</strong> most commonly<br />
confused vegetation classes.<br />
The strictest analysis of <strong>the</strong> data (before any combining of map classes or NVC associations<br />
occurred and considering a point a match only if <strong>the</strong> vegetation observed on <strong>the</strong> ground matched<br />
<strong>the</strong> dominant vegetation type attributed by <strong>the</strong> mappers showed an overall map accuracy of 22.7%<br />
with a kappa statistic of 0.16 (16%). This lower accuracy reflects <strong>the</strong> difficulty in differentiating <strong>the</strong><br />
vegetation associations that were combined in <strong>the</strong> final analysis because of similarities in<br />
composition and/or in appearance on aerial photography.<br />
Key findings:<br />
For users interested in preserving <strong>the</strong> full detail of <strong>the</strong> map for highly detailed studies or<br />
management of <strong>the</strong> landscape, we recommend use of <strong>the</strong> fine-scale map as published by UGA. For<br />
all o<strong>the</strong>r users, we recommend combining map classes as specified above to allow for an overall<br />
map accuracy near 80%. In this way, <strong>the</strong> vegetation maps are useful for a broad audience yet retain<br />
potentially important fine-scale detail for interested scientists and managers.<br />
NatureServe LIRI - AA JUNE 2010 8
Introduction<br />
In 1994, <strong>the</strong> National Park Service (NPS) and <strong>the</strong> U.S. Geological Survey (<strong>USGS</strong>) embarked on a<br />
collaborative Vegetative Mapping project to catalog and map <strong>the</strong> biodiversity of <strong>the</strong> United States.<br />
The goal of <strong>the</strong> project was to map <strong>the</strong> 230+ park units within <strong>the</strong> United States (ESRI et al. 1994).<br />
As part of this national mapping initiative, a digital vegetation map of Little River Canyon National<br />
Preserve (LIRI) was completed by <strong>the</strong> University of Georgia Center for Remote Sensing and<br />
Mapping Science (Jordan and Madden in press), in consultation with NatureServe. The mapping<br />
effort included collection of field data, interpretation of aerial photography, and polygon<br />
attribution to GIS maps.<br />
Little River Canyon is a 5,543 hectare preserve that protects <strong>the</strong> nation’s longest mountaintop river,<br />
which flows for almost its entire length down <strong>the</strong> middle of Lookout Mountain in nor<strong>the</strong>ast<br />
Alabama. The free-flowing Little River is one of <strong>the</strong> cleanest, wildest waterways in <strong>the</strong> South and its<br />
canyons are some of <strong>the</strong> deepest (183 m) in <strong>the</strong> Sou<strong>the</strong>ast. This is <strong>the</strong> newest park unit in ei<strong>the</strong>r<br />
network, being authorized in 1992.<br />
At <strong>the</strong> coarsest scale, Little River Canyon can be divided into four broad environmental types: oakhickory<br />
forests, canyon shoulders, sandstone rock outcrops, and riparian areas. Oak-hickory forests<br />
occupy deep soils above <strong>the</strong> canyon shoulders. Downslope, shortleaf and loblolly pine are common,<br />
grading into Virginia pine on <strong>the</strong> glade-like canyon shoulders. Sandstone rock outcrops are common<br />
along <strong>the</strong> canyon shoulder and mainly harbor stunted Virginia or scrub pine. The shrub layer<br />
consists of sparkleberry, fringe tree, Georgia holly, and black gum. Riparian areas usually are<br />
narrow except in broader channels where oxbows exist, with woods of mainly red maple, beech,<br />
umbrella magnolia, sycamore, and river birch. In completing <strong>the</strong> vegetation mapping, mappers and<br />
ecologists attempted to discern <strong>the</strong> finest scale vegetation communities possible. As a<br />
consequence, vegetation at Little River Canyon was mapped and classified to <strong>the</strong> association level<br />
using <strong>the</strong> United States National Vegetation Classification (Grossman et al. 1998), following NPS<br />
guidelines. The minimum mapping unit (MMU) was 0.5 hectare.<br />
An accuracy assessment was performed on <strong>the</strong> Little River Canyon National Preserve map. <strong>Accuracy</strong><br />
assessments assign a measure of validity to <strong>the</strong> map product. These assessments allow users to<br />
understand <strong>the</strong> reliability with which <strong>the</strong> vegetation class mapping captures actual conditions on<br />
<strong>the</strong> ground. Knowledge of map accuracies enables potential users to determine <strong>the</strong> suitability of<br />
<strong>the</strong> map for any particular application (ESRI et al. 1994). This report describes <strong>the</strong> methods used in<br />
<strong>the</strong> accuracy assessment for LIRI and <strong>the</strong> results for each map class.<br />
Methods<br />
The <strong>the</strong>matic accuracy of <strong>the</strong> map was assessed by visiting a representative sample of evaluation<br />
points and comparing <strong>the</strong> vegetation type shown on <strong>the</strong> map to <strong>the</strong> vegetation type identified on<br />
<strong>the</strong> ground. When polygons representing vegetation types are mapped and labeled with <strong>the</strong> correct<br />
community types, <strong>the</strong>n <strong>the</strong> map has high <strong>the</strong>matic accuracy.<br />
For each map class, both producer’s and user’s accuracy are evaluated. User’s accuracy is defined<br />
as <strong>the</strong> prediction of <strong>the</strong> percentage of points mapped as a certain type which is confirmed to<br />
belong to that mapped vegetation type in <strong>the</strong> field. In o<strong>the</strong>r words, user’s accuracy is a measure of<br />
<strong>the</strong> reliability of <strong>the</strong> map to predict what is found on <strong>the</strong> ground (i.e. how likely <strong>the</strong> map user is to<br />
encounter correct information while using <strong>the</strong> map). Producer’s accuracy is defined as <strong>the</strong><br />
NatureServe LIRI - AA JUNE 2010 9
percentage of points observed to be of a given vegetation type in <strong>the</strong> field that are correctly<br />
mapped to that type. In o<strong>the</strong>r words, producer’s accuracy is a measure of <strong>the</strong> reliability of <strong>the</strong> aerial<br />
photo-interpretation to distinguish <strong>the</strong> vegetation types (i.e. how well <strong>the</strong> map maker was able to<br />
represent <strong>the</strong> ground features). In addition to <strong>the</strong> user’s and producer’s accuracy, measures of <strong>the</strong><br />
overall map accuracy are calculated, and contingency tables showing <strong>the</strong> frequency of confusion<br />
(i.e. misclassification) between associations are presented.<br />
Site Selection<br />
Site selection followed a point-based approach to assess <strong>the</strong> accuracy of <strong>the</strong> map classes, with one<br />
or more evaluation points representing each map class. Different vegetation types are represented<br />
in <strong>the</strong> map as polygons, with one or more polygon for each type. Points were selected from within<br />
those polygons using a GRTS selection approach which bases point selection on a generalized<br />
random tessellation stratified (GRTS) design. Because representative points, not entire polygons,<br />
were evaluated, <strong>the</strong> assessment results should be interpreted as a measure of <strong>the</strong> accuracy of <strong>the</strong><br />
overall map class, ra<strong>the</strong>r than an assessment of whe<strong>the</strong>r whole polygons were classified correctly.<br />
For <strong>the</strong> LIRI accuracy assessment, 576 points representing 28 of <strong>the</strong> 33 vegetation types identified<br />
for <strong>the</strong> park were evaluated.<br />
In <strong>the</strong> mapping process, UGA assigned a dominant vegetation association based on <strong>the</strong> U.S.<br />
National Vegetation Classification (NVC) for each polygon. A few polygons were also assigned<br />
secondary and/or tertiary associations in ecotones, inclusions smaller than <strong>the</strong> minimum mapping<br />
unit, areas with active succession, or in blended vegetation types. For <strong>the</strong> selection of evaluation<br />
points, only <strong>the</strong> dominant vegetation type was considered. Points were distributed across<br />
dominant vegetation types, with <strong>the</strong> number of points in each class determined by and distributed<br />
proportionally to <strong>the</strong> area of <strong>the</strong>se vegetation classes within <strong>the</strong> park (ESRI et al. 1994, NatureServe<br />
2007) within <strong>the</strong> constraints that no more than 30, and no less than 5, points be located in a given<br />
class. (Note, some classes ultimately had fewer than five points when <strong>the</strong> very small size of <strong>the</strong><br />
mapped area precluded placement of five points while maintaining minimum separation<br />
distances).Classes that took up a significantly larger portion of <strong>the</strong> park had more assessment<br />
points than classes that represented a small portion of <strong>the</strong> park. Each point was assigned a weight<br />
via <strong>the</strong> GRTS selection process based on <strong>the</strong> area of <strong>the</strong> mapped class and <strong>the</strong> number of points<br />
assigned to it; <strong>the</strong>se weights are indicative of <strong>the</strong> proportion of <strong>the</strong> map a given point represents.<br />
Locations of evaluation points were generated using <strong>the</strong> spsurvey package in <strong>the</strong> statistical<br />
software package “R Project for Statistical Computing” (R Development Core Team, 2008). Points<br />
were excluded from a 12 meter internal buffer around <strong>the</strong> boundary of each vegetation polygon to<br />
ensure that points were within polygons and to avoid misclassification due to GPS error in <strong>the</strong> field.<br />
In some instances, <strong>the</strong> size and shape of <strong>the</strong> vegetation polygons prevented selection of an<br />
adequate number of points outside <strong>the</strong> buffered area. Polygons smaller than 0.045 hectares (452<br />
square meters) with assessment points were flagged for special consideration by <strong>the</strong> field crew<br />
because <strong>the</strong>re was increased potential that GPS error could lead to assessment of an unintended<br />
polygon. A distance of at least 80 meters was maintained between adjacent points to prevent<br />
overlap in <strong>the</strong> area evaluated around each point.<br />
Field Data Collection<br />
NatureServe LIRI - AA JUNE 2010 10
M<br />
ap<br />
pe<br />
d<br />
as:<br />
Field crews located each evaluation point using a WAAS-enabled Garmin 5 GPS unit. Wide Area<br />
Augmentation System (WAAS) is a form of Differential GPS, which provides enhanced positional<br />
accuracy. At each point, <strong>the</strong> field crew recorded new coordinates, GPS positional accuracy, and<br />
collected limited vegetation data. When collecting vegetation data for accuracy points, <strong>the</strong><br />
assessment area was <strong>the</strong> 40 meter radius circle around each point. Only <strong>the</strong> dominant and<br />
diagnostic species were recorded for each stratum. The primary association type at that point was<br />
determined by <strong>the</strong> field crew using an existing key to <strong>the</strong> ecological and human influenced<br />
communities at LIRI (Schotz et al. 2008), and a “fit” value of high, medium, or low was also selected<br />
to characterize <strong>the</strong> fit of <strong>the</strong> classification key description. The classification key used in <strong>the</strong> field<br />
can be found in Appendix A. At some more confusing points, a secondary or alternate association<br />
was also recorded, and notes were taken on any difficulties keying out <strong>the</strong> point. A total of 576 data<br />
points with field data were used for <strong>the</strong> assessment of <strong>the</strong>matic accuracy.<br />
Data Analysis<br />
Contingency tables were generated summarizing misclassification rates for each vegetation type.<br />
User’s and producer’s accuracy for each vegetation type and overall accuracy of <strong>the</strong> map including<br />
<strong>the</strong> kappa statistic (Cohen 1960) were also calculated. Two scenarios were analyzed using <strong>the</strong> data.<br />
The first scenario was a strict interpretation of map accuracy at <strong>the</strong> finest scale. An evaluation point<br />
was considered correctly classified only if <strong>the</strong> dominant vegetation type assigned on <strong>the</strong> map<br />
matched <strong>the</strong> observed value on <strong>the</strong> ground. The second scenario considered a point a match if <strong>the</strong><br />
dominant, secondary, or tertiary vegetation type assigned to <strong>the</strong> mapped polygon matched <strong>the</strong><br />
observed type and also combined map classes into broader groups when evaluation of <strong>the</strong> first<br />
scenario results indicated <strong>the</strong>y were difficult to differentiate. If questions arose with regard to <strong>the</strong><br />
proper assignment of a point to a map class, <strong>the</strong> supplemental notes recorded by <strong>the</strong> field crew<br />
were also considered. In addition, any points that fell within <strong>the</strong> 12 meter polygon edge buffer (as<br />
sometimes happened when gps measurements in <strong>the</strong> field resulted in an off-set to <strong>the</strong> planned<br />
point location) observed to have <strong>the</strong> same type as that of an adjacent mapped polygon were<br />
regarded as correct in <strong>the</strong> third analysis.<br />
A contingency matrix was constructed for each scenario. This table lists sample data (i.e. mapped<br />
values) as rows and reference data (i.e. <strong>the</strong> type observed in <strong>the</strong> field) as columns. An example of a<br />
contingency matrix is presented below (Table 1). Cell values equal <strong>the</strong> number of points mapped or<br />
field-verified as belonging to that type, with numbers along <strong>the</strong> diagonal representing correctly<br />
classified points and all o<strong>the</strong>rs cells representing misclassifications. In this example, four of <strong>the</strong> five<br />
evaluation points mapped as belonging to Class B were mapped correctly, while <strong>the</strong> fifth point was<br />
found to belong to Class D in <strong>the</strong> field. In addition, <strong>the</strong> field crew identified two evaluation points<br />
that were mapped as Class C but were shown to belong in Class B in <strong>the</strong> field. They also identified<br />
three evaluation points that were mapped in class D but were shown to belong in class C in <strong>the</strong><br />
field. Examining <strong>the</strong> contingency table in this manner allows <strong>the</strong> users to discern patterns in<br />
misclassifications between classes.<br />
Table 1. A sample contingency matrix with shaded<br />
cells representing correctly classified points.<br />
Observed as:<br />
A B C D<br />
Row Totals<br />
A 5 0 0 0 5<br />
NatureServe LIRI - AA JUNE 2010 11
B 0 4 0 1 5<br />
C 0 2 8 0 10<br />
D 0 0 3 2 5<br />
Column Totals 5 6 11 3 25<br />
User’s and producer’s accuracy were derived from <strong>the</strong> values in <strong>the</strong> contingency table. Producer’s<br />
accuracy, or (1 - errors of omission), is calculated by dividing <strong>the</strong> number of correctly classified<br />
points for a map class by <strong>the</strong> total number of points determined to belong to that class in <strong>the</strong> field<br />
(i.e. <strong>the</strong> column total). In our example, <strong>the</strong> producer’s accuracy for Class B is 4 divided by 6, or 67%.<br />
User’s accuracy (1 - errors of commission) is determined by dividing <strong>the</strong> number of correctly<br />
classified points in one map class by <strong>the</strong> total number of evaluation points originally generated for<br />
that class (i.e. <strong>the</strong> row total). In our example, <strong>the</strong> users’ accuracy for Class B is 4 divided by 5, or<br />
80%.<br />
Overall map accuracy was determined by dividing <strong>the</strong> number of correct points by <strong>the</strong> total number<br />
of points assessed. A kappa statistic, which takes into account that some polygons are correctly<br />
classified by chance (ESRI et al. 1994, Foody 1992), was also calculated. The overall accuracy and<br />
kappa statistic were calculated based on all map classes for all three analysis scenarios.<br />
The weights assigned to each point during <strong>the</strong> GRTS selection process were used in <strong>the</strong> calculation<br />
of user’s, producer’s, and overall accuracy as well as for <strong>the</strong> kappa statistic. The application of such<br />
weights incorporates <strong>the</strong> inclusion probability of each point and allows for a more accurate<br />
representation of total map accuracy.<br />
Results<br />
The overall accuracy of <strong>the</strong> final LIRI vegetation map, which considered dominant, secondary, or<br />
tertiary vegetation types as well as several combined map classes, is 73.4% with a kappa statistic of<br />
0.54 (54%). The tabulation of user’s and producer’s accuracy for each map class in this version of<br />
<strong>the</strong> analysis is provided in Appendix B, Table 2. Groupings were created based on a review of <strong>the</strong><br />
contingency matrix for <strong>the</strong> original fine-scale analysis. Grouped associations included:<br />
a. Virginia Pine Successional Forest (CEGL002591), Early to Mid-Successional Loblolly Pine<br />
Forest (CEGL006011), Shortleaf Pine-Early Successional Forest (CEGL006327), Appalachian<br />
Low elevation Mixed Pine/Hillside Blueberry Forest (CEGL007119), and Mid to Late<br />
Successional Loblolly Pine-Sweetgum Forest (CEGL008462).<br />
b. Rocky Bar and Shore (Alder-Yellowroot type) (CEGL003895), Sou<strong>the</strong>rn Cumberland High-<br />
Energy River Oak Terrace Forest (CEGL004098), Successional Sweetgum Floodplain Forest<br />
(CEGL007330), and Montane Sweetgum Alluvial Flat (CEGL007880).<br />
c. Successional Broomsedge Vegetation (CEGL004044) and Cultivated Meadow (CEGL004048).<br />
NatureServe LIRI - AA JUNE 2010 12
d. Cumberland Sandstone Glade (CEGL004622) and Cumberland Sandstone Glade with extra<br />
Virginia Pine (CEGL004622x).<br />
e. Successional Silktree Forest (CEGL007192) and Loblolly Pine-Tuliptree Successional<br />
Bottomland Forest (CEGL007546).<br />
f. Sou<strong>the</strong>rn Red Oak-White Oak Mixed Forest (CEGL007244), Xeric Ridgetop Chestnut Oak<br />
Forest (CEGL008431), Sou<strong>the</strong>astern Interior Sou<strong>the</strong>rn Red Oak-Scarlet Oak Forest<br />
(CEGL007247), Sou<strong>the</strong>rn Blue Ridge Escarpment Shortleaf Pine-Oak Forest (CEGL007493),<br />
Appalachian Shortleaf Pine-Xeric Oak Forest (CEGL007500), and Appalachian Shortleaf Pine-<br />
Mesic Oak Forest (CEGL008427).<br />
g. Cumberland Forested Acid Seep (CEGL007443), Upland Sweetgum-Red Maple Pond<br />
(CEGL007388), Sou<strong>the</strong>rn Ridge and Valley Small Stream Hardwood Forest (CEGL008428),<br />
Cumberland Plateau Dry-Mesic White Oak Forest (CEGL008430), Sou<strong>the</strong>rn Ridge and Valley<br />
Basic Mesic Hardwood Forest (CEGL008488), and Xeric Ridgetop Chestnut Oak Forest<br />
(CEGL008431).<br />
h. Rocky bar and shore (Cumberland/Ridge and Valley Type) (CEGL008495), Cobblebars<br />
(COBBLE), and Water-willow Rocky Bar and Shore (CEGL004286).<br />
A stricter analysis, which considered dominant, secondary, or tertiary vegetation types but no<br />
combined map classes, produced an overall accuracy of 22.7% with a kappa statistic of 0.16 (16%)<br />
(Appendix B, Table 3).<br />
Confidence intervals for user’s and producer’s accuracy were not calculated for LIRI because of <strong>the</strong><br />
range in size of <strong>the</strong> map classes and because those classes with a smaller number of assessment<br />
points per map class inflate <strong>the</strong> size of <strong>the</strong> confidence interval and thus limit its usefulness for<br />
meaningful interpretation.<br />
It is apparent from <strong>the</strong> comparison of Tables 2-3 that overall map accuracy is considerably higher<br />
when classes are grouped and secondary and tertiary mapped vegetation are considered. The finescale<br />
detail that is available to users of <strong>the</strong> ungrouped map classes will be invaluable to researchers<br />
and managers interested in distinct vegetation associations. However, due to <strong>the</strong> error inherent in<br />
mapping at such fine-scale, it is important that <strong>the</strong> user take into account <strong>the</strong> misclassification rates<br />
shown on <strong>the</strong> contingency tables in Appendix B when using this version of <strong>the</strong> map. Because much<br />
higher accuracies are achieved when vegetation types are grouped, we recommend that users who<br />
are less inclined to explore <strong>the</strong> accuracy assessment in depth be guided to use <strong>the</strong> coarser scale,<br />
higher accuracy version of <strong>the</strong> map.<br />
Discussion<br />
Overall, <strong>the</strong> vegetation map for Little River Canyon provides a relatively accurate representation of<br />
vegetation types within <strong>the</strong> park and nearly meets <strong>the</strong> NPS 80% accuracy guidance. Several classes<br />
had very low user’s accuracies. These included <strong>the</strong> Successional Broomsedge Vegetation<br />
(CEGL004044), <strong>the</strong> Shortleaf Pine-Early Successional Forest (CEGL006327), <strong>the</strong> Sou<strong>the</strong>rn Red Oak-<br />
White Oak Mixed Forest (CEGL007244), <strong>the</strong> Sou<strong>the</strong>rn Blue Ridge Escarpment Shortleaf Pine-Oak<br />
NatureServe LIRI - AA JUNE 2010 13
Forest (CEGL007493), <strong>the</strong> Appalachian Shortleaf Pine-Mesic Oak Forest (CEGL008427), and <strong>the</strong> Mid<br />
to Late Successional Loblolly Pine-Sweetgum Forest (CEGL008462) to list a few. A complete list of<br />
user’s and producer’s accuracies for <strong>the</strong> original mapped classes can be found in Appendix B, Table<br />
3.<br />
Low map accuracies can arise from a variety of sources of error. One source that contributes most<br />
to <strong>the</strong> mapping/accuracy assessment error is <strong>the</strong> temporal difference between <strong>the</strong> period of<br />
mapping and <strong>the</strong> period of <strong>the</strong> accuracy assessment. This influences <strong>the</strong> relative accuracy of <strong>the</strong><br />
map because ecological events like succession or storm events, management activities, and o<strong>the</strong>r<br />
anthropogenic influences may have altered <strong>the</strong> landscape in a way that makes it different from<br />
what it looked like at <strong>the</strong> time of mapping.<br />
Ano<strong>the</strong>r possible reason for <strong>the</strong> low overall accuracy of <strong>the</strong> vegetation map was <strong>the</strong> lack of data on<br />
secondary or tertiary vegetation types for each polygon. There were very few secondary and<br />
tertiary vegetation types listed for <strong>the</strong> mapped polygons at LIRI. Had more polygons been assigned<br />
secondary or tertiary vegetation types instead of just <strong>the</strong> dominant vegetation type, overall<br />
accuracies at <strong>the</strong> coarser scales may have improved.<br />
The linear features at Little River Canyon also made mapping and assessment problematic. Due to<br />
<strong>the</strong> linearity of many of <strong>the</strong> polygons and <strong>the</strong>ir associated vegetation classes, GPS navigation and<br />
accuracy within <strong>the</strong> polygon is less reliable due to <strong>the</strong> narrowness and <strong>the</strong> possibility of assessing<br />
<strong>the</strong> wrong polygon/vegetation type. As a result, GPS error may have contributed significantly to <strong>the</strong><br />
lower accuracies for LIRI.<br />
While <strong>the</strong> accuracy assessment is intended to provide a measure of vegetation map reliability and<br />
associated map classes, <strong>the</strong> reader should be aware that error is also inherent in <strong>the</strong> field<br />
assessment of evaluation points. The overall accuracy of <strong>the</strong> Little River Canyon vegetation map<br />
was lower before grouping map classes. At any park, <strong>the</strong> overall accuracy and user’s and producer’s<br />
accuracy of individual map classes may be affected by a variety of factors including <strong>the</strong><br />
fragmentation and severe changes in management practices, GPS error, data collection error by <strong>the</strong><br />
field crew, poorly built and/or untested classification keys, poor ecological community concepts,<br />
inconsistent interpretation of <strong>the</strong> classification key, and potential lag times between<br />
photointerpretation and accuracy assessment. Two or more community types could be similar<br />
enough such that one assessment point could be mistakenly assigned to a particular community<br />
type by <strong>the</strong> field crew when ano<strong>the</strong>r community type was assigned to <strong>the</strong> same area by <strong>the</strong> map<br />
producers (Townsend 2000). Points may fall into ecotones or into inclusions within <strong>the</strong> larger<br />
community type and <strong>the</strong> resulting classification in <strong>the</strong> field may not be <strong>the</strong> same as that on <strong>the</strong><br />
map. While measures were taken to reduce <strong>the</strong>se errors, <strong>the</strong>y are not altoge<strong>the</strong>r avoidable and it is<br />
not within <strong>the</strong> scope of this project to discern what mistakes led to errors. However, it is important<br />
to note that mapping error is but one of many types of error that combine to create accuracy<br />
issues with any given map.<br />
Users of <strong>the</strong> LIRI digital vegetation map should familiarize <strong>the</strong>mselves with <strong>the</strong> results of this<br />
accuracy assessment, <strong>the</strong> potential sources of classification error, and <strong>the</strong> contingency tables<br />
provided in Appendix B. When interested in using <strong>the</strong> map to locate a particular association, it is<br />
useful to know what o<strong>the</strong>r map classes have been shown to contain points matching that<br />
association, and what o<strong>the</strong>r vegetation types <strong>the</strong> mapped association of interest is likely to contain.<br />
NatureServe LIRI - AA JUNE 2010 14
We recommend that natural resource managers consider combining some commonly confused<br />
map classes toge<strong>the</strong>r for display or o<strong>the</strong>r purposes.<br />
The large difference between <strong>the</strong> overall measure of accuracy and <strong>the</strong> kappa statistic can be<br />
attributed to <strong>the</strong> fact that more samples are generated for vegetation classes that comprise a large<br />
percentage of <strong>the</strong> total mapped area and <strong>the</strong>y receive higher weights. Thus <strong>the</strong>y contribute more<br />
to our accuracy calculations and, due to <strong>the</strong>ir higher proportional representation, are more likely to<br />
be correctly classified by chance and thus discounted by <strong>the</strong> kappa statistic.<br />
For casual map users and general display purposes, use of <strong>the</strong> higher-accuracy map which includes<br />
<strong>the</strong>se lumped classes will be most useful. For researchers and managers interested in fine-scale<br />
detail and rare vegetation types, a version of <strong>the</strong> map that preserves <strong>the</strong> full detail as published by<br />
UGA should be maintained. This more detailed version of <strong>the</strong> map, while less accurate for some<br />
map classes, contains valuable information for those interested in locating vegetation types that<br />
are inherently difficult to map. Used in conjunction with <strong>the</strong> results of this accuracy assessment, <strong>the</strong><br />
original map provides <strong>the</strong> best tool available for understanding <strong>the</strong> spatial distribution of<br />
vegetation types at LIRI.<br />
Key Findings:<br />
For users interested in preserving <strong>the</strong> full detail of <strong>the</strong> map for <strong>the</strong> purpose of highly detailed<br />
studies or management of <strong>the</strong> landscape, we recommend use of <strong>the</strong> fine-scale LIRI map as<br />
published by UGA. For all o<strong>the</strong>r users, we recommend combining map classes as specified above to<br />
allow for an overall map accuracy near 80%. These actions will allow for a map that is useful for <strong>the</strong><br />
widest audience possible, while maintaining potentially important fine scale detail.<br />
References<br />
Cohen, J. 1960. A coefficient of agreement for nominal scales, Educational and Psychological<br />
Measurement 20: 37–46.<br />
Environmental Systems Research Institute (ESRI), National Center for Geographic Information and<br />
Analysis, and The Nature Conservancy. 1994. NBS/NPS Vegetation Mapping Program: <strong>Accuracy</strong><br />
<strong>Assessment</strong> Procedures. Prepared for <strong>the</strong> United States Department of Interior, National<br />
Biological Survey and National Park Service. Washington, D.C.<br />
Foody, G. M. 1992. On <strong>the</strong> compensation for chance agreement in image classification accuracy<br />
assessment. Photogrammetric Engineering and Remote Sensing. 58: 1459-1460.<br />
Grossman, D.H., D. Faber-Langendoen, A.S. Weakley, M. Anderson, P. Bourgeron, R. Crawford, K.<br />
Goodin, S. Landaal, K. Metzler, K.D. Patterson, M. Pyne, M. Reid, and L. Sneddon. 1998.<br />
International classification of ecological communities: Terrestrial vegetation of <strong>the</strong> United<br />
States. Volume I. The national vegetation classification system: Development, status, and<br />
applications. The Nature Conservancy, Arlington, VA.<br />
NatureServe LIRI - AA JUNE 2010 15
Jordan, T. and M. Madden. 2008. Digital Vegetation Maps for <strong>the</strong> NPS Cumberland-Piedmont I&M<br />
Network. A<strong>the</strong>ns, GA: The University of Georgia, Center for Remote Sensing and Mapping<br />
Science, Department of Geography.<br />
NatureServe. 2004. International Ecological Classification Standard: Terrestrial Ecological<br />
Classifications. NatureServe Central Databases. Arlington, VA. U.S.A. Data current as of March<br />
29, 2005.<br />
NatureServe. 2007. Procedure for Selecting <strong>Assessment</strong> Points: Guilford Courthouse <strong>Accuracy</strong><br />
<strong>Assessment</strong> Workshop. Durham, North Carolina: NatureServe.<br />
Olsen, T. and T. Kincaid. 2009 Package ‘spsurvey’: Spatial Survey Design and Analysis.<br />
Schotz, A., M. Hall, and R.D. White, Jr. 2006. Vascular Plant Inventory and Ecological Community<br />
Classification for Russell Cave National Monument. Durham, North Carolina: NatureServe.<br />
Townsend, P. A. 2000. A quantitative fuzzy approach to assess mapped vegetation classifications for<br />
ecological applications. Remote Sensing of Environment 72:253-267.<br />
NatureServe LIRI - AA JUNE 2010 16
Appendix A<br />
Key to <strong>the</strong> National Vegetation Classification (NVC) Associations which occur, or potentially<br />
occur, at Little River Canyon National Preserve<br />
NatureServe<br />
April 2009<br />
Associations which are documented by NatureServe from Little River Canyon are in bold type.<br />
Those which are potential, but undocumented for any of <strong>the</strong> plots in this project, are in normal type.<br />
Associations highlighted in yellow are vegetation map units used by UGA – CRMS.<br />
Those associations which were not mapped, are noted in bold before <strong>the</strong> name. For each association, <strong>the</strong><br />
common name is given, with <strong>the</strong> Element Code in brackets [CEGL00####].<br />
1. Communities in river or on floodplain of river or creek tributaries .......................................................................... 2<br />
1. Upland communities or wetland communities isolated from river or creek tributaries (such as<br />
depression ponds) ....................................................................................................................................................... 13<br />
2. Shrublands, herbaceous, or sparse herbaceous communities .................................................................................. 3<br />
2. Forests or woodlands, stands dominated by trees .................................................................................................... 7<br />
3. Aquatic community regularly inundated, becoming dry only during extreme drought; often dominated<br />
by Justicia americana and frequently contains <strong>the</strong> rare Kral’s water-plantain (Sagittaria secundifolia) as a<br />
secondary species ............................................................................................................................................................<br />
..................................................... (This association not mapped) Water-Willow Rocky Bar and Shore [CEGL004286]<br />
3. Community occasionally inundated by water but is usually above water’s edge ..................................................... 4<br />
4. Fern-dominated community primarily limited as riverside occurrences that are patchy and very small(This association<br />
not mapped) Cumberland Royal Fern Seep [CEGL008404]<br />
4. Shrub-dominated community ................................................................................................................................... 5<br />
5. Dense exotic shrub cover along creeks dominated by Ligustrum sinense ..................................................................<br />
................................................................................... (This association not mapped) Privet Shrubland [CEGL003807]<br />
5. Sparse to dense shrub cover not dominated by Ligustrum sinense, but comprised of various native<br />
species ........................................................................................................................................................................... 6<br />
NatureServe LIRI - AA JUNE 2010 17
6. Dense shrub cover of Alnus serrulata with Xanthorhiza simplicissima in low shrub layer below.<br />
Generally occurs as a thin linear community along <strong>the</strong> river bank .................................................................................<br />
....................................................................................... Rocky Bar and Shore (Alder-Yellowroot type) [CEGL003895]<br />
6. Sparse to relatively dense shrub cover of various shrubs including Alnus serrulata, Kalmia latifolia,<br />
Rhododendron spp., Vaccinium elliottii, Fo<strong>the</strong>rgilla major, Viburnum dentatum, and Cephalanthus<br />
occidentalis, among o<strong>the</strong>rs (sometimes very sparse where little soil exists, with as low as 10% cover and<br />
90% exposed rock). Most frequently occurs along banks or on boulder-strewn areas in <strong>the</strong> middle of<br />
channels, but occasionally occupies <strong>the</strong> understory of transitional oak forest types on <strong>the</strong> lower portions<br />
of steep stream banks and old beaver impoundments ...................................................................................................<br />
................................................................ Rocky Bar and Shore (Cumberland / Ridge and Valley Type) [CEGL008495]<br />
7. Seepage forest dominated by Acer rubrum and Quercus alba along flat secondary waterways, where<br />
<strong>the</strong> soil is typically saturated or at least moist as a result of a continuous supply of groundwaterCumberland Forested Acid<br />
Seep [CEGL007443]<br />
7. Forest on occasionally flooded terraces or floodplains along Little River or one of its main tributaries .................. 8<br />
8. Woodland presently maintained by mowing and/or fire with approximately 40% coverage of canopy<br />
species and nearly continuous herbaceous cover. This community contains oak species usually associated<br />
with sandy coastal plain habitats such as Quercus margarettiae and Quercus incana and also has high<br />
levels of Carya pallida. In addition, this community contains a prominence of Pinus echinata and Pinus<br />
taeda in <strong>the</strong> canopy .........................................................................................................................................................<br />
...............................................................................Loblolly Pine – Shortleaf Pine Managed Woodland [CEGL003618]<br />
8. Forest with greater than 60% canopy cover and sparse to moderate herbaceous cover ......................................... 9<br />
9. Forest dominated by Pinus taeda and occasionally Pinus echinata and/or Pinus virginiana (with at least<br />
40% canopy cover of pine), with Liriodendron tulipifera occupying at least 10% of <strong>the</strong> canopy. The canopy<br />
can also contain substantial Fagus grandifolia and o<strong>the</strong>r mesophytic tree species. There may be a lot of<br />
shrub cover, and moderate herbaceous cover (0-25%). Similar to CEGL004098 (below), but with more<br />
Pinus taeda. .....................................................................................................................................................................<br />
.................................................................... Loblolly Pine – Tuliptree Successional Bottomland Forest [CEGL007546]<br />
9. Forest not dominated by Pinus taeda (less than 40% in canopy) ............................................................................ 10<br />
10. Forest dominated by <strong>the</strong> exotic species, silktree (Albizia julibrissin) ........................................................................<br />
.................................................................................................................... Successional Silktree Forest [CEGL007192]<br />
10. Forest not dominated by silktree, but instead dominated by native species ....................................................... 11<br />
11. Forest dominated by Liriodendron tulipifera and/or Liquidambar styraciflua ...................................................... 12<br />
11. Forest dominated by oaks (usually a combination of Quercus alba, Q. velutina, Q. coccinea, and/or Q.<br />
falcata comprise at least 40% of <strong>the</strong> canopy). O<strong>the</strong>r species include pines and mesic species such as<br />
Liriodendron tulipifera and Liquidambar styraciflua. Shrub layer generally has at least 40% total cover<br />
dominated by Kalmia latifolia. Herbaceous cover varies, but usually has 10% or more cover of<br />
Chasmanthium sessiliflorum ............................................................................................................................................<br />
...............................................................Sou<strong>the</strong>rn Cumberland High-Energy River Oak Terrace Forest [CEGL004098]<br />
12. Successional community that includes young Liriodendron tulipifera and/or Liquidambar styraciflua<br />
stands along creeks and rivers within <strong>the</strong> park ...............................................................................................................<br />
............................................................................................. Successional Sweetgum Floodplain Forest [CEGL007330]<br />
NatureServe LIRI - AA JUNE 2010 18
12. Late successional/older forest occurs in bottomland areas along Little River that were cultivated 30-<br />
80 years ago and now contains large amounts of Liriodendron tulipifera, Liquidambar styraciflua, and<br />
Magnolia acuminata. Most examples of this type are dominated by Liriodendron tulipifera and are flat!<br />
Occasionally Quercus falcata and Quercus alba are co-dominants (This association not mapped) Montane Sweetgum<br />
Alluvial Flat [CEGL007880]<br />
13. Wetland (isolated bog or ephemeral pond) .......................................................................................................... 14<br />
13. Non-wetland .......................................................................................................................................................... 15<br />
14. Ephemeral pond, ei<strong>the</strong>r natural or caused by backup from a backcountry road. Canopy includes<br />
Liquidambar styraciflua (usually more than 50% cover) with Pinus taeda (about 25%) and Nyssa sylvatica<br />
or Acer rubrum (about 25%) serving as secondary species .............................................................................................<br />
.................................................................................................... Upland Sweetgum – Red Maple Pond [CEGL007388]<br />
14. Swale, not a pond, containing pitcher-plants (Sarracenia oreophila) and o<strong>the</strong>r wetland species,<br />
though <strong>the</strong> area is dry for part of <strong>the</strong> year. Examples may contain Pinus taeda and various hardwoods in<br />
<strong>the</strong> canopy, especially if not regularly burned. Sphagnum is present in <strong>the</strong> herbaceous layer – bogSou<strong>the</strong>rn Appalachian<br />
Low Mountain Seepage Bog [CEGL003914]<br />
15. Forested (forest or woodland), stand dominated by trees ................................................................................... 16<br />
15. Non-forested (vine dominated, herb dominated or sparsely vegetated) ............................................................. 33<br />
16. Pine-dominated or co-dominated community (usually more than 40% pine in <strong>the</strong> canopy) ............................... 17<br />
16. Hardwood-dominated (at least 60% hardwoods in <strong>the</strong> canopy) ........................................................................... 25<br />
17. Even aged stand dominated almost exclusively by young-mid aged pine trees (generally less than 50<br />
years of age) with a poorly developed herbaceous layer. Successional. ..................................................................... 18<br />
17. Uneven aged stand dominated by pines, but usually with a significant component of oaks. Generally<br />
tree ages are greater than 60 years ............................................................................................................................ 22<br />
18. Dominated by ei<strong>the</strong>r Pinus echinata or Pinus taeda ............................................................................................. 20<br />
18. Dominated by Pinus virginiana .............................................................................................................................. 19<br />
19. Dominated by Pinus virginiana (at least 50% of <strong>the</strong> canopy). Usually very dense trees on <strong>the</strong> edge of<br />
<strong>the</strong> canyon where disturbance may have recently occurred. .........................................................................................<br />
........................................................................................................... Virginia Pine Successional Forest [CEGL002591]<br />
19. Flat to moderately steep rocky sandstone glades, with sparse to continuous herbaceous vegetation<br />
and substantial areas with trees and scrub Pinus virginiana on sandstone ....................................................................<br />
....................................................................... Cumberland Sandstone Glade with extra Virginia Pine [CEGL004622x]<br />
20. Virtually 100% Pinus echinata with a scattering of oaks and successional vegetation. Occasionally<br />
shared dominance of Pinus virginiana or Pinus taeda. ...................................................................................................<br />
............................................................................................. Shortleaf Pine – Early Successional Forest [CEGL006327]<br />
20. Dominated by Pinus taeda usually with some hardwoods in <strong>the</strong> canopy or subcanopy ...................................... 21<br />
NatureServe LIRI - AA JUNE 2010 19
21. Strongly codominated by Pinus taeda and Liquidambar styraciflua, o<strong>the</strong>r hardwoods may be presentMid to Late<br />
Successional Loblolly Pine-Sweetgum Forest [CEGL008462]<br />
21. Canopy greater than 60% Pinus taeda, which is <strong>the</strong> monospecific canopy dominant often with various<br />
amounts of Liquidambar styraciflua and/or Acer rubrum var. rubrum or o<strong>the</strong>r hardwoods in <strong>the</strong><br />
subcanopy ........................................................................................................................................................... Early to<br />
Mid-Successional Loblolly Pine Forest [CEGL006011]<br />
22. Forest stand comprised of at least 25% Pinus echinata in <strong>the</strong> canopy.................................................................. 23<br />
22. Community comprised of less than 25% Pinus echinata in <strong>the</strong> canopy. Most examples exist along <strong>the</strong><br />
rim of <strong>the</strong> canyon and exposed south-facing slopes usually and can coexist of anywhere from 30% to<br />
100% canopy coverage mostly of Pinus virginiana, but also occasionally with a Quercus prinus component<br />
and a prominence of Pinus taeda in disturbed examples. Some examples are dominated by Vaccinium<br />
arboreum (near 100% cover) or Deschampsia flexuosa (near 100% cover) in <strong>the</strong> shrub and herb layers,<br />
respectively; Quercus marilandica can often be a small part of <strong>the</strong> canopy ...................................................................<br />
..................................................... Appalachian Low Elevation Mixed Pine / Hillside Blueberry Forest [CEGL007119]<br />
23. Pinus echinata and often Pinus virginiana usually constitute more than 50% of <strong>the</strong> canopy with<br />
Quercus alba, Quercus rubra, and Quercus velutina, but without a large component of dry-site oaks such<br />
as Quercus coccinea or Quercus prinus. The understory is often heavily invaded by Acer rubrum in fire<br />
suppressed areas. Shrub and herb layers are very sparse except in some cases where Piptochaetium<br />
avenaceum is dominant. Carya alba is sometimes also present in <strong>the</strong> canopyAppalachian Shortleaf Pine – Mesic Oak<br />
Forest [CEGL008427]<br />
23. Forest comprised of at least 25% Pinus echinata and less than 10% Pinus virginiana .......................................... 24<br />
24. Forest comprised of at least 25% Pinus echinata and between 0 and 50% Quercus prinus, Quercus<br />
falcata, Quercus coccinea, or Quercus stellata, also without a thick component of Oxydendrum arboreum<br />
in <strong>the</strong> understory and dense stands of Vaccinium pallidum in <strong>the</strong> shrub layer. Usually on <strong>the</strong> most<br />
exposed slopes, but occasionally occurs on o<strong>the</strong>r aspects in less extreme situations and can occur on low<br />
slopes on north aspects ...................................................................................................................................................<br />
..............................................................Sou<strong>the</strong>rn Blue Ridge Escarpment Shortleaf Pine – Oak Forest [CEGL007493]<br />
24. Pinus echinata-dominated forest, with Quercus alba, Quercus coccinea, Quercus falcata, and/or<br />
Quercus stellata serving as co-dominants. Similar to CEGL007493 above, but contains a prominence<br />
(>75%) of dry-site herbs in <strong>the</strong> understory, generally as a result frequent burning or high grading.<br />
Examples are confined to broad ridges and upper slopes ...............................................................................................<br />
...................................................................................... Appalachian Shortleaf Pine – Xeric Oak Forest [CEGL007500]<br />
25. Forest of dry to mesic moderately protected to exposed ridgetops and upper ravines on acidic soils ................ 26<br />
25. Forest of mesic lower to mid slopes or of bouldery steep streams cascading down <strong>the</strong> slopes (or<br />
occasionally protected slopes just below <strong>the</strong> cliff line). Canopy is composed of at least some mesophytic<br />
forest species ............................................................................................................................................................... 31<br />
26. Contains greater than 50% Quercus prinus and/or Quercus coccinea in <strong>the</strong> canopy ............................................ 27<br />
26. Contains less than 50% Quercus prinus and/or Quercus coccinea in <strong>the</strong> canopy .................................................. 30<br />
27. Mesic north- to east-facing slopes or protected slopes just below <strong>the</strong> cliff line dominated by Quercus<br />
prinus in <strong>the</strong> canopy and at least 25% shrub cover of ei<strong>the</strong>r Rhododendron catawbiense or Kalmia<br />
NatureServe LIRI - AA JUNE 2010 20
latifolia. Sometimes Pinus spp. or Liriodendron tulipifera dominate. Rhododendron catawbiense is always<br />
present. ..................................................................................................... Piedmont Beech Heath Bluff [CEGL004539]<br />
27. Quercus prinus and/or Quercus coccinea-dominated forest containing less than 25% Rhododendron<br />
catawbiense and/or Kalmia latifolia in <strong>the</strong> shrub layer .............................................................................................. 28<br />
28. Dry-mesic slope forest often with Quercus alba as a canopy species and Hydrangea quercifolia and/or<br />
Viburnum acerifolium in <strong>the</strong> shrub layer .........................................................................................................................<br />
................................................................................ Cumberland Plateau Dry-Mesic White Oak Forest [CEGL008430]<br />
28. Dry forest of ridgetops and upper slopes seldom, if ever, contains Hydrangea quercifolia and/or<br />
Viburnum acerifolium in <strong>the</strong> shrub layer ..................................................................................................................... 29<br />
29. Xeric ridgetop or upper slope forest with Quercus prinus and/or Quercus coccinea, with Quercus alba<br />
dominating in some examples. Herb layer varies from sparse to heavy depending upon canopy closure.<br />
Vaccinium pallidum usually present – some Pinus echinata but less than 40% - Piptochaetium avenaceum<br />
and/or Danthonia spicata can form a significant cover where fire has been present. High graded<br />
examples often have a dense herbaceous cover.............................................................................................................<br />
....................................................................................................... Xeric Ridgetop Chestnut Oak Forest [CEGL008431]<br />
29. Dry-mesic ridgetops and gentle upper slopes co-dominated by a partially open to sparse cover of<br />
Quercus falcata, Quercus coccinea, and Quercus prinus in <strong>the</strong> canopy, with a dense understory comprised<br />
of Quercus marilandica, Carya spp., and sometimes Quercus stellata and Fagus grandifolia (namely in<br />
fire-excluded examples) in <strong>the</strong> understory......................................................................................................................<br />
...................................................................................................................................... (This association not mapped)<br />
............................................................. Sou<strong>the</strong>astern Interior Sou<strong>the</strong>rn Red Oak – Scarlet Oak Forest [CEGL007247]<br />
30. Community found on flat to gently sloping land in <strong>the</strong> backcountry. Dominated by a combination of<br />
Quercus falcata, Quercus velutina, Quercus alba, with an occasional Quercus stellata and Quercus rubra.<br />
This community is sometimes part of a bog complex where an open version of this form, thinned out by<br />
fire, surrounds <strong>the</strong> bog ....................................................................................................................................................<br />
................................................................................ Sou<strong>the</strong>rn Red Oak – White Oak Mixed Oak Forest [CEGL007244]<br />
30. Mesic slope forest dominated by Quercus alba and/or various Carya spp. in <strong>the</strong> canopy and with<br />
Hydrangea quercifolia and/or Viburnum acerifolium in <strong>the</strong> shrub layer. This is <strong>the</strong> most common slope<br />
forest in <strong>the</strong> preserve and exhibits a great deal of variation in <strong>the</strong> canopy, shrub, and herb layersCumberland Plateau<br />
Dry-Mesic White Oak Forest [CEGL008430]<br />
31. Community usually a very narrow band of vegetation adjacent to streams and/or occupies<br />
boulderfields, occasionally occupying lower slopes that dissect <strong>the</strong> canyon walls or where streams meet<br />
terraces. Quercus alba and/or Quercus rubra usually >25%, along with mesophytic species such as Fagus<br />
grandifolia in <strong>the</strong> canopy. The subcanopy nearly always contains Acer leucoderme and Calycanthus<br />
floridus (at least 10% cover) in <strong>the</strong> shrub layer; <strong>the</strong> herb layer is diverse with at least 20% cover.<br />
Hydrangea quercifolia and Viburnum acerifolium are generally absent. Sometimes a heavy Pinus taeda<br />
component is present, which may intergrade with CEGL008430 on steep slopes adjacent to stream beds ..................<br />
................................................................. Sou<strong>the</strong>rn Ridge and Valley Small Stream Hardwood Forest [CEGL008428]<br />
31. Community broad, nei<strong>the</strong>r consisting of a narrow band of vegetation along streams nor confined to<br />
boulderfields ................................................................................................................................................................ 32<br />
32. Diverse hardwood canopy that includes Quercus rubra, Tilia americana var. heterophylla, Betula<br />
lenta, and Liriodendron tulipifera, along with <strong>the</strong> occasional Quercus alba. Tilia and/or Betula are usually<br />
key indicators, as <strong>the</strong> herbaceous understory, which tends to be comprised of species that prefer basic<br />
NatureServe LIRI - AA JUNE 2010 21
soils. This forest occupies bands of limestone geology on <strong>the</strong> lower to mid slopes within <strong>the</strong> sou<strong>the</strong>rn<br />
portion of <strong>the</strong> canyon ......................................................................................................................................................<br />
.................................................................... Sou<strong>the</strong>rn Ridge and Valley Basic Mesic Hardwood Forest [CEGL008488]<br />
32. Mesic north- to east-facing slopes or protected slopes just below <strong>the</strong> cliff line dominated by Quercus<br />
prinus in <strong>the</strong> canopy and at least 25% shrub cover comprised of ei<strong>the</strong>r Rhododendron catawbiense or<br />
Kalmia latifolia. Sometimes various Pinus spp. or Liriodendron tulipifera dominate. Rhododendron<br />
catawbiense is always present ........................................................................................................................................<br />
.................................................................................................................. Piedmont Beech Heath Bluff [CEGL004539]<br />
33. Vine-dominated vegetation, dominated by Wisteria sinensis, Wisteria floribunda, or very often<br />
hybrids of <strong>the</strong>se two exotic vines, which overtop o<strong>the</strong>r vegetation and dominate areas ..............................................<br />
.................................................................................................................................... Wisteria Vineland [CEGL008568]<br />
33. Vegetation not vine dominated, sparse and rocky or sandy or grass dominated and may have some<br />
Virginia Pine (Pinus virginiana) .................................................................................................................................... 34<br />
34. Grasslands of pastures or old fields ....................................................................................................................... 35<br />
34. More natural stands, rocky or sandy, may have some Virginia Pine (Pinus virginiana) ........................................ 36<br />
35. Successional old field dominated by Andropogon spp. and o<strong>the</strong>r weedy herbaceous vegetation ...... Successional<br />
Broomsedge Vegetation [CEGL004044]<br />
35. Pasture or old field dominated by Fescue, i.e. Lolium (arundinaceum, pratense) and o<strong>the</strong>r weedy<br />
herbaceous vegetation ............................................................................................ Cultivated Meadow [CEGL004048]<br />
36. Terrain consisting of overhangs and vertical rock faces called “rockhouses,” sparsely vegetated with<br />
Heuchera parviflora var. parviflora serving as an indicator species ................................................................................<br />
.............................................. (This association not mapped) Cumberland Acidic Cliff and Rockhouse [CEGL004301]<br />
36. Flat to moderately steep rocky sandstone glades, with sparse to continuous herbaceous vegetation<br />
and may have some Virginia Pine (Pinus virginiana) ................................................................................................... 37<br />
37. Characterized by some sparse vegetation, some herbaceous cover, and substantial areas with trees<br />
and scrub Pinus virginiana on sandstone ........................................................................................................................<br />
....................................................................... Cumberland Sandstone Glade with extra Virginia Pine [CEGL004622x]<br />
37. Terrain relatively level to moderately steep (about 30% slope), characterized by sparse vegetation,<br />
nearly 100% herbaceous cover, and contains areas with scrub Pinus virginiana on sandstoneCumberland Sandstone<br />
Glade [CEGL004622]<br />
NatureServe LIRI - AA JUNE 2010 22
Appendix B<br />
Table 1: List of CEGL Codes and Associated NVC Community Type Names<br />
CEGL Code Name (in numerical order)<br />
2591 Virginia Pine Successional Forest<br />
3618 Loblolly Pine-Shortleaf Pine Managed Woodland<br />
3895 Rocky Bar and Shore (Alder-Yellowroot type)<br />
3914 Sou<strong>the</strong>rn Appalachian Low Mountain Seepage Bog<br />
4044 Successional Broomsedge Vegetation<br />
4048 Cultivated Meadow<br />
4098 Sou<strong>the</strong>rn Cumberland High-Energy River Oak Terrace Forest<br />
4286 Water-Willow Rocky Bar and Shore (this association not mapped)<br />
4539 Piedmont Beech Heath Bluff<br />
4622 Cumberland Sandstone Glade<br />
6011 Early to Mid-Successional Loblolly Pine Forest<br />
6327 Shortleaf Pine-Early Successional Forest<br />
7119 Appalachian Low Elevation Mixed Pine/Hillside Blueberry Forest<br />
7192 Successional Silktree Forest<br />
7244 Sou<strong>the</strong>rn Red Oak-White Oak Mixed Forest<br />
7247 Sou<strong>the</strong>astern Interior Sou<strong>the</strong>rn Red Oak-Scarlet Oak Forest<br />
7330 Successional Sweetgum Floodplain Forest<br />
7388 Upland Sweetgum-Red Maple Pond<br />
7443 Cumberland Forested Acid Seep<br />
7493 Sou<strong>the</strong>rn Blue Ridge Escarpment Shortleaf Pine-Oak Forest<br />
7500 Appalachian Shortleaf Pine-Xeric Oak Forest<br />
7546 Loblolly Pine-Tuliptree Successional Bottomland Forest<br />
7880 Montane Sweetgum Alluvial Flat (this association not mapped)<br />
8427 Appalachian Shortleaf Pine-Mesic Oak Forest<br />
8428 Sou<strong>the</strong>rn Ridge and Valley Small Stream Hardwood Forest<br />
8430 Cumberland Plateau Dry-Mesic White Oak Forest<br />
8431 Xeric Ridgetop Chestnut Oak Forest<br />
8462 Mid to Late Successional Loblolly Pine-Sweetgum Forest<br />
8488 Sou<strong>the</strong>rn Ridge and Valley Basic Mesic Hardwood Forest<br />
8495 Rocky Bar and Shore (Cumberland/Ridge and Valley Type)<br />
8568 Wisteria Vineland<br />
4622x<br />
Cumberland Sandstone Glade with Extra Virgina Pine<br />
NatureServe LIRI - AA JUNE 2010 23
NatureServe LIRI - AA JUNE 2010 24
Table 2: Contingency Matrix Considering Only Dominant Vegetation Class Matches<br />
Mapped<br />
Vegetation<br />
Vegetation Classes Observed in <strong>the</strong> Field<br />
Classes<br />
2591 3618 3895 3914 4044 4048 4098 4286 4539 4622 6011 6327 7119 7192 7244 7247 7330 7388 7443 7493 7500 7546 7880 8427 8428 8430 8431 8462 8488 8495 8568 4622x COBBLE Totals<br />
2591 11 1 3 3 2 2 1 3 1 4 1 3 35<br />
3618 1 1<br />
3895 0 4 1 1 3 2 1 12<br />
3914 2 2<br />
4044 0 1 1 2<br />
4048 0 n/a<br />
4098 17 1 2 1 2 6 1 1 3 3 37<br />
4286 0 n/a<br />
4539 12 1 1 1 3 3 21<br />
4622 1 1 2 1 4 9<br />
6011 4 13 3 3 3 2 1 1 1 3 34<br />
6327 4 1 2 2 3 1 2 10 2 1 2 30<br />
7119 4 2 11 2 6 3 1 29<br />
7192 0 0 2 2<br />
7244 1 4 0 2 1 3 16 27<br />
7247 0 n/a<br />
7330 1 1 1 1 2 3 1 10<br />
7388 1 0 3 4<br />
7443 2 1 1 5 5 5 1 8 1 29<br />
7493 1 1 11 1 4 13 31<br />
7500 4 3 9 1 15 1 33<br />
7546 3 1 12 4 1 1 5 27<br />
7880 0 n/a<br />
8427 1 1 1 1 1 4 1 3 11 2 1 4 1 32<br />
8428 2 1 5 1 8 9 2 28<br />
8430 1 4 1 1 1 2 18 4 1 33<br />
8431 1 1 4 1 4 1 15 27<br />
8462 1 1 1 3 3 1 6 1 4 5 2 1 29<br />
8488 2 9 13 6 30<br />
8495 1 1 5 6 13<br />
8568 1 1<br />
4622x 2 2 2 1 1 8<br />
COBBLE 0 n/a<br />
Totals 27 3 n/a 5 2 2 29 1 23 4 24 8 28 n/a 45 2 11 6 5 17 58 20 9 23 42 61 80 6 7 12 1 8 7 576<br />
NatureServe LIRI - AA JUNE 2010 25
Table 3: Error Summaries Using Dominant Vegetation Only<br />
Map Class<br />
Producer’s <strong>Accuracy</strong><br />
User’s <strong>Accuracy</strong><br />
<strong>Accuracy</strong> N <strong>Accuracy</strong> N<br />
2591 12.0% 27 31.4% 35<br />
3618 0.3% 3 100.0% 1<br />
3895 n/a n/a 0.0% 12<br />
3914 0.9% 5 100.0% 2<br />
4044 0.0% 2 0.0% 2<br />
4048 0.0% 2 n/a n/a<br />
4098 27.3% 29 45.9% 37<br />
4286 0.0% 1 n/a n/a<br />
4539 7.0% 23 57.1% 21<br />
4622 51.2% 4 22.2% 9<br />
6011 22.6% 24 38.2% 34<br />
6327 51.8% 8 6.7% 30<br />
7119 46.0% 28 37.9% 29<br />
7192 n/a n/a 0.0% 2<br />
7244 16.8% 45 14.8% 27<br />
7247 0.0% 2 n/a n/a<br />
7330 1.6% 11 10.0% 10<br />
7388 0.0% 6 0.0% 4<br />
7443 100.0% 5 17.2% 29<br />
7493 8.2% 17 3.2% 31<br />
7500 2.9% 58 27.3% 33<br />
7546 75.4% 20 44.4% 27<br />
7880 0.0% 9 n/a n/a<br />
8427 24.2% 23 6.3% 32<br />
8428 39.0% 42 28.6% 28<br />
8430 51.0% 61 54.5% 33<br />
8431 24.5% 80 55.6% 27<br />
8462 20.4% 6 3.4% 29<br />
8488 46.4% 7 20.0% 30<br />
8495 15.5% 12 38.5% 13<br />
8568 100.0% 1 100.0% 1<br />
4622x 4.4% 8 12.5% 8<br />
COBBLE 0.0% 7 n/a n/a<br />
n<br />
n/a<br />
The sample size. For user’s accuracy, this is <strong>the</strong> number of points mapped in this<br />
class. For producer’s accuracy, it is <strong>the</strong> number of points assigned to that class in<br />
<strong>the</strong> field.<br />
Not applicable. For user’s accuracy, no evaluation points were mapped in this<br />
class. For producer’s accuracy, no evaluation points were assigned to this class in<br />
<strong>the</strong> field.<br />
NatureServe LIRI - AA JUNE 2010 26
Table 4: Contingency Matrix for Best Match Considering Grouped Classes and Dominant, Secondary, and Tertiary Vegetation Class Matches<br />
Vegetation Classes Observed in <strong>the</strong> Field<br />
Mapped Vegetation Classes 3618 3914 4286 4539 8568 2591/6011/6327/7119/8462 3895/4098/7330/7880 4044/4048 4622/4622x 7192/7546 7244/8431/7247/7493/7500/8427 7443/7388/8428/8430/8488/8439 8495/COBBLE/4286 Totals<br />
3618 1 1<br />
3914 2 2<br />
4286 0 n/a<br />
4539 12 1 1 1 6 21<br />
8568 1 1<br />
2591/6011/6327/7119/8462 1 4 79 1 3 58 6 1 153<br />
3895/4098/7330/7880 1 4 37 3 2 11 2 60<br />
4044/4048 1 1 2<br />
4622/4622x 4 1 9 3 17<br />
7192/7546 8 14 1 1 1 25<br />
7244/8431/7247/7493/7500/8427 1 1 2 3 1 142 9 159<br />
7443/7388/8428/8430/8488/8439 2 4 1 4 1 21 85 118<br />
8495/COBBLE/4286 1 1 15 17<br />
Totals 3 5 1 23 1 93 49 4 12 20 225 121 19 576<br />
NatureServe LIRI - AA JUNE 2010 27
Table 5: Error Summaries Using <strong>the</strong> Combined Vegetation Classes<br />
Map Class<br />
Producer’s <strong>Accuracy</strong><br />
User’s <strong>Accuracy</strong><br />
<strong>Accuracy</strong> N <strong>Accuracy</strong> N<br />
3618 0.3% 3 100.0% 1<br />
3914 0.9% 5 100.0% 2<br />
4286 0.0% 1 n/a n/a<br />
4539 7.0% 23 57.1% 21<br />
8568 100.0% 1 100.0% 1<br />
2591/6011/6327/7119/8462 89.5% 93 44.1% 153<br />
3895/4098/7330/7880 73.6% 49 81.3% 60<br />
4044/4048 31.3% 4 50.0% 2<br />
4622/4622x 34.5% 12 53.3% 17<br />
7192/7546 76.0% 20 52.4% 25<br />
7244/8431/7247/7493/7500/8427 76.4% 225 86.3% 159<br />
7443/7388/8428/8430/8488/8431 71.4% 121 70.6% 118<br />
8495/COBBLE/4286 64.5% 19 92.9% 17<br />
n<br />
n/a<br />
The sample size. For user’s accuracy, this is <strong>the</strong> number of points mapped in this class. For<br />
producer’s accuracy, it is <strong>the</strong> number of points assigned to that class in <strong>the</strong> field.<br />
Not applicable. For user’s accuracy, no evaluation points were mapped in this class. For<br />
producer’s accuracy, no evaluation points were assigned to this class in <strong>the</strong> field.<br />
NatureServe LIRI - AA JUNE 2010 28
Table 6: GRTS-derived Weights Assigned to Each Mapped Vegetation Class<br />
Mapped Class<br />
GRTS-Assigned Weight<br />
2591 11302.32134<br />
3618 879.255739<br />
3895 810.3787711<br />
3914 877.5907264<br />
4044 9850.577673<br />
4098 6009.369742<br />
4539 4533.293969<br />
4622 2018.926127<br />
4622x 1921.084953<br />
6011 10704.60331<br />
6327 117331.7298<br />
7119 53666.09167<br />
7192 256.157755<br />
7244 142479.9994<br />
7330 2721.497807<br />
7388 2071.794051<br />
7443 4690.592876<br />
7493 129118.6412<br />
7500 18734.73473<br />
7546 5276.456422<br />
8427 190516.367<br />
8428 51488.65614<br />
8430 125283.6066<br />
8431 131527.7895<br />
8462 62019.51428<br />
8488 18080.3605<br />
8495 1409.074318<br />
8568 1092.078992<br />
NatureServe LIRI - AA JUNE 2010 29
Percentages<br />
COBBLE<br />
4622x<br />
8568<br />
8495<br />
8488<br />
8462<br />
8431<br />
8430<br />
8428<br />
8427<br />
7880<br />
7546<br />
7500<br />
7493<br />
7443<br />
7388<br />
7330<br />
7247<br />
7244<br />
7192<br />
7119<br />
6327<br />
6011<br />
4622<br />
4539<br />
4286<br />
4098<br />
4048<br />
4044<br />
3914<br />
3895<br />
3618<br />
2591<br />
Appendix C<br />
120.0<br />
100.0<br />
80.0<br />
Producer's <strong>Accuracy</strong><br />
User's <strong>Accuracy</strong><br />
60.0<br />
40.0<br />
20.0<br />
0.0<br />
Mapped Classes<br />
Figure 1: User’s and Producer’s accuracy measures for initial analysis.<br />
NatureServe LIRI - AA JUNE 2010 30
Percentages<br />
8495/COBBLE/4286<br />
7443/7388/8428/8430/8488/8439<br />
7244/8431/7247/7493/7500/8427<br />
7192/7546<br />
4622/4622x<br />
4044/4048<br />
3895/4098/7330/7880<br />
2591/6011/6327/7119/8462<br />
8568<br />
4539<br />
4286<br />
3914<br />
3618<br />
120.0<br />
100.0<br />
80.0<br />
Producer's <strong>Accuracy</strong><br />
User's <strong>Accuracy</strong><br />
60.0<br />
40.0<br />
20.0<br />
0.0<br />
Vegetation Classes<br />
Figure 2: User’s and Producer’s accuracy measures for <strong>the</strong> grouped analysis.<br />
NatureServe LIRI - AA JUNE 2010 31