Increasing the Spatial Resolution of Oversampled CRISM Images
Increasing the Spatial Resolution of Oversampled CRISM Images
Increasing the Spatial Resolution of Oversampled CRISM Images

Create successful ePaper yourself
Turn your PDF publications into a flip-book with our unique Google optimized e-Paper software.
43rd Lunar and Planetary Science Conference (2012)<br />
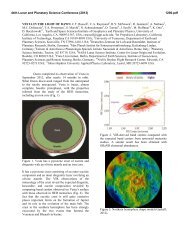
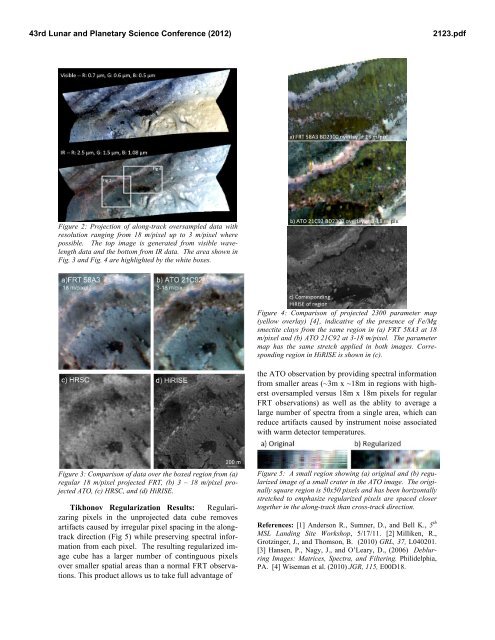
Figure 2: Projection <strong>of</strong> along-track oversampled data with<br />
resolution ranging from 18 m/pixel up to 3 m/pixel where<br />
possible. The top image is generated from visible wavelength<br />
data and <strong>the</strong> bottom from IR data. The area shown in<br />
Fig. 3 and Fig. 4 are highlighted by <strong>the</strong> white boxes.<br />
Figure 3: Comparison <strong>of</strong> data over <strong>the</strong> boxed region from (a)<br />
regular 18 m/pixel projected FRT, (b) 3 – 18 m/pixel projected<br />
ATO, (c) HRSC, and (d) HiRISE.<br />
Tikhonov Regularization Results: Regularizaring<br />
pixels in <strong>the</strong> unprojected data cube removes<br />
artifacts caused by irregular pixel spacing in <strong>the</strong> alongtrack<br />
direction (Fig 5) while preserving spectral information<br />
from each pixel. The resulting regularized image<br />
cube has a larger number <strong>of</strong> continguous pixels<br />
over smaller spatial areas than a normal FRT observations.<br />
This product allows us to take full advantage <strong>of</strong><br />
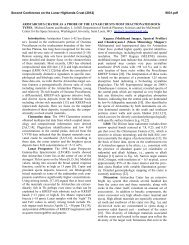
Figure 4: Comparison <strong>of</strong> projected 2300 parameter map<br />
(yellow overlay) [4], indicative <strong>of</strong> <strong>the</strong> presence <strong>of</strong> Fe/Mg<br />
smectite clays from <strong>the</strong> same region in (a) FRT 58A3 at 18<br />
m/pixel and (b) ATO 21C92 at 3-18 m/pixel. The parameter<br />
map has <strong>the</strong> same stretch applied in both images. Corresponding<br />
region in HiRISE is shown in (c).<br />
<strong>the</strong> ATO observation by providing spectral information<br />
from smaller areas (~3m x ~18m in regions with higherst<br />
oversampled versus 18m x 18m pixels for regular<br />
FRT observations) as well as <strong>the</strong> ablity to average a<br />
large number <strong>of</strong> spectra from a single area, which can<br />
reduce artifacts caused by instrument noise associated<br />
with warm detector temperatures.<br />
Figure 5: A small region showing (a) original and (b) regularized<br />
image <strong>of</strong> a small crater in <strong>the</strong> ATO image. The originally<br />
square region is 50x50 pixels and has been horizontally<br />
stretched to emphasize regularized pixels are spaced closer<br />
toge<strong>the</strong>r in <strong>the</strong> along-track than cross-track direction.<br />
References: [1] Anderson R., Sumner, D., and Bell K., 5 th<br />
MSL Landing Site Workshop, 5/17/11. [2] Milliken, R.,<br />
Grotzinger, J., and Thomson, B. (2010) GRL, 37, L040201.<br />
[3] Hansen, P., Nagy, J., and O’Leary, D., (2006) Deblurring<br />
<strong>Images</strong>: Matrices, Spectra, and Filtering. Philidelphia,<br />
PA. [4] Wiseman et al. (2010) JGR, 115, E00D18.<br />
2123.pdf