Increasing the Spatial Resolution of Oversampled CRISM Images
Increasing the Spatial Resolution of Oversampled CRISM Images
Increasing the Spatial Resolution of Oversampled CRISM Images

Create successful ePaper yourself
Turn your PDF publications into a flip-book with our unique Google optimized e-Paper software.
43rd Lunar and Planetary Science Conference (2012)<br />
INCREASING THE SPATIAL RESOLUTION OF OVERSAMPLED <strong>CRISM</strong> IMAGES AT GALE<br />
CRATER. A. A. Fraeman 1 , R. E. Arvidson 1 , B.L. Ehlmann 2 , J.A. McGovern 3 , R.E. Milliken 4 , S. L. Murchie 3 , F. P.<br />
Seelos 3 , K. D. Seelos 3 , 1 Washington University in St. Louis (afraeman@wustl.edu), 2 California Institue <strong>of</strong> Technology,<br />
3 Johns Hopkins Applied Physics Laboratory, 4 University <strong>of</strong> Notre Dame.<br />
Introduction: The Compact Reconaissance Imaging<br />
Spectrometer for Mars (<strong>CRISM</strong>) has begun using<br />
an observing scheme in which angular velocity <strong>of</strong> <strong>the</strong><br />
instrument’s motion-compensating gimbal is adjusted<br />
so that pixels are oversampled in <strong>the</strong> direction <strong>of</strong> gimbal<br />
movement (along-track). The spatial overlap in<br />
<strong>the</strong>se along-track oversampled (ATO) observations<br />
allow <strong>CRISM</strong> images to be processed to spatial resolutions<br />
better than <strong>the</strong> 18 m/pixel <strong>of</strong> full resolution targeted<br />
images (FRT). Here we describe characteristics<br />
<strong>of</strong> <strong>the</strong> ATO observations, discuss techniques for processing<br />
<strong>the</strong>se unique data products, and highlight results<br />
from an ATO acquired in December 2011 over Curiosity’s<br />
proposed traverse in Gale Crater.<br />
Along-Track <strong>Oversampled</strong> <strong>Images</strong>: At <strong>the</strong> time<br />
<strong>of</strong> this writing, 78 ATO observations have been acquired<br />
covering 55 separate scientific targets on Mars.<br />
Although <strong>the</strong> average spacing <strong>of</strong> projected pixel footprints<br />
along a column <strong>of</strong> an ATO observation is < 18<br />
m, <strong>the</strong> individual pixels are unevenly spaced because<br />
<strong>of</strong> jitter in <strong>the</strong> gimbal's motion. This behavior gives<br />
raw ATOs an unusual appearance and requires pixels<br />
to be regularized in <strong>the</strong> along-track direction before<br />
working with <strong>the</strong>se data. The ability to chose a target<br />
regularization spacing <strong>of</strong> < 18 m also allows for improved<br />
spatial resolution in <strong>the</strong> processed observation.<br />
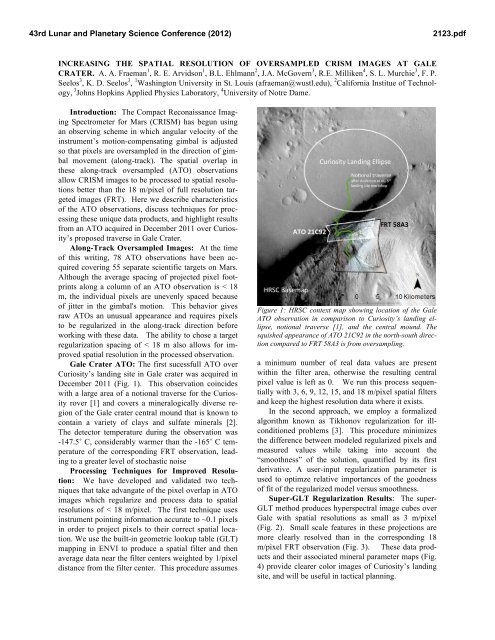
Gale Crater ATO: The first sucessfull ATO over<br />
Curiosity’s landing site in Gale crater was acquired in<br />
December 2011 (Fig. 1). This observation coincides<br />
with a large area <strong>of</strong> a notional traverse for <strong>the</strong> Curiosity<br />
rover [1] and covers a mineralogically diverse region<br />
<strong>of</strong> <strong>the</strong> Gale crater central mound that is known to<br />
contain a variety <strong>of</strong> clays and sulfate minerals [2].<br />
The detector temperature during <strong>the</strong> observation was<br />
-147.5˚ C, considerably warmer than <strong>the</strong> -165˚ C temperature<br />
<strong>of</strong> <strong>the</strong> corresponding FRT observation, leading<br />
to a greater level <strong>of</strong> stochastic noise<br />
Processing Techniques for Improved <strong>Resolution</strong>:<br />
We have developed and validated two techniques<br />
that take advangate <strong>of</strong> <strong>the</strong> pixel overlap in ATO<br />
images which regularize and process data to spatial<br />
resolutions <strong>of</strong> < 18 m/pixel. The first technique uses<br />
instrument pointing information accurate to ~0.1 pixels<br />
in order to project pixels to <strong>the</strong>ir correct spatial location.<br />
We use <strong>the</strong> built-in geometric lookup table (GLT)<br />
mapping in ENVI to produce a spatial filter and <strong>the</strong>n<br />
average data near <strong>the</strong> filter centers weighted by 1/pixel<br />
distance from <strong>the</strong> filter center. This procedure assumes<br />
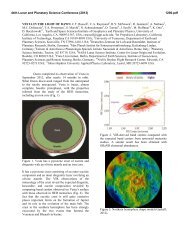
Figure 1: HRSC context map showing location <strong>of</strong> <strong>the</strong> Gale<br />
ATO observation in comparison to Curiosity’s landing ellipse,<br />
notional traverse [1], and <strong>the</strong> central mound. The<br />
squished appearance <strong>of</strong> ATO 21C92 in <strong>the</strong> north-south direction<br />
compared to FRT 58A3 is from oversampling.<br />
a minimum number <strong>of</strong> real data values are present<br />
within <strong>the</strong> filter area, o<strong>the</strong>rwise <strong>the</strong> resulting central<br />
pixel value is left as 0. We run this process sequentially<br />
with 3, 6, 9, 12, 15, and 18 m/pixel spatial filters<br />
and keep <strong>the</strong> highest resolution data where it exists.<br />
In <strong>the</strong> second approach, we employ a formalized<br />
algorithm known as Tikhonov regularization for illconditioned<br />
problems [3]. This procedure minimizes<br />
<strong>the</strong> difference between modeled regularized pixels and<br />
measured values while taking into account <strong>the</strong><br />
“smoothness” <strong>of</strong> <strong>the</strong> solution, quantified by its first<br />
derivative. A user-input regularization parameter is<br />
used to optimze relative importances <strong>of</strong> <strong>the</strong> goodness<br />
<strong>of</strong> fit <strong>of</strong> <strong>the</strong> regularized model versus smoothness.<br />
Super-GLT Regularization Results: The super-<br />
GLT method produces hyperspectral image cubes over<br />
Gale with spatial resolutions as small as 3 m/pixel<br />
(Fig. 2). Small scale features in <strong>the</strong>se projections are<br />
more clearly resolved than in <strong>the</strong> corresponding 18<br />
m/pixel FRT observation (Fig. 3). These data products<br />
and <strong>the</strong>ir associated mineral parameter maps (Fig.<br />
4) provide clearer color images <strong>of</strong> Curiosity’s landing<br />
site, and will be useful in tactical planning.<br />
2123.pdf
43rd Lunar and Planetary Science Conference (2012)<br />
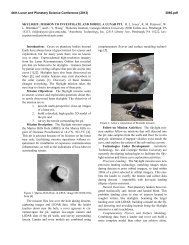
Figure 2: Projection <strong>of</strong> along-track oversampled data with<br />
resolution ranging from 18 m/pixel up to 3 m/pixel where<br />
possible. The top image is generated from visible wavelength<br />
data and <strong>the</strong> bottom from IR data. The area shown in<br />
Fig. 3 and Fig. 4 are highlighted by <strong>the</strong> white boxes.<br />
Figure 3: Comparison <strong>of</strong> data over <strong>the</strong> boxed region from (a)<br />
regular 18 m/pixel projected FRT, (b) 3 – 18 m/pixel projected<br />
ATO, (c) HRSC, and (d) HiRISE.<br />
Tikhonov Regularization Results: Regularizaring<br />
pixels in <strong>the</strong> unprojected data cube removes<br />
artifacts caused by irregular pixel spacing in <strong>the</strong> alongtrack<br />
direction (Fig 5) while preserving spectral information<br />
from each pixel. The resulting regularized image<br />
cube has a larger number <strong>of</strong> continguous pixels<br />
over smaller spatial areas than a normal FRT observations.<br />
This product allows us to take full advantage <strong>of</strong><br />
Figure 4: Comparison <strong>of</strong> projected 2300 parameter map<br />
(yellow overlay) [4], indicative <strong>of</strong> <strong>the</strong> presence <strong>of</strong> Fe/Mg<br />
smectite clays from <strong>the</strong> same region in (a) FRT 58A3 at 18<br />
m/pixel and (b) ATO 21C92 at 3-18 m/pixel. The parameter<br />
map has <strong>the</strong> same stretch applied in both images. Corresponding<br />
region in HiRISE is shown in (c).<br />
<strong>the</strong> ATO observation by providing spectral information<br />
from smaller areas (~3m x ~18m in regions with higherst<br />
oversampled versus 18m x 18m pixels for regular<br />
FRT observations) as well as <strong>the</strong> ablity to average a<br />
large number <strong>of</strong> spectra from a single area, which can<br />
reduce artifacts caused by instrument noise associated<br />
with warm detector temperatures.<br />
Figure 5: A small region showing (a) original and (b) regularized<br />
image <strong>of</strong> a small crater in <strong>the</strong> ATO image. The originally<br />
square region is 50x50 pixels and has been horizontally<br />
stretched to emphasize regularized pixels are spaced closer<br />
toge<strong>the</strong>r in <strong>the</strong> along-track than cross-track direction.<br />
References: [1] Anderson R., Sumner, D., and Bell K., 5 th<br />
MSL Landing Site Workshop, 5/17/11. [2] Milliken, R.,<br />
Grotzinger, J., and Thomson, B. (2010) GRL, 37, L040201.<br />
[3] Hansen, P., Nagy, J., and O’Leary, D., (2006) Deblurring<br />
<strong>Images</strong>: Matrices, Spectra, and Filtering. Philidelphia,<br />
PA. [4] Wiseman et al. (2010) JGR, 115, E00D18.<br />
2123.pdf