Download the PDF - Monash University
Download the PDF - Monash University
Download the PDF - Monash University

You also want an ePaper? Increase the reach of your titles
YUMPU automatically turns print PDFs into web optimized ePapers that Google loves.
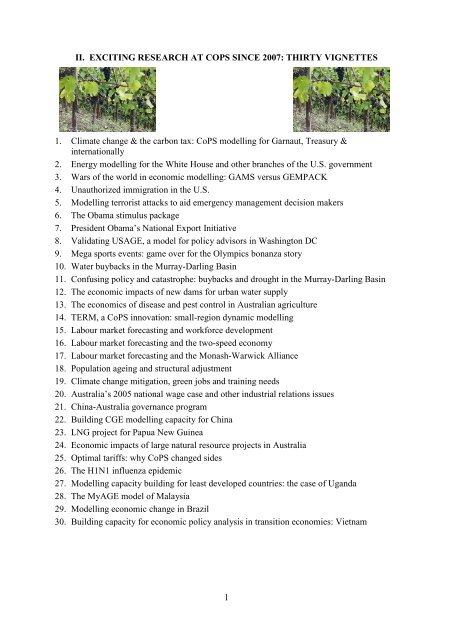
II. EXCITING RESEARCH AT COPS SINCE 2007: THIRTY VIGNETTES<br />
1. Climate change & <strong>the</strong> carbon tax: CoPS modelling for Garnaut, Treasury &<br />
internationally<br />
2. Energy modelling for <strong>the</strong> White House and o<strong>the</strong>r branches of <strong>the</strong> U.S. government<br />
3. Wars of <strong>the</strong> world in economic modelling: GAMS versus GEMPACK<br />
4. Unauthorized immigration in <strong>the</strong> U.S.<br />
5. Modelling terrorist attacks to aid emergency management decision makers<br />
6. The Obama stimulus package<br />
7. President Obama’s National Export Initiative<br />
8. Validating USAGE, a model for policy advisors in Washington DC<br />
9. Mega sports events: game over for <strong>the</strong> Olympics bonanza story<br />
10. Water buybacks in <strong>the</strong> Murray-Darling Basin<br />
11. Confusing policy and catastrophe: buybacks and drought in <strong>the</strong> Murray-Darling Basin<br />
12. The economic impacts of new dams for urban water supply<br />
13. The economics of disease and pest control in Australian agriculture<br />
14. TERM, a CoPS innovation: small-region dynamic modelling<br />
15. Labour market forecasting and workforce development<br />
16. Labour market forecasting and <strong>the</strong> two-speed economy<br />
17. Labour market forecasting and <strong>the</strong> <strong>Monash</strong>-Warwick Alliance<br />
18. Population ageing and structural adjustment<br />
19. Climate change mitigation, green jobs and training needs<br />
20. Australia’s 2005 national wage case and o<strong>the</strong>r industrial relations issues<br />
21. China-Australia governance program<br />
22. Building CGE modelling capacity for China<br />
23. LNG project for Papua New Guinea<br />
24. Economic impacts of large natural resource projects in Australia<br />
25. Optimal tariffs: why CoPS changed sides<br />
26. The H1N1 influenza epidemic<br />
27. Modelling capacity building for least developed countries: <strong>the</strong> case of Uganda<br />
28. The MyAGE model of Malaysia<br />
29. Modelling economic change in Brazil<br />
30. Building capacity for economic policy analysis in transition economies: Vietnam<br />
1
1. Climate change & <strong>the</strong> carbon-tax: CoPS’ modelling for Garnaut, Treasury and internationally<br />
Clients: Federal Departments of Treasury,<br />
Climate Change, Prime Minister & Cabinet; State<br />
Treasuries; PWC; Deloittes; Ernst & Young;<br />
Frontier Economics; BlueScope Steel; NAB;<br />
Chevron and Woodside Petroleum; <strong>the</strong> Garnaut<br />
Review; CSIRO<br />
Researchers: Prof. Philip Adams & Mr Kevin<br />
Hanslow<br />
Summary & impact: The biggest hot potato in<br />
Australian politics over <strong>the</strong> last 5 years has been<br />
climate change. Kevin Rudd won <strong>the</strong> 2007 election<br />
promising carbon trading. Malcolm Turnbull lost<br />
<strong>the</strong> Liberal leadership by agreeing. Rudd lost<br />
traction in <strong>the</strong> polls and eventually <strong>the</strong> prime<br />
ministership by backing down from his climatechange<br />
policy. Julia Gillard promised no carbon<br />
tax but changed her mind. Tony Abbott is<br />
determined to make <strong>the</strong> carbon tax and Gillard’s<br />
credibility <strong>the</strong> principal focus of <strong>the</strong> next Federal<br />
election.<br />
Since 2008, major Australian studies on <strong>the</strong><br />
economic effects of climate-change policies have<br />
been conducted by Garnaut and Treasury, each<br />
with various emission-reducing scenarios and with<br />
CoPS providing <strong>the</strong> central modelling analyses. On<br />
business-as-usual assumptions CoPS’ modelling<br />
showed Australia’s CO2-equivalent emissions<br />
rising from 528Mt in 2010 to 710Mt in 2030,<br />
Table 1. Australia’s emissions are dominated by<br />
electricity generation and transport with<br />
agriculture also significant. The last column in<br />
Table 1 refers to a worldwide emissions trading<br />
scheme (ETS) in which Australia commits to<br />
restraining its emissions in 2030 to <strong>the</strong>ir 2010 level.<br />
CoPS showed that Australia could achieve <strong>the</strong><br />
target in <strong>the</strong> last column at moderate cost in macro<br />
terms: no more than a 1.5% reduction in GDP<br />
phased in over 20 years. This is equivalent to 5<br />
months of GDP growth, meaning that Australians<br />
would have to wait until May 31, 2030 to reach <strong>the</strong><br />
standard of living <strong>the</strong>y o<strong>the</strong>rwise would have<br />
reached by January 1, 2030. But it is not macro<br />
effects that inflame <strong>the</strong> passions evident in <strong>the</strong><br />
photo. People worry that <strong>the</strong> costs will not be<br />
spread equitably. CoPS results were disaggregated<br />
to 50 industries and 57 regions. This level of<br />
detail gives an evidence-based foundation for<br />
compensation packages.<br />
Frequent reference in <strong>the</strong> press continue to be<br />
made to Treasury’s greenhouse modelling. This<br />
refers to fur<strong>the</strong>r Treasury applications using <strong>the</strong><br />
2<br />
CoPS’ model, now embedded in Treasury and<br />
supported by CoPS.<br />
The expertise of CoPS in greenhouse modelling is<br />
recognised internationally. Our services are<br />
currently being used in <strong>the</strong> U.S., China, Taiwan,<br />
Brazil and Japan and our advice is sought widely.<br />
Table 1. Australia’s CO2-e emissions (Mt)<br />
Baseline ETS<br />
policy<br />
2010 2030 2030<br />
Electricity & o<strong>the</strong>r stationary<br />
fuel combustion,<br />
279 332 285<br />
Transport 85 117 103<br />
Fugitive emissions<br />
e.g. from mining<br />
36 70 41<br />
Industrial processes 31 41 18<br />
Agriculture 93 120 99<br />
Waste disposal 19 23 6<br />
Forestry -15 6 -24<br />
Total 528 710 528<br />
Most of our greenhouse studies have ignored<br />
damage from climate change. They include <strong>the</strong><br />
cost of mitigation, but not <strong>the</strong> benefits from<br />
damage limitation. Integrated Assessment Models<br />
(IAMs) deal with mitigation benefits as well as<br />
costs. CoPS is currently working with CSIRO in a<br />
project to build Australia’s first IAM. Papers coauthored<br />
with <strong>the</strong> CSIRO arising from this work<br />
have been presented at MODSIM 2011 & AARES<br />
2012.<br />
Publications: Adams, P. (2007), “Insurance against<br />
Catastrophic Climate Change: How Much Will and<br />
Emissions Trading Scheme Cost Australia?”, The<br />
Australian Economic Review”, 40(4). 432-52.<br />
Adams, P. & B. Parmenter (2012), “CGE modeling of<br />
environmental issues in Australia”, in P. Dixon & D.<br />
Jorgenson (eds) Handbook of CGE Modeling,<br />
Elsevier, forthcoming.<br />
Adams, P (2012), “Economic Aspects of Integrated<br />
Assessment Modeling”, in Academy of Science,<br />
Australia in 2050, forthcoming.
2. Energy modelling for <strong>the</strong> White House and o<strong>the</strong>r branches of <strong>the</strong> U.S. government<br />
Clients: The White House and <strong>the</strong> U.S. Dept. of Treasury, Commerce, Agriculture and Energy<br />
Researchers Professor Peter Dixon, Professor Maureen Rimmer and Dr Ashley Winston<br />
Summary & impact: In January 2010, Carol M. Browner (Assistant to President Obama on Energy<br />
and Climate Change) wrote to <strong>the</strong> Chairman of <strong>the</strong> U.S. International Trade Commission (ITC)<br />
thanking him for making available <strong>the</strong> services of Dr Fox and Dr Winston to work on <strong>the</strong> White<br />
House’s submission to <strong>the</strong> Senate on <strong>the</strong> Waxman-Markey Bill about greenhouse gas emissions. In<br />
part <strong>the</strong> letter read<br />
“Quite simply, without <strong>the</strong>ir contributions, we could not have produced much of <strong>the</strong> analysis that<br />
we offered <strong>the</strong> Senate in <strong>the</strong> report.”<br />
What is CoPS connection with this? Ashley Winston was out-posted from CoPS to <strong>the</strong> ITC. His<br />
contribution to <strong>the</strong> White House study was made<br />
with <strong>the</strong> USAGE model developed by CoPS.<br />
The White House letter<br />
(http://www.monash.edu.au/policy/ftp/whitehouseletter.pdf )<br />
is testament to <strong>the</strong> extraordinary level of<br />
influence that CoPS modellers are having on<br />
major issues in <strong>the</strong> U.S.<br />
The work for <strong>the</strong> White House is part of an<br />
ongoing series of energy projects undertaken by<br />
CoPS for branches of <strong>the</strong> U.S. government. The<br />
first of <strong>the</strong>se projects was commissioned by <strong>the</strong><br />
U.S. Department of Commerce in response to<br />
President Bush’s 2006 Energy Policy which<br />
called for a reduction in reliance on imported oil.<br />
Commerce asked CoPS to project <strong>the</strong> effects of replacing 25 per cent of imported crude oil with<br />
domestic ethanol by 2020. Using <strong>the</strong> USAGE model we quantified four benefits. The first is <strong>the</strong><br />
substitution of what by 2020 seemed likely to be a cheaper fuel (ethanol) for a more expensive fuel<br />
(oil). Realization of this benefit depends on <strong>the</strong> price of oil averaging about $U.S.70 a barrel in <strong>the</strong><br />
long run and on continuation of <strong>the</strong> downward trend in <strong>the</strong> cost of cellulosic ethanol. The second<br />
benefit is downward pressure on <strong>the</strong> world price of oil caused by a cut in U.S. demand. The third<br />
benefit is an improvement in <strong>the</strong> U.S. terms of trade brought about by a reduction in <strong>the</strong> U.S. import<br />
bill and a consequent reduction in exports with a resulting increase in <strong>the</strong>ir price. The fourth benefit is<br />
an improvement in farm incomes, causing a delay in <strong>the</strong> retirement of U.S. farmers.<br />
Our analysis created interest from o<strong>the</strong>r departments. The U.S. Department of Agriculture<br />
commissioned us to extend <strong>the</strong> agricultural coverage of USAGE to draw out <strong>the</strong> connection between<br />
large-scale ethanol production and food prices. The U.S. Department of Energy commissioned us to<br />
link USAGE to <strong>the</strong>ir detailed electricity model, NEMS. Currently we are working on a second project<br />
for <strong>the</strong> Department of Energy concerned with <strong>the</strong> Renewable Fuel Standard which mandates levels for<br />
<strong>the</strong> use of ethanol and o<strong>the</strong>r renewable fuels in <strong>the</strong> U.S. over <strong>the</strong> next 10 years.<br />
Publications:<br />
Gehlhar, M., A. Somwaru, P. Dixon, M. Rimmer and A.R. Winston (2010), “Economywide Implications from<br />
US Bioenergy Expansion”, American Economic Review: Papers & Proceedings, Vol. 100(3), May, 172-77.<br />
Dixon, P.B., S. Osborne and M.T. Rimmer (2007), “The economy-wide effects in <strong>the</strong> United States of replacing<br />
crude petroleum with biomass”, Energy and Environment, 18(6), 2007, pp. 709-722.<br />
6
3. Wars of <strong>the</strong> world in economic modelling: GAMS versus GEMPACK<br />
Client: GEMPACK software used in over 600 sites around <strong>the</strong> world<br />
Researchers: Professor Ken Pearson, Professor Mark Horridge and Dr Michael Jerie<br />
Summary & impact: Global financial crisis, illegal immigration, greenhouse-gas pollution and freetrade<br />
agreements are just a few of <strong>the</strong> topics analysed by economy-wide models. These models,<br />
known in economics jargon as computable general equilibrium (CGE) models, are large ma<strong>the</strong>matical<br />
systems describing <strong>the</strong> interconnections between a myriad of economic actors. To solve <strong>the</strong>m<br />
requires sophisticated software. On this issue <strong>the</strong> world is divided into two camps: <strong>the</strong> modellers who<br />
use GAMS software and those who use GEMPACK. Both software platforms are extensively used by<br />
governments and academics around <strong>the</strong> world: at any time <strong>the</strong>re are around 10,000 active CGE<br />
modellers.<br />
GAMS was developed by Alex Meeraus and o<strong>the</strong>r researchers at <strong>the</strong> World Bank and adapted for<br />
economy-wide modelling in <strong>the</strong> 1980s. In recent times <strong>the</strong> leading GAMS developer has been Tom<br />
Ru<strong>the</strong>rford, originally from Stanford. GEMPACK was pioneered in <strong>the</strong> 1980s by Ken Pearson of<br />
<strong>Monash</strong> <strong>University</strong>’s Centre of Policy Studies and its ongoing development at <strong>Monash</strong> has been led<br />
by Ken and his colleagues Mark Horridge and Michael Jerie.<br />
In June 2011 Alex, Tom, Ken and Mark met at <strong>the</strong> World Bank in<br />
Washington DC to slug it out. Their two software platforms were set<br />
solution tasks on models of increasing size. The bout was conducted<br />
over 8 rounds. The verdict was a knock out win for Australia’s<br />
GEMPACK which outperformed GAMS at 8 model sizes from 100 to<br />
500 sectors. The time difference at high dimensions is so dramatic<br />
that a log scale was needed, when depicting time-taken versus number<br />
of sectors, in order to get <strong>the</strong> GEMPACK and GAMS times on <strong>the</strong> same graph (see Figure 1).<br />
seconds<br />
10000<br />
1000<br />
100<br />
10<br />
Figure 1. Solution time (log-scale) versus size of model (no. of sectors)<br />
1<br />
100 150 200 250<br />
sectors<br />
300 350 400 500<br />
GEMPACK is used at more than 600 sites around <strong>the</strong> world including <strong>the</strong> World Bank, IMF, <strong>the</strong><br />
Asian Development Bank, and numerous government departments and universities in more than 90<br />
countries including U.S.A., China, Australia, Ireland, Germany, France, <strong>the</strong> Ne<strong>the</strong>rlands, Finland,<br />
Japan, Brazil, Vietnam, Malaysia, Taiwan, PNG.<br />
Publication:<br />
Horridge, M., A. Meeraus, K. Pearson and T. Ru<strong>the</strong>rford (2012), “Solution software for CGE modelling”, in P.B.<br />
Dixon and D.W. Jorgenson (editors) Handbook of Computable General Equilibrium Modeling, Elsevier,<br />
forthcoming.<br />
7<br />
GAMS<br />
GEMPACK
4. Unauthorized immigration in <strong>the</strong> U.S.<br />
Clients: U.S. Department of Commerce; U.S. Department of Homeland Security; U.S.<br />
Department of Agriculture; Cato Institute<br />
Researchers: Professor Peter B. Dixon and Professor Maureen T. Rimmer<br />
Summary & impact:<br />
In 2008 <strong>the</strong>re were 8.3 million unauthorized<br />
foreign workers in <strong>the</strong> U.S employed mainly in<br />
low-skilled occupations. On baseline trends<br />
this will reach 12.4 million in 2019. The U.S.<br />
Departments of Homeland Security and<br />
Commerce commissioned us to conduct<br />
simulations with our U.S. model, USAGE, on<br />
<strong>the</strong> effects of policies to reduce unauthorized<br />
employment in 2019 by 3.6 million, to 8.8<br />
million. We looked at <strong>the</strong> effects of restricting<br />
supply via tighter border security and <strong>the</strong><br />
effects of restricting demand via penalties on<br />
employers. Our simulations showed that <strong>the</strong>se<br />
policies would inflict significant long-run<br />
costs on legal residents of <strong>the</strong> U.S. The most<br />
important of <strong>the</strong>se was what we called <strong>the</strong><br />
Occupation-mix effect. With less low-skilled<br />
migrants, <strong>the</strong> U.S. economy would be smaller<br />
with fewer jobs in all occupations. New legal<br />
entrants to <strong>the</strong> workforce would find reduced<br />
employment opportunities in skilled<br />
occupations (smaller economy) and increased<br />
opportunities in low-skilled occupations<br />
(vacancies created by reduction in low-skilled<br />
migrants). In this way <strong>the</strong> occupational-mix of<br />
legal employment would be slanted towards<br />
low-skilled, low-paid jobs.<br />
Following this work, we were commissioned<br />
by <strong>the</strong> Cato Institute (a high profile<br />
Washington think-tank) to look at <strong>the</strong> effects<br />
of <strong>the</strong> opposite approach: increasing <strong>the</strong><br />
number of low-skilled migrants via a guest<br />
worker program. Our work for Cato received<br />
widespread publicity including an editorial in<br />
<strong>the</strong> Wall Street Journal (Aug 19, 2009) and an<br />
article in Newsweek (Aug 31, 2009), as well<br />
as coverage in many leading provincial<br />
newspapers. We presented <strong>the</strong> research at a<br />
seminar (Aug 14, 2009) on Capitol Hill<br />
attended by over 100 Congressional advisers<br />
and media representatives. The seminar was<br />
televised and shown throughout <strong>the</strong> U.S. on C-<br />
Span.<br />
Interest in our work continues while <strong>the</strong> U.S.<br />
government grapples to find a rational<br />
8<br />
approach to <strong>the</strong> illegal immigration problem.<br />
Recently we have completed a project for <strong>the</strong><br />
U.S. Department of Agriculture on <strong>the</strong> role of<br />
unauthorized migrants in U.S. agriculture.<br />
With funding from Agriculture, this project is<br />
currently being extended to look at <strong>the</strong><br />
implications of different approaches to<br />
immigration policy in <strong>the</strong> context of <strong>the</strong> U.S.<br />
recession.<br />
Publications:<br />
Dixon P.B. and M.T. Rimmer (2009), “Restriction<br />
or legalization? Measuring <strong>the</strong> economic<br />
benefit of immigration reform”, Trade Policy<br />
Analysis, 40, Cato Institute, Washington DC,<br />
pp.24, available at<br />
http://www.freetrade.org/node/949.<br />
Dixon P.B. and M.T. Rimmer (2010), “U.S.<br />
imports of low-skilled labor: restrict or<br />
liberalize?”, chapter 5, pp. 103-51 in John<br />
Gilbert (editor) New Developments in<br />
Computable General Equilibrium Analysis of<br />
Trade Policy, Volume 7 of H. Beladi and K.<br />
Choi (series editors) Frontiers of Economics<br />
and Globalization, Emerald Publishing, UK.<br />
Dixon P.B., M. Johnson and M.T. Rimmer (2011),<br />
“Economy-wide effects of reducing illegal<br />
immigrants in U.S. employment” Contemporary<br />
Economic Policy, Vol. 29(1), January, 2011, pp.<br />
14-30.<br />
Zahniser, S., T. Hertz, P.B. Dixon and M.T.<br />
Rimmer, “Immigration policy and its possible<br />
effects on U.S. agriculture and <strong>the</strong> market for<br />
hired farm labor: a simulation analysis”,<br />
American Journal of Agricultural Economics,<br />
2012, forthcoming
1. Modelling terrorist attacks to aid emergency management decision makers<br />
Clients: Center for Risk and Economic Analysis of Terrorism Events (CREATE);<br />
U.S. Department of Homeland Security (DHS).<br />
Researchers: Dr James Giesecke, Professor Peter Dixon and Professor Maureen Rimmer<br />
Summary & impact: DHS was established in<br />
response to <strong>the</strong> 9/11 attacks. With o<strong>the</strong>r U.S.<br />
security, emergency management and public<br />
health agencies, DHS makes contingency<br />
plans for threat scenarios. Working with<br />
CREATE, a DHS-funded research centre at<br />
<strong>the</strong> <strong>University</strong> of Sou<strong>the</strong>rn California, CoPS<br />
has investigated several of <strong>the</strong>se scenarios.<br />
Our first study was in response to a DHS and<br />
U.S. Treasury request for analysis of a<br />
shutdown of U.S. borders to movements of<br />
people and goods. Such a policy is a possible<br />
reaction to threats from a pandemic or<br />
international terrorism. Using CoPS’ USAGE<br />
model of <strong>the</strong> U.S., we found that <strong>the</strong> cost of<br />
full border closure would be severe, with <strong>the</strong><br />
possibility of a GDP collapse in <strong>the</strong> vicinity of<br />
50%. Banning ‘bottleneck’ imports, like oil,<br />
contributes disproportionately to <strong>the</strong> policy’s<br />
cost. However, drawing on inventories of <strong>the</strong>se<br />
commodities, such as <strong>the</strong> Strategic Petroleum<br />
Reserve, alleviates <strong>the</strong> GDP impact by 8<br />
percentage points. Exempting bottleneck<br />
imports from <strong>the</strong> ban alleviates <strong>the</strong> GDP<br />
impact by a fur<strong>the</strong>r 30 percentage points.<br />
These results highlight <strong>the</strong> importance of<br />
selectivity and strategic commodity reserves,<br />
should border closure ever be contemplated.<br />
Subsequently we examined specific threat<br />
scenarios. We began by developing a<br />
framework for modelling any U.S. sub-region<br />
as an individual economy. To our knowledge,<br />
<strong>the</strong> 400-sector models that can be generated in<br />
this framework are <strong>the</strong> largest and most<br />
flexible CGE models yet developed for U.S.<br />
regions. We used <strong>the</strong> new framework to<br />
generate a model of Los Angeles (LA) and<br />
applied it to two DHS Planning Scenarios:<br />
“Chemical Attack-Chlorine Tank Explosion”<br />
and “Radiological Attack-Radiological<br />
Dispersal Devices (RDD)”.<br />
In <strong>the</strong> short-run, <strong>the</strong> economic effects of such<br />
events are dominated by <strong>the</strong> consequences of<br />
business interruption. Longer-term, behavioral<br />
effects from heightened risk perceptions may<br />
generate significant ongoing economic costs.<br />
9<br />
The importance of business interruption and<br />
behavioural effects in determining <strong>the</strong> total<br />
economic costs of such events suggests a big<br />
role for policy intervention. Business<br />
interruption might be minimised by<br />
expeditious site clean-up, judicious application<br />
of environmental regulations, and effective<br />
communication of decontamination efforts.<br />
Prior planning to resolve potential conflicts<br />
among stakeholders could fur<strong>the</strong>r lessen<br />
delays in getting business back to work.<br />
Policy makers are already keenly aware of <strong>the</strong><br />
importance of alleviating terrorism’s adverse<br />
behavioural impacts, as is evident to all who<br />
have experienced <strong>the</strong> ‘security <strong>the</strong>atre’ of air<br />
travel.<br />
Our terrorism research has created modelling<br />
capacity allowing us to extend our U.S. client<br />
base. A dynamic fiscal model for Florida is<br />
currently being built for <strong>the</strong> Florida<br />
Legislature via our regional modelling<br />
framework.<br />
Publications:<br />
Giesecke, J, W. Burns, A. Barret, E. Bayrak, A.<br />
Rose, P. Slovic & M. Suher. “Assessment of <strong>the</strong><br />
regional economic impacts of catastrophic events:<br />
CGE analysis of resource loss and behavioral<br />
effects of an RDD attack scenario”. Risk Analysis,<br />
forthcoming.<br />
Giesecke, J. (2011) “Development of a large-scale<br />
single U.S. region CGE model using IMPLAN<br />
data”. Spatial Economic Analysis. 6(3): 331-350.<br />
Dixon, P., J. Giesecke, M. Rimmer & A. Rose.<br />
(2011) "The economic costs to <strong>the</strong> U.S. of closing<br />
its borders: a CGE analysis". Defence and Peace<br />
Economics 22(1): 85–97.
6. The Obama stimulus package<br />
Clients: U.S. Dept. of Commerce, U.S. International Trade Commission<br />
Researchers: Prof. Peter B. Dixon and Prof. Maureen T. Rimmer<br />
Summary & impact: In November 2008 it was apparent that <strong>the</strong> U.S.<br />
would slide into a serious recession in 2009. Newly elected President<br />
Obama proposed a Keynesian stimulus package. We were commissioned by <strong>the</strong> U.S. Department of<br />
Commerce and <strong>the</strong> International Trade Commission to model <strong>the</strong> likely effects.<br />
Main stream economists had severe doubts about <strong>the</strong> efficacy of Keynsian policies, and <strong>the</strong>se doubts<br />
were reflected in political opposition to <strong>the</strong> package. However, our results in Figures 1 and 2 strongly<br />
supported <strong>the</strong> package. The area between <strong>the</strong> lines in Figure 1 shows <strong>the</strong> benefits at <strong>the</strong> macro level,<br />
summing to about 32% of one year’s GDP. Figure 2 shows that <strong>the</strong> package strongly limits<br />
recessionary damage to nearly every industry. For example, it reduces <strong>the</strong> cumulated output loss to<br />
<strong>the</strong> construction industry from 186% of a year’s output to 119%.<br />
We are pleased to note that mainstream opinion has moved into line with our analysis ( see<br />
http://www.igmchicago.org/igm-economic-experts-panel/poll-results?SurveyID=SV_cw5O9LNJL1oz4Xi ).<br />
Figure 1. Percentage effect of recession on real GDP with and without Obama package<br />
2<br />
0<br />
2007<br />
-2<br />
2008 2009 2010 2011 2012 2013 2014 2015<br />
-4<br />
-6<br />
-8<br />
-10<br />
-12<br />
-14<br />
-16<br />
15<br />
-35<br />
-85<br />
-135<br />
-185<br />
-235<br />
-7.8<br />
-10.1<br />
-8.9<br />
Obama package<br />
-15.1<br />
Figure 2. Effect of Recession on industry outputs 2008-15, per cent of one year’s output<br />
Dwellings<br />
Wood furniture<br />
Construction<br />
Machinery<br />
Communications<br />
Trade margins<br />
Export tourism<br />
Auto rentals<br />
Utilities<br />
Transport margins<br />
Metal prods<br />
Gov enterprises<br />
Agric serv<br />
With package<br />
Manufacture NEC<br />
Business serv<br />
Vacation<br />
Footwear<br />
Misc. serv<br />
Motor veh<br />
Without package<br />
Medical serv<br />
Dairy, sugar<br />
Publication: Dixon, P.B. and M.T. Rimmer (2011), “You can’t have a CGE recession without excess<br />
capacity”, Economic Modelling, Vol. 28(1-2), January-March, pp. 602-13.<br />
10<br />
No package<br />
Tobacco prods<br />
Paper, Publish<br />
Social serv<br />
Chemicals<br />
Agriculture<br />
Education<br />
Computers<br />
Elect mach<br />
Food manu<br />
Mining<br />
Textiles<br />
Govt serv<br />
Apparel<br />
Tranport equip<br />
Petrol prods
7. President Obama’s National Export Initiative<br />
Clients: U.S. Department of Commerce, U.S. International Trade Commission<br />
Researchers: Professor Peter B. Dixon and Professor Maureen T. Rimmer<br />
Summary & impact:<br />
President Obama’s National Export Initiative (NEI) is targeted at doubling U.S. exports between 2010<br />
and 2015. We were commissioned by <strong>the</strong> U.S.<br />
Department of Commerce to apply <strong>the</strong> USAGE model<br />
(developed at CoPS) to look at <strong>the</strong> effectiveness of<br />
different policies in achieving <strong>the</strong> NEI target and what<br />
this would contribute to lifting <strong>the</strong> U.S. out of <strong>the</strong><br />
current recession.<br />
Via USAGE simulations we found a package of<br />
policies (export promotion, cost reduction,<br />
information provision) that would achieve <strong>the</strong> NEI<br />
target. In <strong>the</strong> absence of <strong>the</strong>se policies we estimate<br />
<strong>the</strong> total cost of <strong>the</strong> current recession at 70 million<br />
one-year jobs. This is <strong>the</strong> area between <strong>the</strong> USAGE<br />
no-recession business-as-usual path for employment from 2008 to 2020 and <strong>the</strong> USAGE path for<br />
recession with natural recovery (no new export-promotion initiatives). With <strong>the</strong> NEI policies <strong>the</strong> cost<br />
of <strong>the</strong> recession would be reduced to 45 million jobs. On this basis we estimate that doubling exports<br />
would generate 25 million one-year jobs (<strong>the</strong> area between <strong>the</strong> paths for natural recovery and export<br />
doubling in <strong>the</strong> figure below).<br />
1.25<br />
1.2<br />
1.15<br />
1.1<br />
1.05<br />
1<br />
index<br />
no recession<br />
Paths for U.S. employment<br />
recession with export doubling<br />
0.95<br />
2007 2008 2009 2010 2011 2012 2013 2014 2015 2016 2017 2018 2019 2020<br />
Our report on <strong>the</strong> NEI was circulated in <strong>the</strong> U.S. Department of Commerce and presented by<br />
Professor Dixon to <strong>the</strong> Commissioners at <strong>the</strong> U.S. International Trade Commission. The report is<br />
playing two roles. First, it is providing policy people, who have a feel for how export promotion<br />
programs affect sales for specific products, with an estimate of how much policy effort will be<br />
required to achieve <strong>the</strong> NEI target. This is important in <strong>the</strong>ir budgeting and goal setting. Second, by<br />
demonstrating <strong>the</strong> benefits of successful implementation of <strong>the</strong> NEI in recessionary conditions, <strong>the</strong><br />
analysis is helping proponents to argue for <strong>the</strong> program against alternative proposals.<br />
Publication:<br />
Dixon, P.B. and M.T. Rimmer (2012) “Doubling U.S. Exports under <strong>the</strong> President's National Export Initiative:<br />
Implications of successful implementation” Contemporary Economic Policy, forthcoming.<br />
11<br />
25<br />
million<br />
jobs<br />
recession with natural recovery
8. Validating USAGE, a model for policy advisors in Washington DC<br />
Clients: U.S. International Trade Commission and <strong>the</strong> U.S. Departments of Commerce,<br />
Agriculture, Homeland Security and Energy<br />
Researchers: Prof. Peter B. Dixon, Prof. Maureen T. Rimmer, Dr Ashley Winston, Dr James<br />
Giesecke, Dr Glyn Wittwer, Dr George Verikios, Prof. John Madden, Mr Peter Mavromatis<br />
Summary & impact: In 1999, CoPS undertook high-profile research opposing John Howard’s GST,<br />
an activity that severely limited our short-term prospects for fur<strong>the</strong>r Canberra-based projects. At <strong>the</strong><br />
same time, <strong>the</strong> exchange rate dropped 49c U.S. per $A. Putting <strong>the</strong>se two factors toge<strong>the</strong>r, developing<br />
a U.S. model to support sales of modelling services into <strong>the</strong> U.S. looked like a good idea. With initial<br />
support from <strong>Monash</strong>’s Faculty of Business and Economics, CoPS undertook two years work to<br />
create <strong>the</strong> first version of <strong>the</strong> USAGE model (U.S. Applied General Equilibrium).<br />
Interest in <strong>the</strong> model in Washington is mainly centred on applications. However, led by <strong>the</strong> U.S.<br />
International Trade Commission, policy departments of <strong>the</strong> U.S. government recognised that an<br />
economic model can survive only if it is continuously tested, updated and improved. Consequently,<br />
in recent years, CoPS has received a steady flow of funding from <strong>the</strong> U.S. government to support<br />
ongoing development and maintenance of USAGE. Perhaps <strong>the</strong> most important development project<br />
concerns validation: how do we know <strong>the</strong> model really works?<br />
Figure 1 shows results from a validation test in which USAGE<br />
forecasts for 500 industries were generated for 1998-2005 using<br />
only data available in 1998. These forecasts were pitted against<br />
forecasts for 1998-2005 based on trends from 1992 to 1998. As<br />
shown in <strong>the</strong> figure, most of <strong>the</strong> industry dots lie below <strong>the</strong> 45degree<br />
line, indicating that USAGE beat trend. The average<br />
USAGE error was only 0.58 times <strong>the</strong> average trend error.<br />
Research is now continuing on outlier dots. Why did USAGE do so badly on Asbestos products? On<br />
<strong>the</strong> o<strong>the</strong>r hand, why did USAGE do so well in Railroad equipment?<br />
Figure 1. Percentage forecast errors for industry outputs, 1998-2005:<br />
extrapolated 1992-98 trend versus genuine USAGE forecast<br />
Publications: Dixon, P.B. and M.T. Rimmer (2010), “Validating a detailed, dynamic CGE model of <strong>the</strong> U.S.”,<br />
Economic Record, 86(Special issue), September, pp. 22-34.<br />
Dixon, P.B. and M.T. Rimmer (2012), “Validation in CGE modelling”, in P.B. Dixon and D.W. Jorgenson<br />
(editors) Handbook of Computable General Equilibrium Modeling, Elsevier, forthcoming.<br />
12
9. Mega sporting events: game over for <strong>the</strong> Olympics bonanza story<br />
Clients: Department of Industry, Tourism & Resources, PWC, KPMG, Ernst & Young,<br />
Cricket Australia<br />
Researchers: Professor John Madden, Dr James Giesecke and Professor Philip Adams<br />
Summary & impact:<br />
When cities and countries are selected to host a mega sporting event such as <strong>the</strong> Olympic<br />
Games or <strong>the</strong> FIFA (Soccer) World Cup <strong>the</strong>re is normally great rejoicing by <strong>the</strong>ir citizens.<br />
But is <strong>the</strong> mega-event host really a winner? Mega sporting events are generally highly<br />
subsidized affairs with taxpayers of <strong>the</strong> host<br />
city/state/country picking up a bill that can amount<br />
to billions of dollars.<br />
CoPS researchers have been commissioned to model<br />
<strong>the</strong> economic effects of many of Australia’s biggest<br />
sporting events, including: <strong>the</strong> 2000 Sydney<br />
Olympics, <strong>the</strong> bid for <strong>the</strong> 2018 FIFA World Cup, <strong>the</strong><br />
2003 Rugby World Cup, <strong>the</strong> Melbourne Grand Prix,<br />
<strong>the</strong> Australian Tennis Open and <strong>the</strong> Ashes series.<br />
Because CoPS’ modelling accounts for <strong>the</strong> various<br />
constraints on an economy, it does not project <strong>the</strong><br />
very large economic benefits that proponents claim for mega sporting events. A recent CoPS<br />
study on <strong>the</strong> Sydney Olympics emphasizes <strong>the</strong> importance of avoiding sources of benefit<br />
overestimation such as assumptions that factor supplies are elastic, that public inputs are<br />
costless and that foreign tourism demands are strongly stimulated. As opposed to most o<strong>the</strong>r<br />
economic impact studies which are undertaken before <strong>the</strong> event, <strong>the</strong> CoPS study of <strong>the</strong><br />
Sydney Olympics is an ex-post one. It first examines <strong>the</strong> question of whe<strong>the</strong>r <strong>the</strong> predicted<br />
impact on tourism actually materialized. It does this by conducting an historical simulation<br />
from 1997/98 to 2005/06 to assess <strong>the</strong> extent to which Olympics-induced awareness<br />
increased foreign demand for tourism in Australia. The historical results which are driven by<br />
observed values for economic variables, including tourism statistics, do not provide support<br />
for <strong>the</strong> presence of induced tourism. The CoPS researchers <strong>the</strong>n conducted a simulation for a<br />
no-Sydney-Olympics counterfactual and estimated that <strong>the</strong> Olympics generated a real<br />
consumption loss for Australia of $2.1 billion. In view of this estimate CoPS concluded that<br />
<strong>the</strong> Sydney Olympics did not bring Australia an economic boost although <strong>the</strong>re may have<br />
been a substantial intangible benefit.<br />
CoPS’ mega-event studies have gained considerable attention. The Olympics study, for<br />
instance, has been reported in <strong>the</strong> UK in The Times, <strong>the</strong> China Daily News and Crain’s<br />
Chicago Business. An SBS Insight program on <strong>the</strong> Rugby World Cup included an interview<br />
with CoPS’ Deputy Director, Professor Madden. In 2005 Madden was engaged by <strong>the</strong> South<br />
African National Treasury to travel to Pretoria as an international expert advising on <strong>the</strong><br />
economic effects of <strong>the</strong> 2010 FIFA World Cup hosted by South Africa.<br />
Publications:<br />
Madden, J.R. (2002), “The economic consequences of <strong>the</strong> Sydney Olympics: The CREA/Arthur Andersen<br />
study”, Current Issues in Tourism, 5: 7-21.<br />
Madden, J.R. (2006), “Economic and Fiscal Impacts of Mega Sporting Events: A General Equilibrium<br />
Assessment”, Public Finance and Management, 6: 346-394.<br />
Giesecke, J.A. and Madden, J.R. (2011), “Modelling <strong>the</strong> economic impacts of <strong>the</strong> Sydney Olympics in<br />
retrospect – Game over for <strong>the</strong> bonanza story?”, Economic Papers, 30 (2):218-32.<br />
13
10. Water buybacks in <strong>the</strong> Murray-Darling Basin<br />
Clients: Murray-Darling Basin Authority<br />
Victoria’s Department of Primary Industries<br />
NSW Office of Water<br />
Researchers: Dr Glyn Wittwer, Prof. Peter Dixon<br />
and Prof. Maureen Rimmer<br />
Summary & impact:<br />
The Water Act 2007 included provision of $3.1<br />
billion for buying irrigation water entitlements from irrigators in order to increase environmental<br />
flows in <strong>the</strong> Murray-Darling Basin. CoPS has devised a regional model of <strong>the</strong> Australian economy,<br />
TERM-H2O, which includes water flows to agricultural activities and a very detailed treatment of<br />
Basin regions. Whereas lobbyists have asserted that buybacks will seriously damage regional<br />
economies in <strong>the</strong> Basin, TERM-H2O shows that at least some Basin regions will benefit and none will<br />
suffer a noticeable reduction in economic activity.<br />
Economic intuition tells us that in a buyback scheme in which water sales are voluntary, farmers<br />
should be no worse off. There are several complications in <strong>the</strong> story which are captured in TERM-<br />
H2O modelling. First, in <strong>the</strong> sou<strong>the</strong>rn Basin, water is tradable between regions. Therefore, net trade in<br />
water should be accounted for in <strong>the</strong> calculation of regional incomes. By entering <strong>the</strong> water market as<br />
a buyer, <strong>the</strong> Commonwealth pushes up <strong>the</strong> price of water. This means that Basin regions through<br />
existing water holders may benefit via increased spending power. Second, although buybacks push up<br />
<strong>the</strong> price of water, micro <strong>the</strong>ory predicts that if water scarcity increases (as it will with buybacks), <strong>the</strong><br />
values of fixed factors (land) and sluggishly adjusting factors (vineyards and orchards) will fall. Third,<br />
<strong>the</strong>re will be substantial movements in <strong>the</strong> Basin away from crops such as rice and towards relatively<br />
labour-intensive vegetable production, <strong>the</strong>reby diminishing job losses. In addition, some irrigable land<br />
will move from irrigation towards dry-land activities, so that increased dry-land output partly offsets<br />
decreases in irrigation output (Table 1).<br />
Table 1: Change in Murray-Darling Basin output due to buybacks relative to baseline, 2018<br />
Sector Value ($m)<br />
Rice -$70<br />
Vegetables +$24<br />
All irrigation output -$403<br />
All dry-land output +$231<br />
TERM-H2O has become <strong>the</strong> preferred tool of <strong>the</strong> Murray-Darling Basin Authority for analysis of <strong>the</strong><br />
economic impacts of <strong>the</strong> Basin plan, so much so that <strong>the</strong>y have asked if it possible to purchase <strong>the</strong><br />
model. This is a far cry from late 2010 when <strong>the</strong> <strong>the</strong>n chair of <strong>the</strong> MDBA distanced himself from<br />
modelling undertaken by o<strong>the</strong>rs, amid book-burnings in Griffith and general community unrest in <strong>the</strong><br />
Basin in response to <strong>the</strong> MDBA’s plan.<br />
Media interviews by Wittwer include an appearance on Radio National’s ‘Bush Telegraph’ in June<br />
2009, ABC Victoria’s ‘Country Hour’ and Riverland local ABC radio.<br />
Publications:<br />
Wittwer, G. (2012) (editor), Economic Modeling of Water: The Australian CGE Experience, Springer,<br />
Dordrecht, Ne<strong>the</strong>rlands (213 pages).<br />
Wittwer, G. and Dixon, P. (2011), “The economic impact of <strong>the</strong> buyback program”, in Langford, J.,<br />
Briscoe, J. and Taylor, N. (editors), The Australian Water Project – Crisis and opportunity: Lessons<br />
of Australian water reform. CEDA and Uniwater, Melbourne.<br />
Dixon, P., Rimmer, M. and Wittwer, G. (2011), “Saving <strong>the</strong> Sou<strong>the</strong>rn Murray-Darling Basin: <strong>the</strong><br />
Economic Effects of a Buyback of Irrigation Water”, Economic Record, 87(276): 153-168.<br />
14
11. Confusing policy and catastrophe: buybacks and drought in <strong>the</strong> Murray-Darling Basin<br />
Clients: Frontier Economics (for National Water Commission)<br />
Researchers: Dr Glyn Wittwer, Dr Marnie Griffith, Prof. Peter Dixon and Prof. Maureen Rimmer<br />
Summary & impact:<br />
Drought has a dramatic impact on output and<br />
employment in farm<br />
regions. Any policy<br />
introduced during drought<br />
may become <strong>the</strong> scapegoat<br />
for drought-induced<br />
hardship. This was <strong>the</strong> case<br />
with water buybacks that<br />
commenced in <strong>the</strong> Murray-<br />
Darling Basin towards <strong>the</strong><br />
end of a decade of<br />
recurrent droughts,<br />
culminating in record<br />
rainfall deficits between<br />
2006 and 2008 in <strong>the</strong> heart<br />
of <strong>the</strong> Basin’s Snowy<br />
Mountains catchment<br />
region (see map).<br />
We need to be able to<br />
separate <strong>the</strong> impacts of<br />
drought and policy, if <strong>the</strong> policy is not to be<br />
hijacked by poorly informed lobbyists. Table 1 is a<br />
starting point for comparing drought and buybacks.<br />
It indicates that <strong>the</strong> impact of buybacks is second<br />
order compared with that of drought. Modelling by<br />
CoPS was important in restoring reason to <strong>the</strong><br />
debate about buybacks, as rain returns to <strong>the</strong> Basin.<br />
Earlier, during <strong>the</strong> Murray-Darling Basin<br />
Authority’s road show in 2010, <strong>the</strong>re were book<br />
burnings and community unrest. Partly this<br />
reflected drought-induced stress and partly woeful<br />
communication by <strong>the</strong> Authority.<br />
Table 1: Estimates of direct impacts of drought<br />
and buybacks on MDB farming<br />
Drought Full buybacks<br />
2007-08<br />
Dry-land productivity -20% 0<br />
Available water: rainfall -37% 0<br />
: irrigation -37% -32%<br />
Farmer compensation No Yes<br />
Lobbyists have latched onto spurious multiplier<br />
analysis, but <strong>the</strong>y have been caught out. According<br />
to <strong>the</strong>m, ongoing buybacks will lead to ongoing job<br />
losses. Yet as buybacks continued, <strong>the</strong> Deniliquin<br />
rice mill reopened. Drought closed <strong>the</strong> mill and <strong>the</strong><br />
return of rain led to its reopening. All <strong>the</strong> while,<br />
buybacks were unimportant for jobs at <strong>the</strong> mill.<br />
15<br />
CoPS modelling showed that on average over <strong>the</strong><br />
last decade drought reduced employment in <strong>the</strong><br />
Murray-Darling Basin by about 6000 jobs. Even<br />
with <strong>the</strong> return of normal seasons in future years,<br />
employment will be 1500 jobs lower than it would<br />
have been without <strong>the</strong> drought years. This is<br />
because drought has reduced agricultural<br />
investment and left <strong>the</strong> Basin with less<br />
infrastructure to support employment. By contrast,<br />
<strong>the</strong> CoPS’ modelling predicted around 500 jobs<br />
being lost in <strong>the</strong> Basin in <strong>the</strong> long run as a result of<br />
fully implemented buybacks.<br />
Media coverage of CoPS’ study includes:<br />
Morris, S. (2010), ‘Jobs dried up in drought’, Financial<br />
Review, 30 November.<br />
http://afr.com/p/national/jobs_dried_up_in_drought_XE<br />
uCC3FtarzbzI0ccCW8ML<br />
Publications:<br />
Wittwer, G. (2011), “Confusing policy and catastrophe:<br />
buybacks and drought in <strong>the</strong> Murray-Darling Basin”,<br />
Economic Papers 30(3): 289-295.<br />
Wittwer, G. and Griffith, M. (2011), “Modelling<br />
drought and recovery in <strong>the</strong> sou<strong>the</strong>rn Murray-<br />
Darling basin”, Australian Journal of Agricultural<br />
and Resource Economics, 55(3): 342-359.
12. The economic impacts of new dams for urban water supply<br />
Clients: Queensland Water Infrastructure<br />
(QWI); Connell Wagner<br />
Researcher: Dr Glyn Wittwer<br />
Summary & impact:<br />
Queensland Water Infrastructure (QWI) was set<br />
up in 2007 to deal with a water crisis in South-<br />
East Queensland. CoPS was QWI’s first<br />
consultant. At <strong>the</strong> time, this corner of <strong>the</strong> state<br />
accounted for over 21% of national population<br />
growth, during a decade of recurrent droughts.<br />
Something had to be done. QWI’s plans included<br />
a recycling plant, pipelines across <strong>the</strong> corner of<br />
<strong>the</strong> state to create a water grid, two proposed<br />
dams, Wyaralong and Traveston, and a<br />
desalination plant.<br />
Major water supply projects in South-East<br />
Queensland, 2007 to 2012<br />
Project: Cost ($m) Average<br />
annual yield<br />
(GL)<br />
Western Corridor Water<br />
Recycling Project<br />
2,500 80<br />
Gold Coast desalination 1,200 45<br />
Wyaralong dam 350 21<br />
Hinze dam extension 395 6<br />
Bromelton off-stream<br />
storage<br />
40 5<br />
Traveston (cancelled) 1,600 70<br />
Pipelines 1,400<br />
CoPS was commissioned to model <strong>the</strong> economic<br />
impacts of <strong>the</strong> Traveston and Wyaralong dams<br />
separately. In <strong>the</strong> event of a continuation of<br />
relatively dry years, <strong>the</strong> welfare gains of each<br />
project would be substantial. But <strong>the</strong> marginal<br />
welfare impact of one dam would fall if <strong>the</strong> o<strong>the</strong>r<br />
dam were already in place. Modelling showed<br />
that with a return to years of more typical rainfall,<br />
<strong>the</strong> marginal benefits would decline. Wittwer<br />
(2009), written up after completion of <strong>the</strong> QWI<br />
consultancy, was scrutinised by QWI before<br />
submission. The article included a section on<br />
demand management, which is an important<br />
contribution of economists.<br />
The water supply projects overlapped to <strong>the</strong> point<br />
where some projects may have had zero marginal<br />
benefit. For example, were all <strong>the</strong> dams, and both<br />
recycling and desalination necessary? Any<br />
underutilisation through overlapping reduces net<br />
benefits.<br />
16<br />
When <strong>the</strong> citizens of Toowoomba in <strong>the</strong> grip of<br />
drought voted against <strong>the</strong> use of recycled water<br />
for <strong>the</strong>ir daily needs, <strong>the</strong> $2.5 billion water<br />
recycling plant was relegated to almost<br />
permanent underutilisation, supplying only coalfired<br />
power stations. Premier Bligh later<br />
announced that recycled water will enter<br />
Wivenhoe dam when its level drops below 40%<br />
capacity.<br />
At considerable expense, South-East Queensland<br />
urban water supply now appears to be droughtproof,<br />
despite Traveston dam being scrapped in<br />
November 2009. Amid <strong>the</strong> debate raging over<br />
dam releases on 12 January 2011, anyone who<br />
has studied historical rainfall data for <strong>the</strong> region<br />
would acknowledge that flood-proofing remains<br />
an impossible dream.<br />
CoPS was also called on to model <strong>the</strong> economic<br />
impacts of Tillegra dam in <strong>the</strong> Hunter Valley in<br />
early 2008. Again, <strong>the</strong> study noted that a return to<br />
a more typical rainfall pattern would diminish <strong>the</strong><br />
marginal welfare benefits of <strong>the</strong> project. About<br />
<strong>the</strong>n <strong>the</strong> rain returned to nor<strong>the</strong>rn New South<br />
Wales, diluting enthusiasm for <strong>the</strong> project, which<br />
was scrapped in November 2010.<br />
Publications: Wittwer, G. (2009), “The<br />
economic impacts of a new dam in South-East<br />
Queensland”, Australian Economic Review,<br />
42(1):12-23, March.<br />
Wittwer, G. (2012), “Urban Water Supply: A<br />
Case Study of South-East Queensland”,<br />
Chapter 8 in G. Wittwer (ed.), Economic<br />
Modeling of Water, The Australian CGE<br />
Experience, Springer, Dordrecht, Ne<strong>the</strong>rlands.
13. The economics of disease and pest control in Australian agriculture<br />
Client: Victoria’s Department of Primary<br />
Industries; Plant Health Australia.<br />
Researcher: Dr Glyn Wittwer<br />
Starting in 2003, CoPS has undertaken<br />
projects on <strong>the</strong> costs and benefits of<br />
disease/pest control policies in Australian<br />
agriculture. Early studies were on exotically<br />
named diseases such as Karnal bunt in wheat,<br />
banana moko, sugar cane smut and plum pox.<br />
Two recent studies concerned locusts and<br />
foot-and-mouth disease. A locust plague hit<br />
south-eastern Australia in <strong>the</strong> summer of<br />
2010-11. Uncontrolled, this would have<br />
caused $650m of direct crop losses. Taking<br />
account of indirect multiplier effects, CoPS<br />
modelling showed a total GDP loss of $1b.<br />
Controlling <strong>the</strong> locusts and <strong>the</strong>reby avoiding<br />
most of <strong>the</strong> direct crop losses costs less than<br />
$50m, but control programs have to be<br />
imposed by government. The CoPS study is<br />
strongly supportive of such action.<br />
Whereas direct damage from a locust plague<br />
accounts for most of <strong>the</strong> national economic<br />
damage, <strong>the</strong> story with a foot-and-mouth<br />
outbreak is different. Indirect losses dominate.<br />
CoPS’ considered a hypo<strong>the</strong>tical outbreak<br />
that caused direct losses of $90m in <strong>the</strong> cattle<br />
industry. In <strong>the</strong> absence of a reaction by our<br />
trade partners, multiplier effects might take<br />
<strong>the</strong> GDP loss up to $150m. However, even a<br />
limited outbreak of foot and mouth can lead<br />
to a quarantine ban on Australia’s beef<br />
exports. CoPS calculated <strong>the</strong> effects of a six<br />
month ban. This would leave a hole in<br />
Australia’s export base, weakening <strong>the</strong><br />
exchange rate and allowing exports of o<strong>the</strong>r<br />
products to rise. With additional volumes, <strong>the</strong><br />
prices of <strong>the</strong>se o<strong>the</strong>r exports on world<br />
markets would fall. Australia’s spending<br />
power would drop and cause a reduction in<br />
employment. The employment loss would<br />
cost Australia about $1b and <strong>the</strong> reduction in<br />
export prices would reduce spending power<br />
17<br />
by a fur<strong>the</strong>r $1.4b. In total <strong>the</strong> loss in real<br />
disposable income is $2.4b.<br />
CoPS also modelled a much worse foot-andmouth<br />
outbreak, one which includes cattle,<br />
pigs and poultry, with a direct loss of $690m.<br />
This time, with a 12 month quarantine ban,<br />
<strong>the</strong> loss of jobs and spending power causes a<br />
loss in real disposable income of about $6b.<br />
At <strong>the</strong> heart of <strong>the</strong>se hypo<strong>the</strong>tical scenarios is<br />
<strong>the</strong> justification for government spending,<br />
both on quarantine precautions and on<br />
combating outbreaks. In Australia’s case<br />
<strong>the</strong>re are substantial gains from maintaining<br />
vigilance at home.<br />
As in our foot-and-mouth example, a<br />
prevailing <strong>the</strong>me of disease and pest control<br />
studies is that <strong>the</strong> quarantine responses often<br />
account for most of <strong>the</strong> welfare losses arising<br />
from outbreaks. Because of <strong>the</strong> huge losses<br />
involved for exporting countries, <strong>the</strong><br />
imposition of quarantine bans is sometimes<br />
disputed in <strong>the</strong> WTO with exporting<br />
countries claiming that <strong>the</strong> bans are<br />
maintained for too long or applied too<br />
broadly.<br />
Often <strong>the</strong>re is a suspicion that bans go<br />
beyond quarantine concerns and are<br />
maintained as a form of industry protection.<br />
This is certainly a possible interpretation of<br />
Australia’s permanent ban on imported<br />
bananas. This ban is good for <strong>the</strong> Australian<br />
banana industry but it is bad for Australian<br />
consumers, dramatically so whenever a<br />
cyclone destroys much of <strong>the</strong> local crop. It is<br />
also bad for our trade partners.<br />
Publication:<br />
Wittwer, G., McKirdy, S. and Wilson, R. (2005),<br />
“The regional economic impacts of a plant<br />
disease incursion using a general equilibrium<br />
approach”, Australian Journal of Agricultural<br />
and Resource Economics 49(1): 75-89, March.
14. TERM, a CoPS innovation: small-region dynamic modelling<br />
Researchers: Dr Glyn Wittwer, Professor Mark Horridge and Dr Marnie Griffith<br />
Clients: Various including those listed below between 2008 and 2012.<br />
Summary & impact: Consultants often use<br />
input-output (IO) models to analyse <strong>the</strong> impacts of<br />
projects on small regions. These models do not<br />
include resource constraints. Thus <strong>the</strong>y assume<br />
that regional economies can expand without local<br />
cost increases. This would be defensible if all<br />
factors were available to a region in perfectly<br />
elastic supply. However, even for small regions<br />
which can draw in resources from o<strong>the</strong>r regions,<br />
<strong>the</strong> elastic-supply assumption may come unstuck<br />
quickly. For example, <strong>the</strong> mining boom since 2005<br />
has led to soaring house prices in remote parts of<br />
Western Australia. A CGE model with<br />
comprehensive resource constraints improves <strong>the</strong><br />
realism and usefulness of regional analyses – it<br />
shows <strong>the</strong> impact of booms on local prices.<br />
Port Hedland house for $970,000 in April 2008<br />
TERM (The Enormous Regional Model) is a<br />
multi-regional CGE model built at CoPS. Its<br />
master database includes 206 regions aligning<br />
with statistical sub-divisions. TERM requires<br />
census data, state accounts, national accounts,<br />
small-region agriculture data, mining data and data<br />
on international trade by port. In application, <strong>the</strong><br />
database and dynamic baseline of TERM are<br />
aggregated in order to represent regions and<br />
sectors of interest. Examples of applications since<br />
2008, in addition to <strong>the</strong> mining example above,<br />
include:<br />
• productivity studies in agriculture (for<br />
Victoria’s Dept of Primary Industries,<br />
2011-12);<br />
• <strong>the</strong> economic impacts of a hypo<strong>the</strong>tical<br />
Perth airport curfew(for SKM, 2010);<br />
• NSW fire brigade impacts on regional<br />
economies (for Deloitte Touch Tohmatsu,<br />
2010);<br />
18<br />
• tourism in Far North Queensland (for<br />
Marsden Jacob, 2009);<br />
• upgrades to Webb Dock in Melbourne (for<br />
GHD Meyrick, 2009);<br />
• expansion of glass manufacturing in<br />
Adelaide (for Price Waterhouse Coopers,<br />
2008);<br />
• pulp and paper scenarios in rural Victoria<br />
(for Price Waterhouse Coopers, 2008);<br />
• various infrastructure scenarios in rural<br />
Victoria (for Price Waterhouse Coopers,<br />
2008).<br />
Dynamic TERM includes a fiscal module which<br />
was used in modelling gambling tax scenarios for<br />
Price Waterhouse Coopers (2009). An important<br />
message was that given <strong>the</strong> narrow tax base of <strong>the</strong><br />
states, it will not be easy to replace state<br />
government revenues from gambling taxes if <strong>the</strong>re<br />
are substantial reforms to gambling legislation.<br />
In summary, dynamic TERM is a versatile<br />
analytical tool that can be applied to any number<br />
of small-region studies. It has largely superseded<br />
small-region IO models.<br />
Publication:<br />
Wittwer, G. and Horridge, M. (2010), “Bringing<br />
Regional Detail to a CGE Model using Census<br />
Data”, Spatial Economic Analysis, 5(2):229-<br />
255.
15. Labour market forecasting and workforce development<br />
Clients: Commonwealth and State Government Departments responsible for employment,<br />
education and training.<br />
Researchers: Dr Tony Meagher and Ms Felicity Pang<br />
Summary & impact: In her address to<br />
<strong>the</strong> Committee for <strong>the</strong> Economic<br />
Development of Australia on February 1,<br />
2011, <strong>the</strong> Prime Minister Julia Gillard<br />
offered <strong>the</strong> following view about <strong>the</strong> state<br />
of <strong>the</strong> Australian labour market:<br />
“After three decades when unemployment<br />
was our major problem, we now face<br />
shortages of labour – a problem<br />
unmatched anywhere in <strong>the</strong> industrialised<br />
world. In <strong>the</strong> short term, <strong>the</strong> mining<br />
boom is placing huge strains on our<br />
labour market, compounded by <strong>the</strong><br />
demands of flood recovery. But <strong>the</strong><br />
ageing of <strong>the</strong> population will create even<br />
greater pressure over <strong>the</strong> next 40 years<br />
because it will create a yawning demographic<br />
deficit. It is vital that we unlock all <strong>the</strong> potential of<br />
our labour market.”<br />
The <strong>Monash</strong> labour market forecasts, which have<br />
been produced by CoPS on a regular basis for<br />
more than fifteen years, take all <strong>the</strong>se factors into<br />
account. However, it is in <strong>the</strong>ir application to<br />
education and training that <strong>the</strong> forecasts have<br />
proved particularly useful. Perhaps more than any<br />
o<strong>the</strong>r factor, education and training is <strong>the</strong> key to<br />
“unlocking <strong>the</strong> potential of <strong>the</strong> labour market”.<br />
At <strong>the</strong> core of <strong>the</strong> <strong>Monash</strong> forecasting system is<br />
<strong>the</strong> MONASH computable general equilibrium<br />
model of <strong>the</strong> Australian economy. The adaptation<br />
of a modern, sophisticated CGE model to labour<br />
market forecasting has earned <strong>the</strong> <strong>Monash</strong><br />
forecasts an international reputation for modelling<br />
excellence in <strong>the</strong> field. However, <strong>the</strong> usefulness<br />
of <strong>the</strong> forecasts to policy makers in <strong>the</strong> education<br />
and training bureaucracy stems not only from <strong>the</strong><br />
quality of <strong>the</strong> CGE methodology but also from <strong>the</strong><br />
large amount of detail embodied in various labour<br />
market extensions and from <strong>the</strong> user-friendly<br />
software developed to manage that detail. The<br />
forecasts go out eight years and cover 158<br />
industries, 358 occupations, 7 qualification levels,<br />
71 qualification fields, 24 demographic groups and<br />
58 regions. Moreover <strong>the</strong>y are coherent in that<br />
<strong>the</strong>y are consistent with one ano<strong>the</strong>r and aggregate<br />
into an identifiable, defensible view about <strong>the</strong><br />
future development of <strong>the</strong> economy.<br />
The extent to which a system for delivering policy<br />
advice can have an impact on decision making in<br />
government agencies depends not only on <strong>the</strong><br />
19<br />
quality of <strong>the</strong> system but also on <strong>the</strong> political<br />
context in which decisions are made. For a period<br />
in 2008-2009, it was politically untenable for<br />
subscribers to use <strong>the</strong> <strong>Monash</strong> forecasts until <strong>the</strong>y<br />
had been revised to account for <strong>the</strong> effects of <strong>the</strong><br />
GFC.<br />
In response to this problem with subscribers,<br />
CoPS has designed and implemented a system for<br />
updating <strong>the</strong> labour market forecasts on a quarterly<br />
basis between major forecasting rounds. In this<br />
way, dramatic developments can be incorporated<br />
into <strong>the</strong> forecasts at short notice.<br />
The <strong>Monash</strong> forecasting system is distinguished<br />
by its reliance on published data sources and<br />
modern CGE modelling techniques. In o<strong>the</strong>r<br />
countries, training agencies do not generally have<br />
access to equivalent modelling expertise, and rely<br />
instead on bureaucratic systems for collecting and<br />
collating informed opinion. Such systems are<br />
inherently cumbersome and are not as well suited<br />
as <strong>the</strong> <strong>Monash</strong> system for adapting quickly to<br />
changing circumstances. In <strong>the</strong> United States, for<br />
example, <strong>the</strong> Bureau of Labor Statistics commands<br />
a very large budget for labour market forecasting,<br />
but manages to produce a new forecast only every<br />
two years.<br />
Related Research Paper:<br />
G.A.Meagher and Felicity Pang, “Assessing <strong>the</strong><br />
Reliability of Labour Market Forecasts”, paper<br />
presented to <strong>the</strong> International Symposium on<br />
Employment and Skills Forecasting, <strong>University</strong> of<br />
Warwick, September, 2011.
16. Labour market forecasting and <strong>the</strong> two-speed economy<br />
Clients: Various Commonwealth and State Government Departments responsible for<br />
employment, education and training.<br />
Researchers: Dr Tony Meagher, Ms Felicity Pang and Professor Mark Horridge<br />
Summary & impact: Australia is currently<br />
experiencing a once-in-a-century terms-oftrade<br />
and investment boom and an associated<br />
high exchange rate. These developments have<br />
resulted in significant structural change in <strong>the</strong><br />
economy and prompted <strong>the</strong> following<br />
judgement by Tim Colebatch, economics<br />
editor of <strong>the</strong> Age (6 March, 2012):<br />
“Australia has fractured into two<br />
economies. The (recent) growth is<br />
overwhelmingly in minerals development,<br />
in Western Australia, Queensland and <strong>the</strong><br />
Nor<strong>the</strong>rn Territory. The south-eastern<br />
states - Victoria, New South Wales, South<br />
Australia, Tasmania and <strong>the</strong> ACT – are<br />
now going backwards on some indicators,<br />
growing slowly on o<strong>the</strong>rs. Australia has<br />
been a two-speed economy since 2005,<br />
but now <strong>the</strong> two speeds are 100km/h on<br />
one side of <strong>the</strong> country and 10km/h on <strong>the</strong><br />
o<strong>the</strong>r”.<br />
This kind of idea poses considerable<br />
difficulties for State government bureaucrats<br />
whose job it is to manage <strong>the</strong> allocation of<br />
training resources. In particular, <strong>the</strong>y must<br />
decide <strong>the</strong> extent to which assessments like<br />
Colebatch’s apply to <strong>the</strong> labour market for<br />
which <strong>the</strong>y are responsible. The <strong>Monash</strong><br />
labour market forecasts provide <strong>the</strong>m with<br />
some important guidance in this respect.<br />
Software supplied with <strong>the</strong> forecasts allows <strong>the</strong><br />
policy makers to identify which industries (or<br />
occupations or skill groups) make <strong>the</strong> most<br />
important contributions to differences in<br />
employment growth between <strong>the</strong> States. For<br />
example, in <strong>the</strong> most recent forecasts,<br />
employment in Western Australia is projected<br />
to grow by 14.98 per cent during <strong>the</strong> period<br />
2010-11 to 2018-19. This is 3.67 percentage<br />
points more than <strong>the</strong> Australian economy as a<br />
whole. Of this, 1.46 percentage points (or<br />
about 40 per cent of <strong>the</strong> difference) are<br />
accounted for by <strong>the</strong> relatively large share of<br />
<strong>the</strong> Western Australian workforce employed in<br />
<strong>the</strong> rapidly-growing mining industry.<br />
However, 0.62 percentage points (or about 17<br />
20<br />
per cent of <strong>the</strong> difference) are accounted for by<br />
<strong>the</strong> manufacturing industry even though<br />
employment in that industry is projected to<br />
contract in Western Australia. In explaining<br />
<strong>the</strong> difference between aggregate growth rates,<br />
what matters is that manufacturing<br />
employment is projected to contract more<br />
slowly in Western Australia than it is in<br />
Australia as a whole.<br />
Note that employment growth projected for<br />
Western Australia, Queensland and <strong>the</strong><br />
Nor<strong>the</strong>rn Territory taken toge<strong>the</strong>r is 18.84 per<br />
cent, as compared to 7.74 per cent for <strong>the</strong> rest<br />
of Australia. While <strong>the</strong> difference is<br />
considerable, it is well short of <strong>the</strong> factor of<br />
ten envisioned by Colebatch. This reflects <strong>the</strong><br />
fact that <strong>the</strong> vast bulk of Australians work in<br />
<strong>the</strong> services sector where <strong>the</strong> effects of <strong>the</strong><br />
boom are relatively muted.<br />
Policy makers are continually confronted with<br />
<strong>the</strong> need to translate broad qualitative ideas<br />
like <strong>the</strong> “two-speed economy” into<br />
quantitative assessments of <strong>the</strong> future<br />
requirements of industry for skilled labour.<br />
The <strong>Monash</strong> forecasts facilitate this decision<br />
making by bringing sophisticated economic<br />
modelling techniques and up-to-date data to<br />
bear on <strong>the</strong> forecasting task. The impact of <strong>the</strong><br />
forecasts in this regard is considerably<br />
enhanced by <strong>the</strong> suite of user-friendly software<br />
which accompanies <strong>the</strong> forecasts.<br />
17. Labour Market Forecasting and <strong>the</strong> <strong>Monash</strong>-Warwick Alliance
Clients: The European Centre for <strong>the</strong> Development of Vocational Training (CEDEFOP)<br />
Researchers: Dr Tony Meagher, Ms Felicity Pang and Professor Rob Wilson (IER, Warwick)<br />
Summary & impact: The European Centre for <strong>the</strong> Development of Vocational Training (CEDEFOP)<br />
was established by <strong>the</strong> European Union in 1975 to support <strong>the</strong> development of European vocationaleducation<br />
and training policies and to contribute to <strong>the</strong>ir implementation. Since 1995, it has been<br />
based in Thessaloniki, Greece. In 2008, CEDEFOP initiated a project on Forecasting skill supply and<br />
demand in Europe, <strong>the</strong> overall aim of which is to develop a system for producing regular, detailed and<br />
consistent projections of future skill demand and supply across <strong>the</strong> whole of Europe. A tender to<br />
produce <strong>the</strong> forecasts for <strong>the</strong> first four years of <strong>the</strong> project was won by an international team led by <strong>the</strong><br />
Institute of Employment Research (IER) at <strong>the</strong> <strong>University</strong> of Warwick. At that time <strong>the</strong> IER, toge<strong>the</strong>r<br />
with collaborators at Cambridge Econometrics, had already been producing labour market forecasts<br />
for <strong>the</strong> United Kingdom government for many years.<br />
At <strong>the</strong> core of <strong>the</strong> Warwick forecasting system is <strong>the</strong> E3ME model, a time-series econometric multisector<br />
(EMS) model that represents <strong>the</strong> current embodiment of a continuous line of research on<br />
economic modelling that originated with <strong>the</strong> legendary R. A. Stone in <strong>the</strong> 1950s. It is operated by<br />
Cambridge Econometrics and produces, inter alia, an integrated set of employment forecasts for 41<br />
industries in 27 European countries. Its particular focus is on <strong>the</strong> long-term implications of policies<br />
related to energy, <strong>the</strong> environment and <strong>the</strong> economy (hence <strong>the</strong> E3 in its name). In <strong>the</strong> Warwick<br />
system, <strong>the</strong> E3ME model is supplemented by a labour market extension (<strong>the</strong> WLME) which elicits <strong>the</strong><br />
implications of <strong>the</strong> industry forecasts for 28 occupations and 3 skill groups.<br />
In 2010, CoPS was approached by <strong>the</strong> IER to explore <strong>the</strong> possibility of producing a hybrid EMS-CGE<br />
model for <strong>the</strong> CEDEFOP forecasting project. In particular, it was proposed that an alternative to <strong>the</strong><br />
WLME be developed which describes <strong>the</strong> operation of markets for occupations and/or skill groups in<br />
<strong>the</strong> CGE tradition. Compared to <strong>the</strong><br />
WLME, <strong>the</strong> <strong>Monash</strong> labour market<br />
extension (MLME) relies less on time<br />
series extrapolation and more on<br />
explicitly modelled economic behaviour.<br />
The <strong>Monash</strong> approach introduces a<br />
range of behavioural and technical<br />
parameters which offer more scope than<br />
<strong>the</strong> Warwick approach for modelling<br />
developments in <strong>the</strong> labour market<br />
which impact on occupations and skills<br />
ra<strong>the</strong>r industries. CoPS’ exploratory work on using MLME as an alternative to WMLE was supported<br />
in 2011 by a grant from <strong>the</strong> <strong>Monash</strong>-Warwick Strategic Funding Initiative for Joint Research, an<br />
initiative that has culminated in <strong>the</strong> formation of a new global alliance between <strong>the</strong> two universities,<br />
as announced in February 2012 by Vice-Chancellors Ed Bryne (<strong>Monash</strong>) and Nigel Thrift (Warwick),<br />
pictured above.<br />
An interface between E3ME and <strong>the</strong> MLME has now been successfully implemented for <strong>the</strong> United<br />
Kingdom, <strong>the</strong> Ne<strong>the</strong>rlands and Greece. It is expected that forecasts for <strong>the</strong> remaining 23 countries<br />
will be completed during 2012, and that a comparison between <strong>the</strong> merits of <strong>the</strong> E3ME-WLME and<br />
E3ME-MLME systems will contribute to <strong>the</strong> outcomes of <strong>the</strong> current CEDEFOP four-year program.<br />
It is also expected that <strong>the</strong> research will provide <strong>the</strong> basis for a joint Warwick-<strong>Monash</strong> forecasting<br />
proposal for <strong>the</strong> next CEDEFOP funding round.<br />
Related Research Paper:<br />
G.A.Meagher, Felicity Pang and R.A.Wilson, “Interfacing a CGE Labour Market Model with <strong>the</strong> E3ME Multisector<br />
Macroeconomic Model”, (in preparation).<br />
21
18. Population ageing and structural adjustment<br />
Clients: Commonwealth Department of Innovation, Industry, Science and Research.<br />
Researchers: Dr James Giesecke and Dr Tony Meagher<br />
Summary & impact:<br />
The future effects of population ageing on <strong>the</strong> Australian economy have been widely canvassed in<br />
recent years, most notably in <strong>the</strong> three Intergenerational Reports produced by <strong>the</strong> Australian Treasury<br />
and in <strong>the</strong> Economic Implications of an Ageing Australia produced by <strong>the</strong> Productivity Commission.<br />
These reports are concerned mainly with <strong>the</strong> effect of ageing on <strong>the</strong> government’s budgetary position.<br />
On <strong>the</strong> income side, <strong>the</strong>y focus on how ageing affects labour supply and gross domestic product. On<br />
<strong>the</strong> expenditure side, <strong>the</strong>y focus on how ageing affects various spending categories including<br />
education, health and aged care.<br />
In 2008, <strong>the</strong> Centre of Policy Studies undertook a study designed to reveal <strong>the</strong> structural pressures<br />
implicit in <strong>the</strong> fiscal gap analyses of <strong>the</strong> Treasury and <strong>the</strong> Productivity Commission. The study<br />
considered <strong>the</strong> effects of population ageing on 67 skill groups, 81 occupations and 106 industries over<br />
<strong>the</strong> period 2004-05 to 2024-25. The simulations were conducted using <strong>the</strong> MONASH applied general<br />
equilibrium model of <strong>the</strong> Australian economy and compared two economies: a basecase in which<br />
population ageing takes place, and an alternative (counterfactual) economy in which <strong>the</strong> age structure<br />
of <strong>the</strong> population – insofar as it affects workforce participation rates, hours worked per week and<br />
consumer demand patterns - remains unchanged.<br />
The CoPS simulations brought out <strong>the</strong> implicit labour-market assumptions underlying <strong>the</strong> Treasury’s<br />
fiscal gap projections. They showed that for <strong>the</strong>se<br />
projections to be realized, <strong>the</strong>re would need to be<br />
considerable shifts in <strong>the</strong> occupational mix of<br />
employment. An obvious example is a shift from<br />
education towards health. Such shifts will<br />
require changes in <strong>the</strong> allocation of government<br />
training expenditures if <strong>the</strong>y are to be achieved<br />
smoothly without sharp changes in relative wage<br />
rates.<br />
While <strong>the</strong> importance of population ageing for<br />
employment related to education and health has<br />
been widely anticipated in o<strong>the</strong>r studies, some of<br />
<strong>the</strong> o<strong>the</strong>r structural results from <strong>the</strong> CoPS modelling are quite significant for aspects of <strong>the</strong> ongoing<br />
policy debate. For example, our results show that population ageing tends to create shortages of<br />
qualified tradesmen. However, <strong>the</strong> effects of population ageing will vary considerably within <strong>the</strong><br />
category tradesperson The induced pressure on <strong>the</strong> employment of Structural construction<br />
tradespersons, Final finish construction tradespersons and Plumbers is strongly towards excess<br />
demand, whereas that on Mechanical engineering tradespersons, Fabrication engineering<br />
tradespersons and Automotive tradespersons is strongly towards excess supply. Evidently, labour<br />
market policies predicated on ideas formed at high levels of aggregation are unlikely to apply<br />
satisfactorily at lower levels of aggregation.<br />
Even more interesting is <strong>the</strong> tendency of population ageing to create excess demand for persons with<br />
No post-school qualification. This result sits uneasily with <strong>the</strong> almost universal policy emphasis on<br />
<strong>the</strong> need for a more highly skilled workforce.<br />
Publication:<br />
James Giesecke and G.A.Meagher (2008), “Population Ageing and Structural Adjustment”, Australian Journal<br />
of Labour Economics, 11 (3), 227-248.<br />
19. Climate change mitigation, green jobs and training needs<br />
22
Clients: Commonwealth Department of Innovation, Industry, Science and Research.<br />
Researchers: Dr Tony Meagher and Ms Felicity Pang<br />
Summary & impact: In October 2008, <strong>the</strong> Australian Treasury released a report on Australia's Low<br />
Pollution Future: The Economics of Climate Change Mitigation. As described in <strong>the</strong> first vignette,<br />
CoPS was <strong>the</strong> major contributor to <strong>the</strong> modelling underlying this report. The stature of <strong>the</strong> report can<br />
be gauged from an assessment by Dr<br />
Martin Parkinson, <strong>the</strong>n <strong>the</strong> head of <strong>the</strong><br />
Department of Climate Change but<br />
now <strong>the</strong> head of <strong>the</strong> Treasury. He<br />
declared that <strong>the</strong> report was “<strong>the</strong> most<br />
thorough, comprehensive and well<br />
documented modelling exercise ever<br />
conducted in Australia”. In <strong>the</strong> report,<br />
various scenarios were used to explore<br />
<strong>the</strong> potential economic effects of<br />
climate mitigation policy in Australia.<br />
While <strong>the</strong> projections were<br />
constrained by <strong>the</strong> availability of<br />
labour in <strong>the</strong> aggregate, <strong>the</strong>y did not<br />
consider <strong>the</strong> possibility of skill<br />
bottlenecks.<br />
In 2010, CoPS produced a supplementary report which used a CGE labour market extension to<br />
investigate more thoroughly <strong>the</strong> labour market implications of <strong>the</strong> Treasury report. The extension<br />
described <strong>the</strong> operation of 81 labour markets differentiated by occupation and imposed labour supply<br />
constraints for 67 skill groups differentiated by qualification. The main results were as follows:<br />
• The effect of climate change mitigation on <strong>the</strong> occupational mix of employment will be small<br />
compared with changes arising from technology and o<strong>the</strong>r structural pressures.<br />
• The transition to a more sustainable economy will not create a rash of jobs requiring special<br />
environment-related skills (green jobs). Hence concerns about <strong>the</strong> capacity of <strong>the</strong> education and<br />
training system to cope with <strong>the</strong> anticipated extra demand for green jobs are misplaced.<br />
• When <strong>the</strong> emissions reduction target was made more stringent, <strong>the</strong> occupations which benefited<br />
most were those connected with Forestry. This industry is distinguished in that it is <strong>the</strong> only one<br />
for which emissions decline as its output increases.<br />
• When a renewable energy target (RET) was introduced, employment tended to shift against<br />
occupations employed in <strong>the</strong> Electricity industry or in industries that are large users of electricity.<br />
• The employment effects of carbon pollution mitigation have much more to do with <strong>the</strong><br />
distribution of jobs between industries, occupations, skill groups and regions than with <strong>the</strong><br />
aggregate number of jobs. However, in <strong>the</strong> analysis, <strong>the</strong> number of jobs created and destroyed<br />
due to climate change mitigation was much less than <strong>the</strong> number <strong>the</strong> economy has to cope with on<br />
a routine basis.<br />
The result suggests that policies that rely on attributing <strong>the</strong> characteristic “green” to particular jobs are<br />
unlikely to produce <strong>the</strong> intended results; “greenness” is policy specific.<br />
Related Report:<br />
G.A.Meagher and Felicity Pang, “Future Skill Needs of <strong>the</strong> Transition to a Low Emission Economy”, Report to<br />
<strong>the</strong> Department of Innovation, Industry, Science and Research, March 2010 (240 pp.)<br />
23
20. Australia’s 2005 national wage case and o<strong>the</strong>r industrial relations issues<br />
Clients: Department of Employment & Workplace Relations and <strong>the</strong> Allen Consulting Group<br />
Researcher: Professor Peter Dixon, Professor John Madden and Professor Maureen Rimmer<br />
Summary & impact:<br />
Each year Australia has a national wage case which sets award wage rates for about 20 per cent of<br />
Australian workers spread across a wide range of occupations and industries. As had been <strong>the</strong> practice<br />
for many years, <strong>the</strong> 2005 national award wage case, known <strong>the</strong>n as <strong>the</strong> Safety Net Review (SNR), was<br />
conducted in a legalistic process by <strong>the</strong> Australian Industrial Relations Commission (AIRC). The<br />
Commonwealth of Australia commissioned CoPS to analyse <strong>the</strong> effects of granting <strong>the</strong> Australian<br />
Council of Trade Union’s (ACTU) request for a flat increase of $26.60 a week for all award workers<br />
covered by <strong>the</strong> SNR. The<br />
Government wanted to know both<br />
<strong>the</strong> short- and long-run<br />
macroeconomic effects at <strong>the</strong><br />
national level. They also asked<br />
CoPS to identify potential<br />
adjustment (or short-run) problems<br />
at <strong>the</strong> state level.<br />
The wage increase requested by <strong>the</strong><br />
ACTU translated into an average<br />
real wage increase for award<br />
workers of 4.2%. CoPS’ modelling<br />
showed that this would cause a flowon<br />
increase of 0.85% in non-award<br />
wages. Across all workers <strong>the</strong><br />
average real wage increase would be 1.22%. In <strong>the</strong> short run, we calculated that this would reduce<br />
employment by 78,000 jobs. The CoPS’ report showed that jobs would be lost in all regions and all<br />
industries, not just those with a heavy concentration of award workers.<br />
CoPS was asked to assist <strong>the</strong> Commonwealth at <strong>the</strong> AIRC hearings. Professor Madden appeared<br />
before <strong>the</strong> AIRC full bench as <strong>the</strong> Commonwealth’s expert witness. At <strong>the</strong> hearing, <strong>the</strong> ACTU<br />
advanced <strong>the</strong> well-known Card/Kruger study of minimum-wage workers in <strong>the</strong> New Jersey fast food<br />
industry in support of its claim that its requested wage increase would have no effect on jobs. CoPS’<br />
study was consistent with Card/Kruger as our simulations showed little effect on employment in<br />
service industries (like fast food) that face inelastic demand. However, CoPS was able to capture <strong>the</strong><br />
general equilibrium effects of cost increases flowing on to industries with highly elastic demand.<br />
CoPS’ modelling for <strong>the</strong> wage-case study involved a methodological advance in regional modelling.<br />
Two CoPS models, MONASH and MMRF were linked. MONASH is a national model which<br />
separately identifies labour demand and supply using a form of search <strong>the</strong>ory, and distinguishes<br />
between award and non-award wage rates. MMRF is a detailed multi-state model, but has a crude<br />
labour-market specification. Linking <strong>the</strong> two models allowed CoPS to exploit <strong>the</strong> strengths of <strong>the</strong> two<br />
models. The linking methodology was published in 2010 in Regional Studies, (A* in ERA rankings).<br />
After <strong>the</strong> 2005 case, CoPS used its linked system to provide similar analysis to Fair Work Australia<br />
which replaced <strong>the</strong> AIRC in 2006. We also worked with <strong>the</strong> Allen Consulting Group on a study of<br />
<strong>the</strong> Howard government’s set of reforms that became known as Work Choices. Unfortunately, <strong>the</strong><br />
Department of Employment and Workplace Relations supressed our report, but that’s ano<strong>the</strong>r story.<br />
Publications:<br />
Dixon, P.B., Madden, J.R. and Rimmer, M.T. (2010), “Linking national and multi-regional models: <strong>the</strong> effects<br />
of an increase in award wage rates in Australia”, Regional Studies, 44:1369-85.<br />
21. China-Australia Governance Program<br />
24
Client: State Information Centre of NDRC, Beijing<br />
Researchers: Dr Yinhua Mai, Dr Xiujian Peng, Prof. Philip Adams, Prof. Peter Dixon, Prof. Mark<br />
Horridge, Dr Michael Jerie, Mr Mark Picton, Prof. Maureen Rimmer, Dr Glyn Wittwer<br />
Summary & Impact: The State Information Centre (SIC) in China is a central government agency<br />
under <strong>the</strong> supervision of <strong>the</strong> National Development and Reform Commission (NDRC). As an<br />
important economic forecasting think tank, it provides policy-oriented quantitative services and<br />
advice to senior policy-makers in <strong>the</strong> State Council, NDRC, and o<strong>the</strong>r macro-economic departments<br />
of <strong>the</strong> central government. In 2007, under <strong>the</strong> AusAID-funded China-Australia Governance Program,<br />
SIC commissioned CoPS to provide CGE modelling training for its staff and to build a dynamic CGE<br />
model. From 2007 to 2010, we: conducted three intensive CGE model training courses; provided a<br />
series of consultancies for SIC staff in Melbourne and Beijing; and built a dynamic CGE model of <strong>the</strong><br />
Chinese economy, <strong>the</strong> SICGE model. SICGE has been used by SIC staff to analyse: rural-urban<br />
labour mobility, household income inequality and social security issues; <strong>the</strong> impact of liberalisation of<br />
state petroleum prices; China’s GFC stimulus package involving subsidies on purchases of household<br />
appliances and cars; and transportation development and related energy demand. The governance<br />
program culminated in an international conference held in Beijing in April 2010. The papers are<br />
available in <strong>the</strong> proceedings cited below.<br />
An interesting SICGE application by CoPS has been to estimate <strong>the</strong> size of rural surplus labour, that is<br />
<strong>the</strong> number of rural workers with close to zero marginal productivity. Whe<strong>the</strong>r China still has a pool<br />
of rural surplus labour is hotly debated in China. Many scholars argue that <strong>the</strong> persistent shortage of<br />
rural-migrant labour in manufacturing sectors in urban east-coast areas in recent years signals <strong>the</strong><br />
drying up of <strong>the</strong> pool of rural surplus labour. They worry that <strong>the</strong> running down of <strong>the</strong> rural labour<br />
surplus could drive up labour costs and jeopardise China’s competitive advantage in international<br />
markets and also reduce foreign direct investment in China.<br />
Using SICGE, we conducted an historical simulation which showed that <strong>the</strong> size of <strong>the</strong> rural labour<br />
surplus declined from 120 million in 1997 to 59 million in 2005 because of strong demand for rural<br />
labour in rural non-agricultural activities and<br />
in urban sectors. If <strong>the</strong> growth patterns of<br />
agricultural output and labour productivity<br />
continue, <strong>the</strong>n <strong>the</strong> rural labour surplus will<br />
continue to shrink significantly, leaving only<br />
25.6 million rural surplus labourers by <strong>the</strong><br />
end of 2015. However, if <strong>the</strong> government<br />
investments more heavily in agricultural<br />
infrastructure and <strong>the</strong>reby increases growth<br />
in Rural migrant labourers in urban<br />
manufacturing<br />
agricultural labour productivity, <strong>the</strong>n rural<br />
surplus labour will not decline quite so<br />
quickly (less rural jobs) making more rural<br />
labour available for transfer into non-agricultural activities. Meanwhile, acceleration of agricultural<br />
labour productivity will reduce food prices. put downward pressure on <strong>the</strong> consumer price index and<br />
stimulate real household consumption.<br />
Publications:<br />
Mai, Y. and X. Peng (2012), “Estimating <strong>the</strong> size of rural labour surplus in China -A dynamic general<br />
equilibrium analysis”, The Chinese Economy, 2012, forthcoming.<br />
State Information Centre and China-Australia Governance Program (2010), International Conference on <strong>the</strong><br />
SIC-GE Model and Policy Simulations, Proceedings of a conference held on 15-16 April 2010 at <strong>the</strong> Beijing<br />
GuoHong Hotel.<br />
25
22. Building CGE modelling capacity for China<br />
Client: Hunan <strong>University</strong> (Changsha, China)<br />
Researchers: Dr Yinhua Mai, Dr Xiujian Peng, Prof. Peter Dixon, Prof. Mark Horridge, Prof.<br />
Maureen Rimmer, Dr Glyn Wittwer<br />
Summary & Impact:<br />
Hunan <strong>University</strong>, which dates back to <strong>the</strong> Yuelu<br />
Academy founded in 976 A.D., is located in <strong>the</strong><br />
historically and culturally renowned city of Changsha,<br />
capital of Hunan Province. In 2006 Hunan <strong>University</strong><br />
commissioned CoPS to conduct a capacity building<br />
project in computable general equilibrium (CGE)<br />
modelling for China.<br />
Between 2006 and 2008 we: ran two training courses;<br />
built <strong>the</strong> <strong>Monash</strong>-China-Hunan-<strong>University</strong> GE model<br />
(McHuge) of <strong>the</strong> Chinese economy; and assisted in <strong>the</strong><br />
supervision of five Hunan PhD students. Subsequently,<br />
through AusAid, we were commissioned by <strong>the</strong> State<br />
Information Centre (SIC) in Beijing to fur<strong>the</strong>r develop<br />
and apply McHuge (next vignette). Among o<strong>the</strong>r things,<br />
our colleagues in Hunan have used McHuge:<br />
to analyse <strong>the</strong> development of China’s textile industry<br />
under <strong>the</strong> pressure of reduced international demand,<br />
rising input costs and appreciation of <strong>the</strong> RMB;<br />
Yuelu Academy at Hunan <strong>University</strong><br />
to project <strong>the</strong> demand for energy by energy-intensive industries under different assumptions about<br />
energy efficiency;<br />
to estimate <strong>the</strong> economic impacts of sharp rises in <strong>the</strong> prices of commodities such as oil and iron<br />
ore;<br />
to work out whe<strong>the</strong>r a fuel tax should be levied at <strong>the</strong> retail, wholesale or production stage; and<br />
to assess <strong>the</strong> effects of population aging and labour market reform.<br />
In our own research we have applied McHuge in an analysis of <strong>the</strong> economic impact of reform in<br />
China’s household registration (hukou) system. The hukou system inhibits permanent migration of <strong>the</strong><br />
rural labour force to urban areas. As a result, underemployment or disguised unemployment remains<br />
widespread in rural areas and agricultural wages are much lower than non-agricultural wages.<br />
Our McHuge simulations showed that a dismantling of restrictions that encouraged an extra 6.3<br />
million workers (= 1.7 per cent of <strong>the</strong> rural labour force) to move out of rural employment and into<br />
urban employment would, by 2019:<br />
• increase China’s GDP by 0.36 per cent;<br />
• increase consumption (combined public and private) by 0.31 per cent; and<br />
• increase <strong>the</strong> real wages of rural workers, China’s lowest paid workers, by about 5 per cent<br />
while reducing <strong>the</strong> real wages of low-skilled urban workers by about 15 per cent. Even with<br />
<strong>the</strong>se wage changes, urban workers stay considerably better paid than rural workers.<br />
Publications: Mai, Y., X. Peng, P. Dixon and M.Rimmer (2009), “The effects of facilitating <strong>the</strong> flow of rural<br />
workers to urban employment in China, CoPS/IMPACT Working Paper No. G-188, Nov., pp. 35, available<br />
at http://www.monash.edu.au/policy/ftp/workpapr/g-188.pdf (under consideration Papers in Regional<br />
Science).<br />
Mai, Y., M. Lai, X. Peng and H. Xiao (2012), MC-HUGE: <strong>the</strong> <strong>Monash</strong>-China Hunan-<strong>University</strong> General<br />
Equilibrium model and its policy applications (In Chinese), Hunan <strong>University</strong> Press, forthcoming, 2012.<br />
26
23. LNG project in Papua New Guinea<br />
Client: Bank of Papua New Guinea<br />
Researchers: Professor Peter B. Dixon and Professor Maureen T. Rimmer<br />
Summary & impact: ExxonMobil commenced work in 2010 on an LNG Project in<br />
Papua New Guinea (PNG). Expenditures on setting up <strong>the</strong> Project are expected to<br />
total $A12 billion and average annual export revenue in 2010 prices is expected to<br />
be $A4 billion for <strong>the</strong> period 2013 to 2042. These are huge numbers for PNG which<br />
had GNP in 2010 of $A10 billion and exports of $A6 billion.<br />
The Bank of PNG commissioned us to simulate <strong>the</strong> Project’s effects on consumption,<br />
sectoral outputs, wages and o<strong>the</strong>r variables under three macroeconomic management strategies: a<br />
conservative strategy in which <strong>the</strong> government uses Project revenues to accumulate foreign assets<br />
during <strong>the</strong> early years of <strong>the</strong> Project and allows PNG’s standard of living to rise only slowly; an<br />
aggressive strategy in which <strong>the</strong> government borrows against future earnings from <strong>the</strong> Project and<br />
allows PNG’s standard of living to rise rapidly; and a passive strategy in which Project revenues are<br />
consumed as <strong>the</strong>y accrue.<br />
Under each of our three scenarios, <strong>the</strong> average LNG-induced increase in PNG standard of living is<br />
about 7 per cent, but <strong>the</strong> timing of <strong>the</strong> increases differs markedly (Figure 1). Under <strong>the</strong> conservative<br />
scenario, PNG initially adopts relatively tight fiscal policy, leading to increased national savings and<br />
accumulation of foreign assets up to 2024. Under <strong>the</strong> aggressive scenario, PNG adopts <strong>the</strong> opposite<br />
strategy. Fiscal policy is initially expansionary, leading to decreased national savings and<br />
accumulation of foreign debt. Under <strong>the</strong> passive policy scenario, fiscal policy is neutral, allowing<br />
LNG revenue to be spent as it accrues with no change in foreign assets/liabilities. A <strong>the</strong>me of our<br />
analysis was that economic adjustment problems associated with <strong>the</strong> LNG Project will be easier to<br />
handle if <strong>the</strong> conservative pattern of consumption increases is adopted.<br />
While <strong>the</strong> LNG Project is significant for <strong>the</strong> PNG economy, care must be taken not to exaggerate its<br />
effects. In popular discussions, emphasis is often placed on GDP effects. For example an ACIL<br />
Tasman report predicts huge increases (e.g. 100 per cent) in GDP. However, <strong>the</strong> increase in GDP is<br />
not relevant. Attention should be concentrated on <strong>the</strong> effects on GNP and <strong>the</strong> consequent potential<br />
for increases in public and private consumption.<br />
Our report is being used by <strong>the</strong> Bank to advise government on alternative macro polices and to help<br />
hose down exaggerated expectations within both <strong>the</strong> government and <strong>the</strong> financial community.<br />
Figure 1. Standard of living (measured by public & private consumption) under alternative<br />
policies for management of LNG revenues<br />
Publication: Dixon, P.B., G. Kauzi and M.T. Rimmer, “The effects on <strong>the</strong> PNG economy of a major LNG<br />
Project”, Economic Papers, Vol. 29(2), June, 2010, pp. 143-155.<br />
27
24. Economic impacts of large natural resource projects in Australia<br />
Clients: Includes BHP Billiton, Hamersley Iron, Chevron and Woodside, Tasmanian govt.<br />
Researchers: Prof. Philip Adams, Dr James Giesecke, Dr Glyn Wittwer and Dr Janine Dixon<br />
Summary & impact:<br />
Large resource projects have<br />
large economic impacts, but not<br />
necessarily large benefits for<br />
<strong>the</strong> incumbent population. Take,<br />
for example, <strong>the</strong> proposed<br />
Olympic Dam expansion in<br />
South Australia. The mine is<br />
owned and operated by BHP<br />
Billiton. It is <strong>the</strong> world’s fourth<br />
largest copper resource, <strong>the</strong><br />
largest known deposit of<br />
uranium and also has rich<br />
deposits of silver and gold.<br />
The proposed development involves <strong>the</strong><br />
creation of a new open-pit mine that would<br />
operate simultaneously with <strong>the</strong> existing<br />
underground mine. The new mine would be<br />
built over several stages, with <strong>the</strong> existing<br />
smelter expanded and new concentrator and<br />
hydrometallurgical plants built on site to<br />
process some of <strong>the</strong> additional ore.<br />
Construction of <strong>the</strong> new facilities is expected<br />
to cost around $19 billion over 10 years, and<br />
new production is valued at about $4.2 billion<br />
(2011 prices) annually for <strong>the</strong> next 40 years.<br />
The impacts of this development on <strong>the</strong> semiarid<br />
region where it is located will be profound.<br />
The impacts on <strong>the</strong> state of South Australia<br />
will also be large – <strong>the</strong> mine’s annual<br />
production is around 5 per cent of state GSP.<br />
But what about <strong>the</strong> expanded mine’s economic<br />
benefit to <strong>the</strong> state and to <strong>the</strong> nation? Nearly<br />
all of <strong>the</strong> new production will be exported with<br />
some processing occurring on site. It is<br />
estimated that <strong>the</strong>re will be around 4000 new<br />
jobs created by <strong>the</strong> development, with half<br />
requiring high-skill qualifications of <strong>the</strong> type<br />
that are in strong demand from Western<br />
Australian mineral producers. Profit is nearly<br />
five times <strong>the</strong> cost of labour, so much of <strong>the</strong><br />
income returned from <strong>the</strong> new project is profitdividend<br />
to <strong>the</strong> mine’s owners. The Centre of<br />
Policy Studies (CoPS) was asked by <strong>the</strong><br />
mine’s owner and <strong>the</strong> state government to<br />
assess <strong>the</strong> final benefit. Our findings, which<br />
are confidential, suggest that <strong>the</strong> benefits are<br />
relatively small compared with <strong>the</strong> overall<br />
25. Optimal tariffs: why CoPS changed sides<br />
28<br />
scale of <strong>the</strong> new operation. We showed for <strong>the</strong><br />
nation that <strong>the</strong> size of benefits diminished: <strong>the</strong><br />
greater was <strong>the</strong> streng<strong>the</strong>ning of <strong>the</strong> real<br />
exchange rate associated with <strong>the</strong> mine’s new<br />
production; <strong>the</strong> more intense was <strong>the</strong> upward<br />
effects on skilled-wage costs brought about by<br />
<strong>the</strong> mine’s ramped-up requirement for workers;<br />
<strong>the</strong> greater was <strong>the</strong> share of profits accruing to<br />
foreign share owners; and <strong>the</strong> lower was <strong>the</strong><br />
extraction of taxation revenue via royalties and<br />
<strong>the</strong> new mining resource rent tax.<br />
This appraisal was at odds with a number of<br />
earlier studies which showed huge economic<br />
benefits for <strong>the</strong> state and nation. These earlier<br />
studies employed input-output models which<br />
failed to account for supply-side constraints in<br />
<strong>the</strong> markets for labour of certain occupational<br />
types and for indirect effects working through<br />
<strong>the</strong> balance of payments (Dutch disease). Our<br />
modelling takes account of <strong>the</strong>se factors and<br />
hence provides a more balanced assessment of<br />
<strong>the</strong> final economic outcome.<br />
Because of <strong>the</strong>se insights, CoPS modelling is<br />
now used routinely by state governments and,<br />
in some circumstances, by <strong>the</strong> Federal<br />
government, to provide economic assessments<br />
of resource projects. In 2011 we assessed two<br />
LNG projects in WA, one LNG project in<br />
QLD and three o<strong>the</strong>r mining projects in NSW<br />
and Vic. CoPS has also analyzed renewable<br />
resource projects, including native-forest<br />
harvesting in Tasmania<br />
Publications: None yet available. We have<br />
supplied confidential reports to clients.
Client: Lateral Economics, for <strong>the</strong>ir<br />
submission to <strong>the</strong> Bracks Inquiry<br />
Researchers: Profs. P. Dixon and M. Rimmer<br />
Summary & impact: In <strong>the</strong> 1970s Australian<br />
manufacturing was protected by tariffs that<br />
averaged 50%. Prominent economists<br />
advocated tariff reductions. They argued that<br />
<strong>the</strong>re were losers as well as winners from<br />
protection, and that losses outweighed gains.<br />
However <strong>the</strong> winners, most notably Motor<br />
vehicles & parts (MVP), were clearly<br />
identifiable and advocated stridently that<br />
tariffs must be maintained to preserve jobs.<br />
Against this powerful lobby group, what was<br />
needed was a voice for <strong>the</strong> widely spread and<br />
less identifiable losers.<br />
In 1975 <strong>the</strong> Australian government set up <strong>the</strong><br />
IMPACT Project, in <strong>the</strong> now Productivity<br />
Commission, with <strong>the</strong> task of creating a<br />
quantitative tool for analysing protection: a<br />
tool that would identify losers as well as<br />
winners and calculate losses and gains. The<br />
IMPACT team (which eventually became<br />
CoPS) produced <strong>the</strong> detailed economy-wide<br />
ORANI model (a predecessor of MONASH)<br />
which was crucial in winning <strong>the</strong> tariff debate.<br />
Since <strong>the</strong> late 70s, Australia has followed an<br />
ambitious program of unilateral tariff<br />
reductions. The majority of imports are now<br />
subject to tariffs of 5% or less. However<br />
tariffs of 10% apply to MVP. In 2008, <strong>the</strong><br />
government commissioned <strong>the</strong> Bracks Inquiry<br />
into MVP. This inquiry received advice from<br />
<strong>the</strong> Productivity Commission recommending<br />
continuing reductions in MVP tariffs.<br />
But <strong>the</strong> wheel turns, and CoPS has changed<br />
sides in <strong>the</strong> tariff debate. At <strong>the</strong> Bracks<br />
Inquiry, CoPS now opposed continuing MVP<br />
tariff reductions. Why was this? Reductions in<br />
tariffs have two opposing effects: positive<br />
efficiency effects which allow Australia to<br />
save resources by substituting export<br />
activities for import-competing activities; and<br />
negative terms-of-trade effects whereby<br />
Australia’s welfare is deteriorated by<br />
importing more (driving up <strong>the</strong> price of<br />
imports) and consequently exporting more<br />
(driving down <strong>the</strong> price of exports).<br />
29<br />
Figure 1 shows <strong>the</strong> efficiency effects. A<br />
reduction in <strong>the</strong> tariff rate by ∆T increases<br />
imports by ∆M and produces an efficiency<br />
gain of area ecgf. It is clear from <strong>the</strong> figure<br />
that efficiency effects are a reducing function<br />
of <strong>the</strong> tariff rate. On <strong>the</strong> o<strong>the</strong>r hand, terms-oftrade<br />
effects are not a reducing function of <strong>the</strong><br />
tariff rate. So as tariffs are reduced <strong>the</strong>re<br />
reaches a stage, at <strong>the</strong> optimal tariff, where a<br />
unilateral tariff reduction lowers welfare.<br />
Whereas 50% is well above <strong>the</strong> optimal tariff<br />
rate, 10% is considerably below. This<br />
explains why Australia should, along with<br />
most o<strong>the</strong>r countries, pursue tariff reductions<br />
in a multilateral framework: unilateral tariff<br />
reductions are no longer in Australia’s best<br />
interests.<br />
∆T<br />
P cif<br />
Figure 1 Demand for imports<br />
prices<br />
D<br />
1+T<br />
d<br />
e<br />
∆M<br />
c<br />
f g<br />
a b<br />
quantity<br />
Publications:<br />
Dixon, P.B. and M.T. Rimmer (2010), “Optimal tariffs:<br />
should Australia cut automotive tariffs unilaterally?”,<br />
Economic Record,86(273), June, pp. 143-161.<br />
Dixon, P.B. (2009). “Comments on <strong>the</strong> Productivity<br />
Commission’s modelling of <strong>the</strong> economy-wide effects of<br />
future automotive assistance” Economic Papers”, Vol.<br />
28(1), March, pp. 11-18.<br />
Dixon, P.B. (2009) “Towards improving <strong>the</strong> conduct of<br />
policy modelling: a response to Gropp, Jomini and<br />
Salerian”, Economic Papers”, Vol. 28(1), March, pp. 25-<br />
26.<br />
D
26. The H1N1 influenza epidemic<br />
Clients: U.S. Department of Homeland Security via <strong>the</strong> CREATE Centre; Australia’s National<br />
Health and Medical Research Council; and Risk Management Solutions<br />
Researchers: Prof. Peter Dixon, Prof. Maureen Rimmer, Dr George Verikios & Dr James Giesecke,<br />
Summary & impact: April 2009 saw <strong>the</strong> emergence of <strong>the</strong> H1N1 influenza virus in <strong>the</strong> U.S. By June 2009<br />
it seemed likely that <strong>the</strong> U.S. would face an H1N1 epidemic in <strong>the</strong> winter<br />
of 2009-10, possibly as serious as those of 1957 and 1968 which killed<br />
70,000 and 34,000 U.S. residents, or even as serious as <strong>the</strong> 1918 epidemic<br />
which killed 500,000 U.S. residents. Such epidemics are not only a<br />
medical crisis, but may have significant economic effects.<br />
CoPS was commissioned by <strong>the</strong> U.S. Department of Homeland Security<br />
in June 2009 to quantify <strong>the</strong>se economic effects. Drawing on work by<br />
from Johns Hopkins <strong>University</strong>, CoPS specified a hypo<strong>the</strong>tical H1N1<br />
epidemic in which 90 million people are infected in <strong>the</strong> first two quarters<br />
of 2010. Of <strong>the</strong>se, 60 million show symptoms and about half this number<br />
seek medical attention, with 300,000 hospitalized and 16,000 deaths.<br />
CoPS calculated that over <strong>the</strong> 6 months of <strong>the</strong> epidemic, <strong>the</strong>re would be:<br />
a 34% reduction in foreign visitors to <strong>the</strong> U.S.; a loss of 74 million<br />
work days associated with increased sick leave and absences from<br />
work by parents caring for sick children; a 2.4 per cent surge in<br />
demand for hospital and o<strong>the</strong>r medical services; and a 10 per cent cut<br />
in expenditures by households on leisure activities involving public<br />
ga<strong>the</strong>rings. Using a quarterly version of USAGE (CoPS U.S. model), CoPS translated <strong>the</strong>se shocks into<br />
effects on employment, GDP and o<strong>the</strong>r macro variables (Table 1).<br />
Table 1. Effects on <strong>the</strong> U.S. of an H1N1 epidemic that infects 90 million U.S. residents (%)<br />
Variable Peak quarter Epidemic year Next year<br />
Employment -2.1 -1.3 0.3<br />
GDP -2.6 -1.6 0.2<br />
Private consumption -3.2 -2.1 -0.1<br />
Investment -4.3 -3.1 0.5<br />
Exports -4.7 -2.7 1.0<br />
Imports -5.7 -4.5 -0.3<br />
Overall, <strong>the</strong> results for individual shocks indicate that <strong>the</strong> macroeconomic consequences of an epidemic are<br />
much more sensitive to demand-side effects such as reductions in international tourism and leisure activities<br />
than to supply-side effects such as reductions in labor input per employed worker. This suggests that demand<br />
stimulus policies might be an appropriate economic response to a serious epidemic.<br />
Following our work on <strong>the</strong> U.S., CoPS was commissioned by <strong>the</strong> National Health and Medical Research<br />
Council to analysis <strong>the</strong> effects on <strong>the</strong> Australian economy of <strong>the</strong> actual H1N1 experience of 2009 and to<br />
contrast this with <strong>the</strong> effects of a more severe hypo<strong>the</strong>tical epidemic. Then in 2010, we were commissioned<br />
by Risk Management Solutions to investigate <strong>the</strong> economic effects of a global pandemic. An interesting<br />
conclusion from this study is that global economic activity will be more strongly affected by a pandemic<br />
with high infection rates ra<strong>the</strong>r than high virulence rates.<br />
Publications:<br />
Dixon, P.B., B. Lee, T. Muehlenbeck, M.T. Rimmer, A.Z. Rose and G. Verikios (2010), “Effects on <strong>the</strong> U.S. of an<br />
H1N1 epidemic: analysis with a quarterly CGE model” Journal of Homeland Security and Emergency Management:<br />
Vol. 7 : Iss. 1, Article 75.<br />
Verikios, G., McCaw, J.M. McVernon, J. and Harris, A.H. (2011), ‘H1N1 Influenza and <strong>the</strong> Australian Macroeconomy.’<br />
Journal of <strong>the</strong> Asia Pacific Economy (forthcoming).<br />
Verikios, G., M. Sullivan, P. Stojanovski, J.Giesecke and G. Woo (2011)“The Global Economic Effects of Pandemic<br />
Influenza”. 14th Annual Conference on Global Economic Analysis, Venice, June 16-18, 2011<br />
30
27. Modelling capacity building for least developing countries: <strong>the</strong> case of Uganda<br />
Clients: World Bank and <strong>the</strong> government of Uganda<br />
Researchers Professor Philip Adams and Ms Louise Roos<br />
Summary & impact: Poverty in <strong>the</strong> Least Developing Countries (LDCs) is pervasive: <strong>the</strong> number of<br />
people living in poverty has more than doubled over <strong>the</strong> past thirty years. This lack of progress<br />
towards poverty reduction is most noticeable in <strong>the</strong> African LDCs.<br />
In developed and some developing countries, poverty reduction involves income transfers, social<br />
welfare systems and targeted job creation programs. But in situations of generalized poverty, where<br />
<strong>the</strong> available resources in <strong>the</strong> economy are barely sufficient to cater for <strong>the</strong> basic needs of <strong>the</strong><br />
population, significant poverty reduction can be achieved only through economic growth.<br />
Sustained economic growth requires a number of things, including good macroeconomic and<br />
microeconomic management. The Centre of Policy Studies (CoPS) has for many years been<br />
constructing economic models to aid economic management in Australia and o<strong>the</strong>r Developed<br />
countries such as <strong>the</strong> U.S. It has also exported its expertise to a number of developing countries,<br />
assisting in <strong>the</strong> building of economic models for Brazil, Vietnam, Indonesia, <strong>the</strong> Philippines, Egypt<br />
and Papua New Guinea.<br />
Most recently, CoPS has been assisting in <strong>the</strong> building of modelling capacity in LDCs, notably<br />
Uganda, Ethiopia and Cambodia. Uganda has been a particular focus-of-effort. The Ugandan project,<br />
which is coordinated out of <strong>the</strong> UK by Oxford Policy Management, is funded by <strong>the</strong> Ugandan<br />
government using money provided, in part, by <strong>the</strong> World Bank. Its aim is twofold: to build a<br />
coordinated micro-macro modelling system with separate CGE, macro and income distribution<br />
components; and to train Ugandan government officials in <strong>the</strong> use and upkeep of <strong>the</strong> system. Up to<br />
now, policy making in Uganda has been almost totally ad hoc, with little statistical underpinning.<br />
CoPS’ work is designed to make <strong>the</strong> process more structured and open to scrutiny. At <strong>the</strong> same time it<br />
is also encouraging increased effort by <strong>the</strong> Ugandan government to improve its statistical collection<br />
capability. By June 2012, CoPS will have run three training courses in <strong>the</strong> use of <strong>the</strong> new model. Each<br />
training course has been seven days in length and has been attended by around 25 government<br />
officials. The project has also led to <strong>the</strong> setting up of a modelling group within <strong>the</strong> Department of<br />
Finance, with a permanent staff of up to five officials. The intended purpose of <strong>the</strong> group is to provide<br />
core modelling support to a number of government departments and <strong>the</strong> Ugandan Central Bank.<br />
The Ugandan project finishes at <strong>the</strong> end of 2012. The final component will be <strong>the</strong> delivery of a report<br />
examining <strong>the</strong> economic contribution of <strong>the</strong> country’s newly discovered oil reserve. In value terms,<br />
relative to <strong>the</strong> size of <strong>the</strong> economy <strong>the</strong> reserve is huge. At its peak, oil is expected to contribute around<br />
40 per cent to Uganda’s annual GDP. Production is<br />
planned to begin in 2015 and to reach full capacity in<br />
2020. The Ugandan government has already set up a<br />
Norwegian-style sovereign fund to manage <strong>the</strong><br />
royalties and taxes flowing into government coffers<br />
from <strong>the</strong> oil project. These monies will be used, in part,<br />
to deal with <strong>the</strong> structural adjustments that <strong>the</strong> country<br />
will face as it moves from a base of subsistenceagriculture<br />
to one of export-mining. CoPS’ modelling<br />
will be critical in quantifying <strong>the</strong> adjustment pressures<br />
in terms of regional and industrial allocation of<br />
resources, and in assessing <strong>the</strong> measures that <strong>the</strong><br />
government might employ to mitigate <strong>the</strong>se pressures..<br />
Publications: None yet, project still in progress. A working paper has been produced:<br />
Roos, L,. P Adams and J. Van Heerden (2012) “Construction and updating of a Ugandan CGE database”,<br />
CoPS/IMPACT Working paper no. G-226 available at http://www.monash.edu.au/policy/ftp/workpapr/g-<br />
226.pdf .<br />
31
28. The MyAGE Model of Malaysia<br />
Clients: Malaysian Ministry of Finance<br />
Researcher: Professor John Madden, Dr Nhi Tran, Dr James Giesecke, Dr Yinhua Mai and Dr<br />
George Verikios<br />
Summary & impact: In 2009 <strong>the</strong> Malaysian Ministry of Finance (MoF) commissioned CoPS to<br />
construct MyAGE, a dynamic fiscal computable general equilibrium model of <strong>the</strong> Malaysian<br />
economy. Key concerns of MoF were: to obtain a state-of-<strong>the</strong>-art CGE model which contained all <strong>the</strong><br />
features <strong>the</strong>y required for <strong>the</strong>ir forecasting and policy analysis; to have <strong>the</strong> model fully documented;<br />
to receive sufficient training so that MoF staff<br />
could make full use of <strong>the</strong> model; and to have<br />
access to continued post-model-delivery support.<br />
CoPS constructed both annual and quarterly<br />
versions of MyAGE containing a range of features<br />
designed to capture key characteristics of <strong>the</strong><br />
Malaysian economy. The initial simulation<br />
updated <strong>the</strong> model’s 121 industry database from<br />
2005, <strong>the</strong> year of Malaysia’s latest inter-industry<br />
data, to 2008. Forecasts were <strong>the</strong>n undertaken for<br />
<strong>the</strong> years 2009 to 2011 as input to <strong>the</strong> 2009-10<br />
Malaysian budget process. A feature of <strong>the</strong>se<br />
forecasts was CoPS’ modelling of <strong>the</strong> effects on Malaysia of <strong>the</strong> global financial crisis. The<br />
simulations accounted for substantial excess capacity and labour hoarding in Malaysian industry<br />
during 2009. These factors were gradually unwound in <strong>the</strong> forecasts for <strong>the</strong> following years and <strong>the</strong><br />
model projected a V-shaped recovery.<br />
A key component of <strong>the</strong> project was <strong>the</strong> successful transfer of <strong>the</strong> new modelling capacity to MoF.<br />
During <strong>the</strong> course of <strong>the</strong> project, CoPS collaborated closely with MoF to establish <strong>the</strong> economic<br />
questions that <strong>the</strong>y wished to examine. CoPS gave five presentations to members of <strong>the</strong> Economic and<br />
International Division of <strong>the</strong> Ministry over <strong>the</strong> course of <strong>the</strong> project on <strong>the</strong> model’s capabilities, <strong>the</strong><br />
results of MyAGE forecasts and policy applications. Two one-week training courses were delivered at<br />
<strong>the</strong> Ministry’s offices in Putra Jaya (pictured above) to 30 MoF staff. As part of <strong>the</strong> hand-over<br />
package in late 2010, MoF was provided with manuals explaining MyAGE’s <strong>the</strong>ory and database,<br />
how to conduct simulations for a range of applications and how to update <strong>the</strong> model’s database.<br />
The CoPS study team included two staff from <strong>the</strong> Econometric and<br />
Business Statistics Department at <strong>Monash</strong> Sunway (picture at left). The<br />
EBS staff added two ingredients to <strong>the</strong> project. First, <strong>the</strong>y undertook<br />
estimates for some key Malaysian parameters. Second, having attended<br />
several CoPS courses in Malaysia and o<strong>the</strong>r countries, <strong>the</strong>y were able to<br />
provide MoF with an on-<strong>the</strong>-ground first point of post-project support.<br />
MoF were keenly aware that past model development projects by<br />
foreign providers had led to <strong>the</strong> new modelling capacity having only a short life due to lack of local<br />
expertise. There was a determination from both MoF and CoPS that <strong>the</strong> MyAGE project would leave<br />
a long-lasting economic-analytical capacity in Malaysia. There is good evidence that this will be <strong>the</strong><br />
case. A member of MoF’s staff commenced her PhD studies at CoPS in 2011. There was also a<br />
follow-up project in 2011 consisting of a fur<strong>the</strong>r training course in Malaysia and analyses of several<br />
economic issues facing Malaysia, particularly <strong>the</strong> vexed matter of <strong>the</strong> country’s extensive fuel<br />
subsidies. A fur<strong>the</strong>r project for 2012 is currently under negotiation. Part of this proposed study is an<br />
analysis of sources of Malaysian economic growth, using <strong>the</strong> advanced historical modelling features<br />
of MyAGE.<br />
Related Report: N. Tran, J. Madden, G. Verikios & J. Giesecke, “MyAGE: A Dynamic Computable General<br />
Equilibrium Model of <strong>the</strong> Malaysian Economy”, Final Report for Ministry of Finance Malaysia, October, 2010.<br />
32
29. Modelling economic change in Brazil<br />
Clients: Inter-American Development Bank (IADB); São Paulo Research Foundation<br />
(FAPESP);<strong>University</strong> of São Paulo Research (Nereus - FEA - USP)<br />
Researchers: Professor Mark Horridge and Dr James Giesecke<br />
Summary & impact:<br />
The last 10 years has seen <strong>the</strong> birth of<br />
Brazil as a world power, in both economic<br />
and diplomatic terms. For <strong>the</strong> last 20 years<br />
<strong>the</strong> CoPS style of economic modelling has<br />
steadily gained traction in Brazil. Hence <strong>the</strong><br />
CoPS approach is now widely known and<br />
appreciated in this important emerging<br />
country.<br />
The CoPS-Brazil links began in 1995 with<br />
an approach by Professor Eduardo Haddad<br />
of Brazil's leading economics faculty at <strong>the</strong><br />
<strong>University</strong> of São Paulo. Aided by CoPS<br />
researcher Dr Mat<strong>the</strong>w Peter, Haddad and<br />
his team constructed BMARIA, a multiregional CGE model closely based on <strong>the</strong> Australian MMRF<br />
model. Over <strong>the</strong> years BMARIA variants have been used to analyse a variety of issues.<br />
Links were streng<strong>the</strong>ned by a 2002 one-year sabbatical stay at CoPS by Professor Joaquim Ferreira-<br />
Filho of ESALQ (Brazil's leading agricultural university). Since <strong>the</strong>n Professor Ferreira has worked<br />
closely with Mark Horridge of CoPS to develop a sequence of models with far greater regional,<br />
sectoral and distributional detail than BMARIA. These models have been used to address several<br />
questions of world interest:<br />
• Can Brazil supply increasing world demands for food and bio-fuel? Do <strong>the</strong>se two demands<br />
compete?<br />
• Brazilian income distribution has been most unequal, both within and between regions. Are such<br />
inequities reduced or exacerbated by freer trade and Brazil's recent export orientation? Will higher<br />
food prices outweigh <strong>the</strong> benefits of more farm employment ?<br />
• Can Brazilian agriculture expand without chopping down <strong>the</strong> Amazon rainforest?<br />
Model scenarios have featured in numerous conference presentations, and several journal publications.<br />
Academic exchange has continued, with 3 CoPS staff visiting Brazil, and several Brazilians visiting<br />
CoPS. Recent visitors have included 2 post-docs from CEDEPLAR, Brazil's center of regional<br />
economics, at <strong>the</strong> Federal <strong>University</strong> of Minas Gerais, where yet ano<strong>the</strong>r Brazilian CGE model has<br />
been developed (again closely based on CoPS’ TERM model of Australia).<br />
Publications<br />
Horridge, J.M. and J.B. de Souza Ferreira Filho (2006), “Economic Integration, Poverty and Regional Inequality<br />
in Brazil”, Revista Brasileira de Economia (Brazilian Economic Review), Vol. 60 (4).<br />
Horridge, J.M. and J.B. de Souza Ferreira Filho (2005), “The Doha Round, Poverty and Regional Inequality in<br />
Brazil”, chapter in T.W. Hertel and L.A. Winter (eds.) Poverty and <strong>the</strong> WTO: Impacts of <strong>the</strong> Doha<br />
Development Agenda, Palgrave Macmillan, pp. 183-217.<br />
Horridge, J.M. and J.B. de Souza Ferreira Filho (2006), “The Doha Development Agenda: Distributional<br />
Impacts”, Review of Agricultural Economics, Vol. 28(3), pp. 362-369.<br />
Giesecke, J.A., J.M. Horridge and J.A. Scaramucci (2009), “Brazilian Regional Structural Adjustment to Rapid<br />
Growth in Global Ethanol Demand”, Studies in Regional Science, 39(1), 189-207.<br />
Horridge, J.M. and J.B. de Souza Ferreira Filho (2010), Chapter 13 (Brazil) in K. Anderson, J. Cockburn, and<br />
W. Martin (eds), Agricultural Price Distortions, Inequality, and Poverty, World Bank Publications, ISBN:<br />
978-0-8213-8184-7, 528 pp., March 2010.<br />
33
30. Building capacity for economic policy analysis in transition economies: Vietnam<br />
Clients: United Nations Development Programme (UNDP);The World Bank<br />
Australian Agency for International Development (AusAID)<br />
Researchers: Dr J. Giesecke, Dr N. Tran, Mr E. Corong, Dr G.A. Meagher &Ms F. Pang<br />
Summary & impact: In 2008 CoPS developed a fiscal CGE model for Vietnam’s Ministry<br />
of Finance, under a UNDP project aimed<br />
at developing public sector capacity for<br />
policy analysis. Early model applications<br />
focussed on <strong>the</strong> impact of Vietnam’s 2009<br />
fiscal stimulus package and reform of <strong>the</strong><br />
value added tax (VAT).<br />
The VAT work generated two papers<br />
outlining one of <strong>the</strong> most detailed models<br />
of indirect tax policy ever undertaken, a<br />
model that expresses <strong>the</strong> real world details<br />
of <strong>the</strong> VAT as legislated, not merely as it<br />
might be conceived in a textbook.<br />
We show how Vietnam’s VAT can be<br />
streamlined. Replacement of <strong>the</strong> present<br />
system by a single budget-neutral VAT<br />
rate for all commodities except rice (a<br />
staple for low-income households) with no<br />
discretionary exemptions, would increase<br />
household consumption in Vietnam by<br />
0.2%, with little impact on welfare<br />
distribution. We also develop a new index<br />
of VAT compliance, one that is more<br />
comprehensive than <strong>the</strong> commonly used<br />
compliance measures in <strong>the</strong> pre-existing<br />
VAT literature. Applying <strong>the</strong> new measure<br />
to Vietnam, we demonstrate how <strong>the</strong><br />
country’s apparently low compliance rate<br />
can be traced to legislated features of <strong>the</strong><br />
VAT regime, not low compliance as<br />
commonly understood. For tax authorities,<br />
who must efficiently allocate scarce VAT<br />
enforcement resources, this is an important<br />
finding.<br />
Over 2009/10 we conducted two studies<br />
for <strong>the</strong> World Bank. The first examined<br />
<strong>the</strong> consequences for Vietnam of climate<br />
34<br />
change and associated adaptation<br />
measures to 2050. The second examined<br />
Vietnam’s policy interventions in its<br />
market for rice, <strong>the</strong> country’s most<br />
important agricultural product. We showed<br />
that <strong>the</strong> removal of <strong>the</strong>se policies would<br />
improve <strong>the</strong> country’s welfare while<br />
maintaining a high level of food security.<br />
Under a recent AusAID project, for<br />
Vietnam’s Ministry of Labour (MOL), we<br />
extended <strong>the</strong> model’s labour market and<br />
income distributional detail, and<br />
developed a linked micro-simulation<br />
model. We generated forecasts of<br />
employment by occupation and<br />
qualification, and outcomes for poverty<br />
and inequality. The project was concluded<br />
in Hanoi, with presentations at MOL<br />
attended by Australia’s Ambassador to<br />
Vietnam.<br />
Capacity building has been a major part of<br />
our Vietnamese work. Since 2008, we<br />
have presented six CGE training courses<br />
in Vietnam, each attended by<br />
approximately 20 researchers from both<br />
government and university sectors.<br />
Publications: Giesecke, J. & N. Tran.<br />
(2012), “A general framework for measuring<br />
VAT compliance rates”. Applied Economics.<br />
44 (15), May 2012, 1867-1889.<br />
Giesecke, J. & N. Tran. (2010), “Modelling<br />
value-added tax in <strong>the</strong> presence of multiproduction<br />
and differentiated exemptions”<br />
Journal of Asian Economics, 21 (2), 156-173.<br />
Giesecke, J. & N. Tran. (2009), “Sources of<br />
growth and structural change in <strong>the</strong><br />
Vietnamese economy, 1996-2003: A CGE<br />
analysis”, Asian Economic Journal, June<br />
2009, 23(2), 195- 224.<br />
Giesecke, J. & N. Tran. (2009), “An economic<br />
analysis of Vietnam’s fiscal stimulus<br />
package”, Vietnam's Socio-economic<br />
Development Review. No. 58, June, 35-51.<br />
Giesecke, J.A. & N.H. Tran. (2008), “Just how<br />
quickly has <strong>the</strong> Vietnamese capital stock<br />
grown over <strong>the</strong> past decade?”, Vietnam<br />
Economic Management Review, 2(2), 31-44.