Effects of high pH on a natural marine planktonic community
Effects of high pH on a natural marine planktonic community
Effects of high pH on a natural marine planktonic community

You also want an ePaper? Increase the reach of your titles
YUMPU automatically turns print PDFs into web optimized ePapers that Google loves.
24<br />
Copepods<br />
In terms <str<strong>on</strong>g>of</str<strong>on</strong>g> numbers, the copepod <strong>community</strong> in the<br />
incubati<strong>on</strong>s c<strong>on</strong>sisted mainly <str<strong>on</strong>g>of</str<strong>on</strong>g> small Oith<strong>on</strong>a spp.<br />
and <strong>on</strong>ly a few much larger copepods <str<strong>on</strong>g>of</str<strong>on</strong>g> the genera<br />
Pseudo-/Paracalanus spp. were found in the sample<br />
volumes studied. At the initiati<strong>on</strong> <str<strong>on</strong>g>of</str<strong>on</strong>g> the experiment, a<br />
c<strong>on</strong>centrati<strong>on</strong> <str<strong>on</strong>g>of</str<strong>on</strong>g> 84 copepods per litre were found,<br />
including all developmental stages. In the <str<strong>on</strong>g>pH</str<strong>on</strong>g> 8 incubati<strong>on</strong>,<br />
the number <str<strong>on</strong>g>of</str<strong>on</strong>g> copepods increased slightly<br />
during the experimental period, whereas a slight<br />
decrease was found at <str<strong>on</strong>g>pH</str<strong>on</strong>g> 8.5. No copepods were<br />
found in the <str<strong>on</strong>g>pH</str<strong>on</strong>g> 9 and 9.5 incubati<strong>on</strong>s after Days 5<br />
and 0, respectively (data not shown). Thus, the aver-<br />
Mar Ecol Prog Ser 260: 19–31, 2003<br />
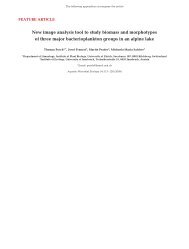
Fig. 5. Cell c<strong>on</strong>centrati<strong>on</strong>s <str<strong>on</strong>g>of</str<strong>on</strong>g> selected phototrophic din<str<strong>on</strong>g>of</str<strong>on</strong>g>lagellates in the 4 incubati<strong>on</strong>s during the 2 wk experimental period.<br />
(A) Prorocentrum micans, (B) P. minimum, (C) Heterocapsa triquetra, (D) Ceratium tripos, (E) Ceratium furca, (F) C. fusus.<br />
(y) <str<strong>on</strong>g>pH</str<strong>on</strong>g> 8.0; (j) <str<strong>on</strong>g>pH</str<strong>on</strong>g> 8.5; (S) <str<strong>on</strong>g>pH</str<strong>on</strong>g> 9.0; (m) <str<strong>on</strong>g>pH</str<strong>on</strong>g> 9.5. Symbols represent means <str<strong>on</strong>g>of</str<strong>on</strong>g> triplicates ± SE<br />
Table 1. Cylindrotheca closterium. Growth rate (d –1 ) for the<br />
incubati<strong>on</strong>s <str<strong>on</strong>g>pH</str<strong>on</strong>g> 8.0, 8.5, 9.0 and 9.5<br />
<str<strong>on</strong>g>pH</str<strong>on</strong>g> Growth rate (d –1 )<br />
Days 0 to 7 Days 7 to 14 Days 0 to 14<br />
8.0 0.54 ± 0.07 0.53 ± 0.05 0.54 ± 0.05<br />
8.5 0.62 ± 0.09 0.56 ± 0.003 0.56 ± 0.04<br />
9.0 0.65 ± 0.07 0.97 ± 0.04 0.81 ± 0.02<br />
9.5 0.48 ± 0.06 0.93 ± 0.04 0.70 ± 0.05<br />
age length and total calculated biomass increased<br />
over time <strong>on</strong>ly in the <str<strong>on</strong>g>pH</str<strong>on</strong>g> 8 and 8.5 incubati<strong>on</strong>s (Figs. 9<br />
& 10).<br />
The calculated maximum clearance for the <str<strong>on</strong>g>pH</str<strong>on</strong>g> 8 and<br />
8.5 incubati<strong>on</strong>s revealed that about 6% <str<strong>on</strong>g>of</str<strong>on</strong>g> the water<br />
was cleared daily at the start <str<strong>on</strong>g>of</str<strong>on</strong>g> the experiment. C<strong>on</strong>siderable<br />
variati<strong>on</strong> in calculated clearance was found<br />
and no c<strong>on</strong>sistent increase was observed during the<br />
experiment, probably due to the small sample sizes<br />
used. However, taking all data <strong>on</strong> clearance from the<br />
<str<strong>on</strong>g>pH</str<strong>on</strong>g> 8 and 8.5 incubati<strong>on</strong>s into c<strong>on</strong>siderati<strong>on</strong>, the maximum<br />
and the average rate corresp<strong>on</strong>ded to a removal<br />
<str<strong>on</strong>g>of</str<strong>on</strong>g> 38 and 10% <str<strong>on</strong>g>of</str<strong>on</strong>g> the prey populati<strong>on</strong>s per day,<br />
respectively (Table 2).<br />
DISCUSSION<br />
How did elevated <str<strong>on</strong>g>pH</str<strong>on</strong>g> affect the phytoplankt<strong>on</strong><br />
<strong>community</strong>?<br />
The phytoplankt<strong>on</strong> communities incubated at <str<strong>on</strong>g>pH</str<strong>on</strong>g> 9<br />
and 9.5 clearly developed differently from those<br />
incubated at <str<strong>on</strong>g>pH</str<strong>on</strong>g> 8 and 8.5, with the most pr<strong>on</strong>ounced<br />
differences found at <str<strong>on</strong>g>pH</str<strong>on</strong>g> 9.5 (Fig. 3). In the <str<strong>on</strong>g>pH</str<strong>on</strong>g> 9.5 incu-