Chapter 2: Energy at the Lunar Surface - Lunar and Planetary Institute
Chapter 2: Energy at the Lunar Surface - Lunar and Planetary Institute
Chapter 2: Energy at the Lunar Surface - Lunar and Planetary Institute

You also want an ePaper? Increase the reach of your titles
YUMPU automatically turns print PDFs into web optimized ePapers that Google loves.
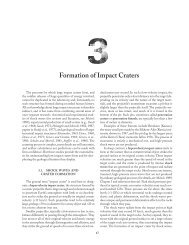
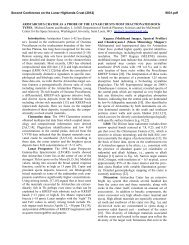
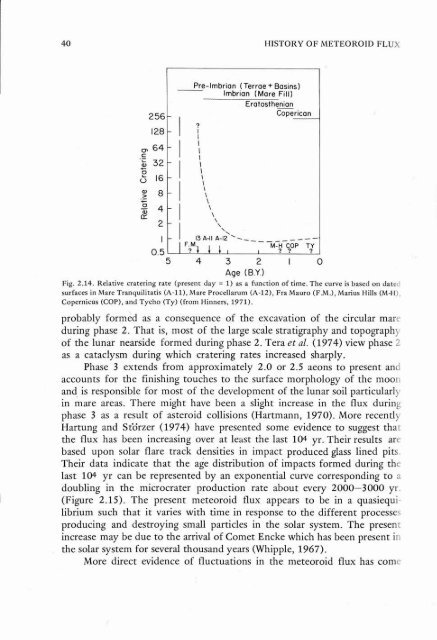
Pre-lmbrian (Terrae + Basins)<br />
lmbrian (Mare Fill)<br />
Er<strong>at</strong>os<strong>the</strong>*<br />
Coperican<br />
I<br />
F. M. M-H COP TT<br />
1 ? 1 1 I, I ? ? .<br />
HISTORY OF METEOROID FLUX<br />
0.5<br />
5 4 3 2 I 0<br />
Age (B.Y.1<br />
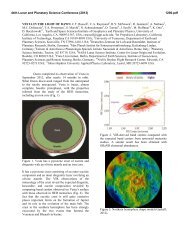
Fig. 2.14. Rel<strong>at</strong>ive cr<strong>at</strong>ering r<strong>at</strong>e (present day = 1) as a function of time. The curve is based on d<strong>at</strong>ed<br />
surfaces in Mare Tranquilit<strong>at</strong>is (A-1 1 ), Mare Procellarum (A-1 2), Fra Mauro (F .M .), Marius Hills (M-H) ,<br />
Copernicbs (COP), <strong>and</strong> Tycho (Ty) (from Hinners, 1971).<br />
probably formed as a consequence of <strong>the</strong> excav<strong>at</strong>ion of <strong>the</strong> circular mare<br />
during phase 2. Th<strong>at</strong> is, most of <strong>the</strong> large scale str<strong>at</strong>igraphy <strong>and</strong> topography<br />
of <strong>the</strong> lunar nearside formed during phase 2. Tera et al. (1974) view phase 2<br />
as a c<strong>at</strong>aclysm during which cr<strong>at</strong>ering r<strong>at</strong>es increased sharply.<br />
Phase 3 extends from approxim<strong>at</strong>ely 2.0 or 2.5 aeons to present <strong>and</strong><br />
accounts for <strong>the</strong> finishing touches to <strong>the</strong> surface morphology of <strong>the</strong> moon<br />
<strong>and</strong> is responsible for most of <strong>the</strong> development of <strong>the</strong> lunar soil particularly<br />
in mare areas. There might have been a slight increase in <strong>the</strong> flux during<br />
phase 3 as a result of asteroid collisions (Hartmann, 1970). More recently<br />
Hartung <strong>and</strong> Sidrzer (1974) have presented some evidence to suggest th<strong>at</strong><br />
<strong>the</strong> flux has been increasing over <strong>at</strong> least <strong>the</strong> last 104 yr. Their results are<br />
based upon solar flare track densities in impact produced glass lined pits.<br />
Their d<strong>at</strong>a indic<strong>at</strong>e th<strong>at</strong> <strong>the</strong> age distribution of impacts formed during <strong>the</strong><br />
last 104 yr can be represented by an exponential curve corresponding to a<br />
doubling in <strong>the</strong> microcr<strong>at</strong>er production r<strong>at</strong>e about every 2000-3000 yr.<br />
(Figure 2.15). The present meteoroid flux appears to be in a quasiequi-<br />
librium such th<strong>at</strong> it varies with time in response to <strong>the</strong> different processes<br />
producing <strong>and</strong> destroying small particles in <strong>the</strong> solar system. The present<br />
increase may be due to <strong>the</strong> arrival of Comet Encke which has been present in<br />
<strong>the</strong> solar system for several thous<strong>and</strong> years (Whipple, 1967).<br />
More direct evidence of fluctu<strong>at</strong>ions in <strong>the</strong> meteoroid flux has come