Indian population in the United States and Alaska. 1910 - RootsWeb
Indian population in the United States and Alaska. 1910 - RootsWeb
Indian population in the United States and Alaska. 1910 - RootsWeb

You also want an ePaper? Increase the reach of your titles
YUMPU automatically turns print PDFs into web optimized ePapers that Google loves.
E<br />
PROM THE<br />
UNITED STATES GOVERNMENT<br />
THRO0GH THE<br />
SUPERINTENDENT OF DOCUMENTS<br />
Asooqw-S". I.7.|vrilii5g<br />
S°^ Kcv- °tat. prohibits <strong>the</strong> withdrawal of this book for home use.<br />
4005
Date Due<br />
•^nfSXI-S aj. WH^l<br />
PRINTED IN<br />
rf¥t^t!t<br />
(SJ<br />
Cornell University Library<br />
E 98 .C3U58 <strong>1910</strong><br />
Ind an <strong>population</strong> <strong>in</strong> <strong>the</strong> <strong>United</strong> <strong>States</strong> a<br />
3 1924 027 011 471
^^<br />
Cornell University<br />
Library<br />
The orig<strong>in</strong>al of this book is <strong>in</strong><br />
<strong>the</strong> Cornell University Library.<br />
There are no known copyright restrictions <strong>in</strong><br />
<strong>the</strong> <strong>United</strong> <strong>States</strong> on <strong>the</strong> use of <strong>the</strong> text.<br />
http://www.archive.org/details/cu31924027011471
DEPARTMENT OF COMMERCE<br />
BUREAU OF THE CENSUS<br />
SAM. L. ROGERS, Director<br />
INDIAN POPULATION<br />
IN THE<br />
UNITED STATES AND<br />
ALASKA<br />
<strong>1910</strong><br />
WASHINGTON<br />
GOVERNMENT PRINTING OFFICE<br />
:9i5<br />
EV.
ASOQqt^
CONTENTS.<br />
SUMMARY OF SUBJECTS.<br />
Letter op Transmittal 7<br />
Introdtjction 9<br />
Population 10-30<br />
Proportion of Mixed-Bloods 31-42<br />
Sex Distribution 43-52<br />
Age Distribution 53-70<br />
Stocks <strong>and</strong> Tribes, by Sex, Age, <strong>and</strong> Mixture of Blood 71-156<br />
Fecundity <strong>and</strong> Vitality 157-160<br />
Marital Condition 161-194<br />
School Attendance 195-211<br />
Illiteracy 212-231<br />
Inability to Speak English 232-249<br />
Occupations 250-282<br />
INDIA.NS Taxed <strong>and</strong> Not Taxed 283-285<br />
CONTENTS OF SUBJECTS.<br />
Introduction 9<br />
Population<br />
10-30<br />
Comparative statistics<br />
Table 1.—<strong>Indian</strong> <strong>population</strong> <strong>in</strong> <strong>the</strong> <strong>United</strong> <strong>States</strong> <strong>and</strong> <strong>Alaska</strong>: 1870-<strong>1910</strong><br />
Table 2.—<strong>Indian</strong> <strong>population</strong>, by divisions <strong>and</strong> states: 1890-<strong>1910</strong><br />
Table 3.—^Number of <strong>Indian</strong>s enumerated on special <strong>and</strong> general schedule, by divisions <strong>and</strong> states:<br />
Table 4.—Number <strong>and</strong> per cent distribution of <strong>Indian</strong>s, for 22 selected states: <strong>1910</strong><br />
<strong>1910</strong><br />
10<br />
10<br />
11<br />
11<br />
12<br />
<strong>Indian</strong>a per 10,000 of total <strong>population</strong> 12<br />
Table 5.—Number of <strong>Indian</strong>a per 10,000 of total <strong>population</strong>, for <strong>the</strong> <strong>United</strong> <strong>States</strong> <strong>and</strong> <strong>Alaska</strong>: 1870-<strong>1910</strong> 13<br />
Table 6.—Number of <strong>Indian</strong>s per 10,000 of total <strong>population</strong>, for 22 selected states: 1890-<strong>1910</strong> 13<br />
<strong>Indian</strong>s per 100 square miles - 14<br />
Table 7.—^Number of <strong>Indian</strong>s per 100 square xoiles, for 22 selected states: <strong>1910</strong> , 14<br />
<strong>Indian</strong>s by stock <strong>and</strong> tribe<br />
^<br />
14<br />
;<br />
Table 8.—^Number of <strong>Indian</strong>s reported on special <strong>Indian</strong> schedule, classified by l<strong>in</strong>guistic stocks <strong>and</strong> tribes: <strong>1910</strong> 15<br />
Table 9.—^<strong>Indian</strong> tribes, by states: <strong>1910</strong> 17<br />
Table 10.—<strong>Indian</strong> <strong>population</strong> of <strong>the</strong> different states, by tribes: <strong>1910</strong> 22<br />
Table 11.—<strong>Indian</strong> <strong>population</strong> of <strong>the</strong> <strong>United</strong> <strong>States</strong>, by counties: 1890-<strong>1910</strong> : 25<br />
Proportion of Mixed-Bloods<br />
31-42<br />
FuU-blood <strong>and</strong> mixed-blood <strong>Indian</strong>s<br />
31<br />
Table 12.—Distribution of <strong>Indian</strong>s accordiag to purity of blood, for <strong>the</strong> <strong>United</strong> <strong>States</strong> <strong>and</strong> <strong>Alaska</strong>: <strong>1910</strong><br />
Table 13.—Distribution of <strong>Indian</strong>s accord<strong>in</strong>g to purity of blood, for 22 selected states: <strong>1910</strong><br />
Table 14.—Distribution of <strong>Indian</strong>s accord<strong>in</strong>g to purity of blood, for each pr<strong>in</strong>cipal stock, tribe, <strong>and</strong> state: <strong>1910</strong><br />
31<br />
32<br />
32<br />
White <strong>and</strong> <strong>Indian</strong> mised-bloods<br />
35<br />
Table 15.—White <strong>and</strong> <strong>Indian</strong> mixed-bloods, by degree of mixture: <strong>1910</strong> 35<br />
Table 16.—Distribution of white <strong>and</strong> <strong>Indian</strong> mixed-bloods accord<strong>in</strong>g to proportion of white blood, f6r 22 selected states:<br />
<strong>1910</strong> V -.<br />
Page.<br />
^^<br />
Table 17.—Distribution of white <strong>and</strong> <strong>Indian</strong> mixed-bloods accord<strong>in</strong>g to proportion of white blood, for each pr<strong>in</strong>cipal stock,<br />
tribe, <strong>and</strong> state: <strong>1910</strong><br />
36<br />
Negro <strong>and</strong> <strong>Indian</strong> mixed-bloods<br />
38<br />
Table 18.—Negro <strong>and</strong> <strong>Indian</strong> mixed-bloods, by degree of mixture: <strong>1910</strong> 38<br />
Full-tribal <strong>and</strong> mixed-tribal <strong>Indian</strong>s<br />
38<br />
Table 19.—Full-blood <strong>Indian</strong>s, by degree of tribal mixture: <strong>1910</strong><br />
38<br />
Table 20.—Distribution of full-blood <strong>Indian</strong>s accord<strong>in</strong>g to tribal mixture, for 22 selected states: <strong>1910</strong> 38<br />
Table 21.—Distribution of full-blodd <strong>Indian</strong>s accord<strong>in</strong>g to purity of stock: <strong>1910</strong><br />
Table 22.—Distribution of full-blood <strong>Indian</strong>s accord<strong>in</strong>g to tribal mixture, for each pr<strong>in</strong>cipal tribe <strong>and</strong> state: <strong>1910</strong><br />
Sex Distribution<br />
39<br />
41<br />
43-52 ^<br />
Comparative statistics<br />
Table 23.—Sex distribution of <strong>the</strong> <strong>Indian</strong>s <strong>in</strong> <strong>the</strong> <strong>United</strong> <strong>States</strong> <strong>and</strong> <strong>Alaska</strong>: 1890-<strong>1910</strong><br />
Table 24.—Males to 100 females <strong>in</strong> <strong>the</strong> <strong>Indian</strong> <strong>population</strong>, for 22 selected states: 1890-<strong>1910</strong><br />
43<br />
44<br />
67090°—15 1<br />
(^)
Sex Distribution—Cont<strong>in</strong>ued.<br />
CONTENTS.<br />
Full-blood <strong>and</strong> mixed-blood <strong>Indian</strong>s<br />
Table 25.—Distribution of <strong>the</strong> <strong>Indian</strong> <strong>population</strong> accord<strong>in</strong>g to sex <strong>and</strong> mixture of blood, for <strong>the</strong> <strong>United</strong> <strong>States</strong> <strong>and</strong> <strong>Alaska</strong>:<br />
<strong>1910</strong><br />
Table 26.—<strong>Indian</strong>s <strong>in</strong> <strong>the</strong> <strong>United</strong> <strong>States</strong>, by divisions <strong>and</strong> states, <strong>and</strong> <strong>in</strong> <strong>Alaska</strong>, classified accord<strong>in</strong>g to sex <strong>and</strong> purity of<br />
blood: <strong>1910</strong><br />
Table 27.—^Males to 100 females among full-bloods <strong>and</strong> among mixed-bloods <strong>in</strong> <strong>the</strong> <strong>Indian</strong> <strong>population</strong>, for <strong>the</strong> <strong>United</strong> <strong>States</strong><br />
45<br />
<strong>and</strong> <strong>Alaska</strong>: <strong>1910</strong><br />
Table 28.—Males to 100 females among full-blood <strong>and</strong> mixed-blood <strong>Indian</strong> children under 5 years of age: <strong>1910</strong><br />
Table 29.—Males to 100 females among full-bloods <strong>and</strong> among mixed-bloods <strong>in</strong> <strong>the</strong> <strong>Indian</strong> <strong>population</strong>, for 22 selected states:<br />
46<br />
46<br />
<strong>1910</strong> 46<br />
Table 30.'—^Malesto 100 females, by purity of blood, for each pr<strong>in</strong>cipal stock, tribe, <strong>and</strong> state: <strong>1910</strong> 47<br />
White <strong>and</strong> <strong>Indian</strong> mixed-bloods 49<br />
Table 31 .—Males to 100 females, among white <strong>and</strong> <strong>Indian</strong> mixed-bloods, by degree of mixture : <strong>1910</strong> 49<br />
Full-tribal <strong>and</strong> mixed-tribal <strong>Indian</strong>s 49<br />
Table 32.—^Males to 100 females among <strong>Indian</strong>s of full blood, by degree of tribal mixture: <strong>1910</strong> 49<br />
Table 33.—Males to 100 females among <strong>Indian</strong>s of full-tribal <strong>and</strong> mixed-tribal blood, for 22 selected states: <strong>1910</strong> 50<br />
Table 34.—Males to 100 females for <strong>Indian</strong>s of full-tribal blood, for each pr<strong>in</strong>cipal tribe <strong>and</strong> state: <strong>1910</strong> 51<br />
Age Distribution 53-70<br />
All <strong>Indian</strong>s 53<br />
Table 35.—^Age distribution of <strong>the</strong> <strong>Indian</strong>s <strong>in</strong> <strong>the</strong> <strong>United</strong> <strong>States</strong> <strong>and</strong> <strong>Alaska</strong>: <strong>1910</strong> <strong>and</strong> 1900 53<br />
Table 36.—Age distribution of <strong>Indian</strong>a, for 22 selected states: <strong>1910</strong> 53<br />
Table 37.—^Age distribution of <strong>Indian</strong>s, for each pr<strong>in</strong>cipal stock <strong>and</strong> tribe: <strong>1910</strong> 55<br />
Table 38.—Distribution by s<strong>in</strong>gle years of age of <strong>the</strong> <strong>Indian</strong> <strong>population</strong> of <strong>the</strong> <strong>United</strong> <strong>States</strong> <strong>and</strong> <strong>Alaska</strong>: <strong>1910</strong> 57<br />
Full-blood <strong>and</strong> mixed-blood <strong>Indian</strong>s 58<br />
Table 39.—Per cent distribution of <strong>Indian</strong>s accord<strong>in</strong>g to age <strong>and</strong> mixture of blood, for <strong>the</strong> <strong>United</strong> <strong>States</strong> <strong>and</strong> <strong>Alaska</strong>: <strong>1910</strong>. 58<br />
Table 40.—<strong>Indian</strong>s <strong>in</strong> <strong>the</strong> <strong>United</strong> <strong>States</strong> <strong>and</strong> <strong>Alaska</strong>, classified accord<strong>in</strong>g to sex <strong>and</strong> age periods, by mixture of blood : <strong>1910</strong>.<br />
Table 41.—<strong>Indian</strong>s <strong>in</strong> <strong>the</strong> <strong>United</strong> <strong>States</strong>, by divisions <strong>and</strong> states, <strong>and</strong> <strong>in</strong> <strong>Alaska</strong>, classified accord<strong>in</strong>g to purity of blood <strong>and</strong><br />
age periods: <strong>1910</strong> 59<br />
Table 42.—^Age distribution of <strong>Indian</strong>s of full blood <strong>and</strong> of mixed blood, for 22 selected states: <strong>1910</strong> 60<br />
Table 43.—^Age distribution of <strong>Indian</strong>a of full blood <strong>and</strong> of mixed blood, for each pr<strong>in</strong>cipal stock <strong>and</strong> tribe: <strong>1910</strong> 60<br />
Sex ratios, by age groups 64<br />
Table 44.—^Males to 100 females <strong>in</strong> <strong>the</strong> <strong>Indian</strong> <strong>population</strong>, by age groupa, for thfe <strong>United</strong> <strong>States</strong> <strong>and</strong> <strong>Alaska</strong>: <strong>1910</strong> 64<br />
Table 45.—^Males to 100 females <strong>in</strong> <strong>the</strong> <strong>Indian</strong> popidation, by age groups, for 22 selected states: <strong>1910</strong> 64<br />
Table 46.—^Males to 100 females <strong>in</strong> each age group, for each pr<strong>in</strong>cipal stock <strong>and</strong> tribe: <strong>1910</strong> 65<br />
Table 47.— ^Males to 100 females, by age groups <strong>and</strong> purity of blood: <strong>1910</strong> 66<br />
Table 48.—Males to 100 females <strong>in</strong> each age group among <strong>Indian</strong>s of full blood <strong>and</strong> of mixed blood, for 22 selected states: <strong>1910</strong>. 67<br />
Table 49.—^Males to 100 females <strong>in</strong> each age group among <strong>Indian</strong>a of full blood <strong>and</strong> of mixed blood, for each pr<strong>in</strong>cipal stock<br />
<strong>and</strong> tribe: <strong>1910</strong> 67<br />
Stocks <strong>and</strong> Tribes, by Sex, Age, <strong>and</strong> Mixture of Blood 71-156<br />
Introduction : 71<br />
<strong>Indian</strong>a <strong>in</strong> <strong>the</strong> <strong>United</strong> Statea (name of stock, tribe, location, etc.) 72-111<br />
Athapaskan stock 77<br />
Caddoan stock<br />
-79<br />
Chimakuan stock 81<br />
Chimarikan stock 81<br />
Ch<strong>in</strong>ookan stock 81<br />
Chitimachan stock<br />
82<br />
Chumashan stock 82<br />
Costanoan stock<br />
82<br />
Croatan group<br />
82<br />
Eskunauaa stock 82<br />
Haidan stock<br />
82<br />
Iroquoian stock<br />
82<br />
Kalapooian stock 85<br />
Karok stock<br />
85<br />
Keresan stock<br />
85<br />
Kiowan stock<br />
86<br />
Kusan stock<br />
86<br />
Kutenaian stock. .<br />
.<br />
Lutuamian stock.<br />
Maidu stock<br />
Miwok stock<br />
Muskhogean stock.<br />
Piman stock<br />
Porno stock<br />
SaUnan stock<br />
Saliehan stock.<br />
87<br />
87<br />
87<br />
87<br />
88<br />
89<br />
89<br />
90<br />
90<br />
Shahaptian stock.<br />
Shastan stock<br />
Shoshonean stock.<br />
Siouan stock<br />
.<br />
44<br />
44<br />
58<br />
Page.<br />
Takehnan stock ; 104<br />
Tanoan stock ^ 104<br />
Tarascan stock 106<br />
Tl<strong>in</strong>git stock iqq<br />
Tonkawan stock 106<br />
Tsimshian stock 106<br />
Tunican stock iqq<br />
Waiilatpuan stock.<br />
•<br />
Wakashan stock 107<br />
Washoan stock 107<br />
W<strong>in</strong>tun stock x07<br />
Wiyat stock 108<br />
Yakonan stock jog<br />
Yanan stock 108<br />
Yokuts stock log<br />
Yuchean stock iqq<br />
Yukian stock l jog<br />
Yuman stock<br />
Yurok stock<br />
io9<br />
hq<br />
Zapotecan stock<br />
-hq<br />
Zunian stock<br />
Miscellaneous<br />
hq<br />
hi<br />
94<br />
96<br />
96<br />
99<br />
CONTENTS. 3<br />
Stocks <strong>and</strong> Tribes, by Sex, Age, <strong>and</strong> Mixture of- Blood—Cont<strong>in</strong>ued. Page.<br />
<strong>Indian</strong>a <strong>in</strong> <strong>Alaska</strong> (name of stock, tribe, location, etc.) 111-115<br />
Page.<br />
Algonquian stock HI<br />
Athapaskan stock HI<br />
Eskimauan stock 112<br />
Haidan stock 115<br />
Page.<br />
Tl<strong>in</strong>git stock 115<br />
Tsimshian stock 115<br />
Miscellaneous 115<br />
Table 50.—Number of <strong>Indian</strong>s reported on special <strong>Indian</strong> schedule, classified by l<strong>in</strong>guistic stocks <strong>and</strong> tribes <strong>and</strong> by sex <strong>and</strong><br />
purity of blood: <strong>1910</strong> 116<br />
Table 51.—<strong>Indian</strong>s <strong>in</strong> each stock <strong>and</strong> tribe <strong>in</strong> <strong>the</strong> <strong>United</strong> <strong>States</strong>, clasatfied accord<strong>in</strong>g to sex <strong>and</strong> age periods, by mixture of<br />
blood : <strong>1910</strong> 123<br />
Table 52 .—<strong>Indian</strong>s <strong>in</strong> each stock <strong>and</strong> tribe <strong>in</strong> <strong>Alaska</strong>, claasified accord<strong>in</strong>g to sex <strong>and</strong> age periods, by mixture of blood : <strong>1910</strong> 154<br />
FECUNDriY AND VrrALiTY : 157-160<br />
Sterility<br />
Table 53.—Women 15 to 44 years of age, married one year or more, bear<strong>in</strong>g no children, by degree of mixture : <strong>1910</strong><br />
157<br />
157<br />
Fecundity<br />
Table 54.—Women 15 to 44 years of age, married 10 to 20 years, bear<strong>in</strong>g children, by degree of mixture: <strong>1910</strong> , . .<br />
157<br />
Table 55.—^Average number of children per marriage, by degree of mixture: <strong>1910</strong> 158<br />
Vitality 158<br />
Table 56.—^Number of children borne by married women <strong>and</strong> liv<strong>in</strong>g at <strong>the</strong> time of <strong>the</strong> enumeration, by degree of mixtiue:<br />
<strong>1910</strong> 158<br />
Table 57.—^Per cent which women, all of whose children survive, form of <strong>the</strong> total number of women bear<strong>in</strong>g specified<br />
number of children, by degree of mixture: <strong>1910</strong> 159<br />
Table 58.—Per cent which women, none of whose children survive, form of <strong>the</strong> total number of women bear<strong>in</strong>g specified<br />
number of children, by degree of mixture: <strong>1910</strong> 159<br />
Marital Condition 161-194<br />
All ages 161<br />
Table 59.— ^Marital condition of <strong>Indian</strong>s of all ages, for <strong>the</strong> <strong>United</strong> <strong>States</strong> <strong>and</strong> <strong>Alaska</strong>: <strong>1910</strong> 161<br />
Fifteen years of age <strong>and</strong> over<br />
Table 60.—Marital condition of <strong>Indian</strong>s 15 years of age <strong>and</strong> over, for <strong>the</strong> <strong>United</strong> <strong>States</strong> <strong>and</strong> <strong>Alaska</strong>: <strong>1910</strong> <strong>and</strong> 1900<br />
Table 61.—^Marital condition of <strong>Indian</strong>, Negro, <strong>and</strong> white <strong>population</strong> 15 years of age <strong>and</strong> over: <strong>1910</strong> ,<br />
Table 62.—Marital condition of <strong>Indian</strong>s 15 years of age <strong>and</strong> over, by pr<strong>in</strong>cipal stocks: <strong>1910</strong><br />
161<br />
161<br />
161<br />
162<br />
Polygamy among <strong>Indian</strong>s 162<br />
Age periods<br />
Table 63.—Marital condition of <strong>the</strong> <strong>Indian</strong> <strong>population</strong> accord<strong>in</strong>g to age periods, for <strong>the</strong> <strong>United</strong> <strong>States</strong> <strong>and</strong> <strong>Alaska</strong>: <strong>1910</strong>. .<br />
162<br />
" 168<br />
Table 64.—^Per cent distribution of <strong>the</strong> <strong>Indian</strong>, Negro, <strong>and</strong> white <strong>population</strong> <strong>in</strong> each age group accord<strong>in</strong>g to marital condi-<br />
tion: <strong>1910</strong>...: 163<br />
Table 65.—Marital condition of <strong>the</strong> <strong>Indian</strong> <strong>population</strong> 15 years of age <strong>and</strong> over, by divisions <strong>and</strong> states: <strong>1910</strong> 164<br />
Table 66.—Marital condition of <strong>the</strong> <strong>Indian</strong> <strong>population</strong> 15 years of age <strong>and</strong> over <strong>in</strong> <strong>the</strong> <strong>United</strong>' <strong>States</strong>, by pr<strong>in</strong>cipal stocks<br />
<strong>and</strong> tribes: <strong>1910</strong> 165<br />
Table 67..—Marital condition of <strong>the</strong> <strong>Indian</strong> <strong>population</strong> 15 years of age <strong>and</strong> over, classified by age periods, for 22 selected<br />
states: <strong>1910</strong> 168<br />
Table 68.—Marital condition of <strong>the</strong> <strong>Indian</strong> <strong>population</strong> 15 years of age <strong>and</strong> over <strong>in</strong> <strong>the</strong> <strong>United</strong> <strong>States</strong> <strong>and</strong> <strong>Alaska</strong>, classified<br />
by age periods, by pr<strong>in</strong>cipal stocks: <strong>1910</strong> 171<br />
Table 69.—Marital condition of <strong>the</strong> <strong>Indian</strong> <strong>population</strong> 15 years of age <strong>and</strong> over <strong>in</strong> <strong>the</strong> <strong>United</strong> <strong>States</strong>, classified by age<br />
periods, by pr<strong>in</strong>cipal tribes <strong>and</strong> pr<strong>in</strong>cipal states: <strong>1910</strong> 175<br />
School Attendance<br />
195-211<br />
Appropriations for <strong>Indian</strong> schools<br />
Table 70.—^Appropriations for <strong>Indian</strong> schools compared with total appropriations for <strong>Indian</strong> affairs by <strong>the</strong> National Gov-<br />
195<br />
ernment: 1877-<strong>1910</strong><br />
195<br />
Enrollment <strong>in</strong> <strong>Indian</strong> schools<br />
Table 71.—Number of <strong>Indian</strong> schools <strong>and</strong> enrollment: 1890-<strong>1910</strong><br />
Table 72.—Number of <strong>Indian</strong> schools <strong>and</strong> average attendance: 1877-1889<br />
Table 73.—Comparison of statistics of <strong>the</strong> Office of <strong>Indian</strong> Affairs <strong>and</strong> <strong>the</strong> Bureau of <strong>the</strong> Census: <strong>1910</strong><br />
195<br />
196<br />
196<br />
School attendance, 6 to 19 years<br />
Table 74.—School attendance of <strong>Indian</strong>s, by sex <strong>and</strong> age periods, for <strong>the</strong> <strong>United</strong> <strong>States</strong> <strong>and</strong> <strong>Alaska</strong>: <strong>1910</strong><br />
196<br />
197<br />
Table 75.—School attendance of <strong>Indian</strong>s, Negroes, <strong>and</strong> whites, by sex <strong>and</strong> age periods: <strong>1910</strong> 197<br />
Table 76.—School attendance of <strong>Indian</strong> <strong>population</strong> 6 to 19 years of age, for 22 selected states: <strong>1910</strong> 198<br />
Table 77.—School attendance of <strong>Indian</strong> <strong>population</strong> 6 to 19 years of age, by divisions <strong>and</strong> states: <strong>1910</strong> 199<br />
Table 78.—School attendance of <strong>Indian</strong>s 6 to 19 years of age of unknown stock or tribe: <strong>1910</strong> , 200<br />
School attendance, <strong>1910</strong> <strong>and</strong> 1900<br />
200<br />
Table 79.—School attendance of <strong>Indian</strong>s, by age periods, for <strong>the</strong> <strong>United</strong> <strong>States</strong> <strong>and</strong> <strong>Alaska</strong>: <strong>1910</strong> <strong>and</strong> 1900 200<br />
Table 80.—School attendance of <strong>Indian</strong>s 5 to 20 years of age, for 22 selected states: <strong>1910</strong> <strong>and</strong> 1900<br />
Table 81.—School attendance of <strong>Indian</strong>s 6 to 19 years of age <strong>in</strong> each pr<strong>in</strong>cipal stock, by pr<strong>in</strong>cipal tribes <strong>and</strong> pr<strong>in</strong>cipal states,<br />
200<br />
for <strong>the</strong> <strong>United</strong> <strong>States</strong> <strong>and</strong> <strong>Alaska</strong>: <strong>1910</strong><br />
Table 82.—School attendance of <strong>Indian</strong>a 6 to 19 years of age <strong>in</strong> each pr<strong>in</strong>cipal stock, by sex <strong>and</strong> age periods, for <strong>the</strong> <strong>United</strong><br />
201<br />
<strong>States</strong> <strong>and</strong> <strong>Alaska</strong>: <strong>1910</strong> - 204<br />
Table 83.—School attendance of <strong>Indian</strong>s 6 to 19 years of age, by stock, tribe, <strong>and</strong> pr<strong>in</strong>cipal states, classified by sex <strong>and</strong> age<br />
periods, for <strong>the</strong> <strong>United</strong> <strong>States</strong> <strong>and</strong> <strong>Alaska</strong>: <strong>1910</strong> 205<br />
.<br />
158<br />
195
4 CONTENTS.<br />
Page.<br />
Illtteract 212-231<br />
Illiteracy, <strong>1910</strong> <strong>and</strong> 1900 ...'.". 212<br />
Table 84.—Illiterates among <strong>Indian</strong>s 10 years of age <strong>and</strong> over compared with o<strong>the</strong>r classes of <strong>the</strong> <strong>population</strong>, for <strong>the</strong> <strong>United</strong><br />
<strong>States</strong> <strong>and</strong> <strong>Alaska</strong>: <strong>1910</strong> <strong>and</strong> 1900<br />
Illiteracy, by sex 21<br />
Table 85.—Illiterates among <strong>Indian</strong> males <strong>and</strong> females 10 years of age <strong>and</strong> over, compared with o<strong>the</strong>r classes of <strong>the</strong> popula-<br />
tion, for <strong>the</strong> <strong>United</strong> <strong>States</strong> <strong>and</strong> <strong>Alaska</strong>: <strong>1910</strong> <strong>and</strong> 1900<br />
Table 86.—Illiterates among <strong>Indian</strong>s 10 years of age <strong>and</strong> over, by sex <strong>and</strong> age, for <strong>the</strong> <strong>United</strong> <strong>States</strong> <strong>and</strong> <strong>Alaska</strong>: <strong>1910</strong> <strong>and</strong><br />
1900<br />
lUiteracy, by states 213<br />
Table 87.—Illiterates among <strong>Indian</strong>s 10 years of age <strong>and</strong> over, 10 to 19 years of age, <strong>and</strong> 20 years of age <strong>and</strong> over, respec-<br />
tively, <strong>in</strong> 22 selected states: <strong>1910</strong> <strong>and</strong> 1900 214<br />
Table 88.—Illiterates among <strong>Indian</strong> males <strong>and</strong> females 10 years of age <strong>and</strong> over, 10 to 19 years of age, <strong>and</strong> 20 years of age <strong>and</strong><br />
over, respectively, <strong>in</strong> 22 selected states: <strong>1910</strong> 214<br />
Table 89.—Illiterate <strong>Indian</strong> males <strong>and</strong> females 10 years of age <strong>and</strong> over, classified by age periods, by divisions <strong>and</strong> states:<br />
<strong>1910</strong> 215<br />
Illiteracy, by stocks <strong>and</strong> tribes 216<br />
Table 90.—Illiterates among <strong>Indian</strong> males <strong>and</strong> females 10 years of age <strong>and</strong> over, 10 to 19 years of age, <strong>and</strong> 20 years of age <strong>and</strong><br />
over, respectively, by pr<strong>in</strong>cipal stocks: <strong>1910</strong> 216<br />
Table 91.— ^Illiterates among <strong>Indian</strong>s 10 years of age <strong>and</strong> over of unknown stock or tribe, by age periods: <strong>1910</strong> 217<br />
Table 92.—Illiterate <strong>Indian</strong> males <strong>and</strong> females 10 years of age <strong>and</strong> over, classified by age periods, by stocks, pr<strong>in</strong>cipal tribes,<br />
<strong>and</strong> pr<strong>in</strong>cipal states: <strong>1910</strong> 219<br />
Table 93.—Illiterates among <strong>Indian</strong>s 10 years of age <strong>and</strong> over, classified by sex, <strong>and</strong> among <strong>Indian</strong>a 10 to 19 years of age <strong>and</strong><br />
20 years of age <strong>and</strong> over, respectively, for each pr<strong>in</strong>cipal stock, by pr<strong>in</strong>cipal tribes <strong>and</strong> by pr<strong>in</strong>cipal states:<br />
<strong>1910</strong> 226<br />
Inabilitt to Speak Engush 232-249<br />
Inability to speak English, <strong>1910</strong> <strong>and</strong> 1900 232<br />
Table 94.—<strong>Indian</strong>s 10 years of age <strong>and</strong> over unable to speak English, by sex <strong>and</strong> age periods, for <strong>the</strong> <strong>United</strong> <strong>States</strong> <strong>and</strong><br />
<strong>Alaska</strong>: <strong>1910</strong> <strong>and</strong> 1900 232<br />
Inability to speak English, by states 232<br />
Table 95.—<strong>Indian</strong> males <strong>and</strong> females 10 years of age <strong>and</strong> over unable to speak English, for 22 selected states: <strong>1910</strong> <strong>and</strong> 1900. . 232<br />
Table 96.—<strong>Indian</strong> males <strong>and</strong> females 10 to 19 years of age <strong>and</strong> 20 years of age <strong>and</strong> over, respectively, unable to speak English,<br />
for 22 selected states: <strong>1910</strong> 233<br />
Inability to speak English, by stocks <strong>and</strong> tribes 233<br />
Table 97.—<strong>Indian</strong> males <strong>and</strong> females 10 years of age <strong>and</strong> over, 10 to 19 years of age, <strong>and</strong> 20 years of age <strong>and</strong> over, respec-<br />
tively, imable to speak English, by pr<strong>in</strong>cipal stocks: <strong>1910</strong> 234<br />
Table 98.—<strong>Indian</strong> males <strong>and</strong> females 10 years of age <strong>and</strong> over unable to speak English, classified by age periods, by divi-<br />
sions <strong>and</strong> states: <strong>1910</strong> <strong>and</strong> 1900 236<br />
Table 99.—<strong>Indian</strong> males <strong>and</strong> females 10 years of age <strong>and</strong> over unable to speak EngHsh, classified by age periods, by stocks,<br />
pr<strong>in</strong>cipal tribes, <strong>and</strong> pr<strong>in</strong>cipal states: <strong>1910</strong><br />
Table 100.—<strong>Indian</strong>s 10 years of age <strong>and</strong> over, classified by sex, <strong>and</strong> <strong>Indian</strong>s 10 to 19 years of age <strong>and</strong> 20 years of age <strong>and</strong><br />
237<br />
over, respectively, unable to speak English, for each pr<strong>in</strong>cipal stock, by pr<strong>in</strong>cipal tribes <strong>and</strong> by pr<strong>in</strong>cipal<br />
states: <strong>1910</strong> 244<br />
OoouPATioNs 250-282<br />
Sufficiency of <strong>the</strong> occupation returns 250<br />
Number <strong>and</strong> proportion occupied 250<br />
Table 101.—Number of <strong>Indian</strong>s engaged <strong>in</strong> ga<strong>in</strong>ful occupations compared with <strong>the</strong> total number of <strong>Indian</strong>s <strong>and</strong> with <strong>Indian</strong>s<br />
10 years of age <strong>and</strong> over, by sex, for <strong>the</strong> <strong>United</strong> <strong>States</strong> <strong>and</strong> <strong>Alaska</strong>: <strong>1910</strong> <strong>and</strong> 1900 250<br />
Table 102.— ^Number <strong>and</strong> proportion of <strong>Indian</strong>s of each sex 10 years of age <strong>and</strong> over engaged <strong>in</strong> ga<strong>in</strong>ful occupations, for 22<br />
selected states: <strong>1910</strong> 251<br />
Table 103.—^Number <strong>and</strong> proportion of <strong>Indian</strong>s of each sex 10 years of age <strong>and</strong> over engaged <strong>in</strong> ga<strong>in</strong>ful occupations, for<br />
pr<strong>in</strong>cipal stocks <strong>and</strong> tribes: <strong>1910</strong> 253<br />
Number <strong>and</strong> proportion <strong>in</strong> <strong>the</strong> general divisions of occupations 255<br />
Table 104.—^Distribution by general divisions of occupations of <strong>Indian</strong>s 10 years of age <strong>and</strong> over engaged <strong>in</strong> ga<strong>in</strong>ful occupa-<br />
tions, by sex: <strong>1910</strong> 255<br />
Occupations, by sex 255<br />
Table 105.—Number of <strong>Indian</strong>s 10 years of age <strong>and</strong> over engaged <strong>in</strong> ga<strong>in</strong>ful occupations, classified by sex: <strong>1910</strong> 256<br />
Table 106.—Occupations of <strong>Indian</strong> males <strong>and</strong> females <strong>in</strong> <strong>the</strong> <strong>United</strong> <strong>States</strong> 10 years of age <strong>and</strong> over enumerated on <strong>the</strong><br />
general <strong>population</strong> schedule, of unknown stock or tribe: <strong>1910</strong> 258<br />
Selected occupations, by sex <strong>and</strong> age periods<br />
258<br />
Table 107.—Number <strong>and</strong> proportion of <strong>Indian</strong>s of each sex engaged <strong>in</strong> ga<strong>in</strong>ful occupations, by age periods, for <strong>the</strong> <strong>United</strong><br />
<strong>States</strong> <strong>and</strong> <strong>Alaska</strong>: <strong>1910</strong> 259<br />
Table 108.—Number of <strong>Indian</strong> males <strong>and</strong> females engaged <strong>in</strong> specified occupations, classified by age periods: <strong>1910</strong> 259<br />
Table 109.—Number of <strong>Indian</strong> males <strong>and</strong> females <strong>in</strong> each pr<strong>in</strong>cipal tribe <strong>and</strong> pr<strong>in</strong>cipal state engaged <strong>in</strong> selected occupations<br />
classified by age periods: <strong>1910</strong> 262<br />
<strong>Indian</strong>s Taxed <strong>and</strong> Not Taxed 283-285<br />
Table 110.—<strong>Indian</strong> <strong>population</strong>, classified as taxed <strong>and</strong> not taxed, by divisions <strong>and</strong> states: <strong>1910</strong>, 1900, <strong>and</strong> 1890 284<br />
2<br />
212<br />
212<br />
213
CONTENTS.<br />
MAPS AND DIAGRAMS.<br />
MAPS.<br />
L<strong>in</strong>guistic families of American <strong>Indian</strong>s north of Mexico Opposite 9<br />
Distribntion of <strong>the</strong> <strong>Indian</strong> <strong>population</strong> of <strong>the</strong> <strong>United</strong> <strong>States</strong>: <strong>1910</strong> 9<br />
Nimiber of <strong>Indian</strong>s per 10,000 of total <strong>population</strong>: <strong>1910</strong> : 13<br />
Number of <strong>Indian</strong>s per 10,000 of total <strong>population</strong>: 1890 13<br />
Number of <strong>Indian</strong>s per 100 square miles (l<strong>and</strong> area): <strong>1910</strong> 14<br />
Proportion of full-bloods iu <strong>the</strong> <strong>Indian</strong> <strong>population</strong> of <strong>the</strong> <strong>United</strong> <strong>States</strong> : <strong>1910</strong> 31<br />
Proportion of <strong>Indian</strong>s of full-tribal blood of total full-blood <strong>Indian</strong>s: <strong>1910</strong> 38<br />
Excess of males or females <strong>in</strong> <strong>the</strong> <strong>Indian</strong> <strong>population</strong>: <strong>1910</strong> 43<br />
Excess of males or females <strong>in</strong> <strong>the</strong> <strong>Indian</strong> <strong>population</strong> : 1890 43<br />
Excess of males or females among <strong>Indian</strong>s of fuU blood: <strong>1910</strong> 46<br />
Excess of males or females among <strong>Indian</strong>s of mixed blood: <strong>1910</strong> 46<br />
Excess of males or females among <strong>Indian</strong>s of full-tribal blood: <strong>1910</strong> 50<br />
Excess of males or females among <strong>Indian</strong>s of mixed-tribal blood: <strong>1910</strong> 50<br />
Proportion of <strong>Indian</strong>s under 20 years of age: <strong>1910</strong> - 53<br />
Proportion of <strong>Indian</strong>s 20 to 50 years of age: <strong>1910</strong> 54<br />
Proportion of <strong>Indian</strong>s 51 years of age <strong>and</strong> over: <strong>1910</strong><br />
".<br />
54<br />
Excess of males or females among <strong>Indian</strong>s under 20 years of age: <strong>1910</strong> 64<br />
Excess of males or females among <strong>Indian</strong>s 20 to 50 years of age: <strong>1910</strong> 64<br />
Excess of males or females among <strong>Indian</strong>s 51 years of age <strong>and</strong> over: <strong>1910</strong> 64<br />
Proportion of <strong>Indian</strong>s 6 to 19 years of age attend<strong>in</strong>g school: <strong>1910</strong> 198<br />
Proportion of <strong>Indian</strong>s taxed : <strong>1910</strong> 285<br />
Proportion of <strong>Indian</strong>s taxed : 1890 285<br />
DIAGRAMS.<br />
<strong>Indian</strong> <strong>population</strong> of 22 selected states: <strong>1910</strong> : 12<br />
Proportion of full-blood <strong>and</strong> mixed-blood <strong>Indian</strong>s, <strong>and</strong> of <strong>Indian</strong>s of fuU-tribal blood, <strong>in</strong> each pr<strong>in</strong>cipal tribe: <strong>1910</strong> 40<br />
Age distribution of <strong>Indian</strong>s <strong>in</strong> each pr<strong>in</strong>cipal tribe: <strong>1910</strong> 54<br />
Percentage of school attendance among <strong>Indian</strong>s 6 to 19 years of age <strong>in</strong> each pr<strong>in</strong>cipal tribe: <strong>1910</strong> 198<br />
Percentage of illiterates among <strong>Indian</strong>s 10 to 19 years of age <strong>and</strong> 20 years of age <strong>and</strong> over, <strong>in</strong> 22 selected states: <strong>1910</strong> 213<br />
Percentage of illiterates among <strong>Indian</strong>s 10 to 19 years of age <strong>and</strong> 20 years of age <strong>and</strong> over, <strong>in</strong> each pr<strong>in</strong>cipal tribe: <strong>1910</strong> 218<br />
Per cent unable to speak EngUsh among <strong>Indian</strong>s 10 to 19 years of age <strong>and</strong> 20 years of age <strong>and</strong> over, <strong>in</strong> each pr<strong>in</strong>cipal tribe: <strong>1910</strong> .<br />
Percentage of <strong>Indian</strong> males <strong>and</strong> females 10 years of age <strong>and</strong> over engaged <strong>in</strong> ga<strong>in</strong>ful occupations, <strong>in</strong> each pr<strong>in</strong>cipal tribe: <strong>1910</strong> 252<br />
.<br />
235
Sik:<br />
LETTER OF TRANSMITTAL.<br />
DEPARTMENT OF COMMERCE,<br />
Bureau of <strong>the</strong> Census,<br />
Wash<strong>in</strong>gton, D. C, June 1, 1915.<br />
I liave <strong>the</strong> honor to transmit herewith a report on <strong>the</strong> <strong>Indian</strong> <strong>population</strong>, of <strong>the</strong> <strong>United</strong> <strong>States</strong> <strong>and</strong> <strong>Alaska</strong><br />
<strong>in</strong> <strong>1910</strong>. This report furnishes detailed statistics <strong>and</strong>, wherever possible, comparatiTe data concern<strong>in</strong>g <strong>Indian</strong>s,<br />
<strong>the</strong> <strong>in</strong>formation for <strong>1910</strong> be<strong>in</strong>g derived <strong>in</strong> part from <strong>the</strong> returns made on <strong>the</strong> general <strong>population</strong> schedule <strong>and</strong><br />
<strong>in</strong> part from <strong>in</strong>quiries made on a special schedule as to stock <strong>and</strong> tribe <strong>and</strong> purity of blood. This special<br />
report on <strong>Indian</strong>s covers <strong>the</strong> follow<strong>in</strong>g topics: Population; proportion of mixed-bloods; sex distribution; age<br />
distribution; stocks <strong>and</strong> tribes, <strong>in</strong> detail by purity of blood, tribal mixture, sex, <strong>and</strong> age; fecundity <strong>and</strong> vitaUty;<br />
marital condition; school attendance; illiteracy; <strong>in</strong>ability to speak Enghsh; occupations; <strong>and</strong> <strong>Indian</strong>s taxed<br />
<strong>and</strong> not taxed.<br />
The report was prepared under <strong>the</strong> supervision of William C. Hunt, chief statistician for <strong>population</strong>. The<br />
text <strong>and</strong> tables for <strong>the</strong> first six topics named were prepared by Dr. Rol<strong>and</strong> B. Dixon, expert special agent,<br />
<strong>and</strong> <strong>the</strong> work was completed <strong>in</strong> March, 1912, <strong>and</strong> a bullet<strong>in</strong> based <strong>the</strong>reon, givmg <strong>the</strong> distribution of <strong>the</strong> <strong>Indian</strong><br />
<strong>population</strong> accord<strong>in</strong>g to stock, tribe, blood, sex, age, <strong>and</strong> fecundity <strong>and</strong> vitality, was issued June 26,. 1913.<br />
The text <strong>and</strong> tables for <strong>the</strong> rema<strong>in</strong><strong>in</strong>g topics were prepared by Dr. F. A. McKenzie, expert special agent, but<br />
work on <strong>the</strong>se sections of <strong>the</strong> report was discont<strong>in</strong>ued <strong>in</strong> February, 1912, because of <strong>the</strong> large reduction <strong>in</strong> <strong>the</strong><br />
Thirteenth Census temporary force, <strong>and</strong> was not resumed until May, 1914. The tabulations (except for<br />
occupations) were substantially completed prior to <strong>the</strong> suspension of <strong>the</strong> work <strong>in</strong> February, 1912, <strong>and</strong> <strong>the</strong><br />
more recent work <strong>in</strong> 1914 consisted largely of <strong>the</strong> exam<strong>in</strong>ation <strong>and</strong> verification of <strong>the</strong> tabulated results <strong>and</strong><br />
<strong>the</strong> preparation of <strong>the</strong> general tables <strong>and</strong> textual matter. The completion of <strong>the</strong> entire report has necessarily<br />
been considerably delayed, but <strong>the</strong> statistics presented have a permanent historical value, as it is not likely<br />
that ano<strong>the</strong>r effort wiU be made to secure through <strong>the</strong> census special data regard<strong>in</strong>g <strong>Indian</strong>s as a separate <strong>and</strong><br />
dist<strong>in</strong>ct element of <strong>the</strong> <strong>population</strong>.<br />
Respectfully,<br />
To Hon, William C. Redfield,<br />
Secretary of Commerce.<br />
fm,^> fn<br />
Director of <strong>the</strong> Census.<br />
(7)
1(1(1 ,11 2I> O OSTArUTE MILES<br />
AJFoen A Co.Lith-Ba7rrjnom,Mcl.
This report gives <strong>the</strong> pr<strong>in</strong>cipal statistics relat<strong>in</strong>g to<br />
<strong>the</strong> <strong>Indian</strong> <strong>population</strong> of <strong>the</strong> <strong>United</strong> <strong>States</strong> <strong>and</strong> of<br />
<strong>Alaska</strong> collected at <strong>the</strong> Thirteenth Decennial Census,<br />
taken <strong>in</strong> <strong>1910</strong>.<br />
The statistics of <strong>Indian</strong>s were ga<strong>the</strong>red <strong>in</strong> part by<br />
means of <strong>the</strong> general <strong>population</strong> schedule <strong>and</strong> <strong>in</strong> part<br />
by means of a special schedule contaia<strong>in</strong>g, <strong>in</strong> addition<br />
to <strong>the</strong> questions found on <strong>the</strong> general schedule, iaqui-<br />
ries as to tribe <strong>and</strong> purity of blood. The special<br />
schedules were used <strong>in</strong> all <strong>the</strong> districts conta<strong>in</strong><strong>in</strong>g<br />
<strong>Indian</strong>s on reservations <strong>and</strong> throughout counties where<br />
as many as 20 <strong>Indian</strong>s were returned at <strong>the</strong> census<br />
of 1900.<br />
Special agents, most of whom had had some experience<br />
<strong>in</strong> <strong>the</strong> service of <strong>the</strong> Office of <strong>Indian</strong> Affairs, were<br />
appo<strong>in</strong>ted for <strong>the</strong> collection of statistics by means of<br />
<strong>the</strong> special schedule. In <strong>the</strong> conduct of <strong>the</strong> field work<br />
<strong>and</strong> <strong>in</strong> <strong>the</strong> preparation of schedules, <strong>the</strong> Bureau of <strong>the</strong><br />
Census was effectively aided by <strong>the</strong> Office of <strong>Indian</strong><br />
Affairs <strong>and</strong> <strong>the</strong> Bureau of American Ethnology.<br />
At <strong>the</strong> Thirteenth Census <strong>the</strong> general enumeration<br />
of <strong>population</strong>, <strong>in</strong>clud<strong>in</strong>g <strong>Indian</strong>s, <strong>in</strong> <strong>the</strong> <strong>United</strong> <strong>States</strong><br />
pjfoper was made as of April 15, <strong>1910</strong>, but <strong>in</strong> <strong>Alaska</strong><br />
INDIAN POPULATION.<br />
INTRODUCTION.<br />
<strong>the</strong> date of enumeration generally was December 31,<br />
1909, or a time as near that date as was permitted by<br />
chmatic considerations, <strong>the</strong> <strong>in</strong>accessibility of certa<strong>in</strong><br />
regions, <strong>and</strong> <strong>the</strong> vary<strong>in</strong>g conditions aris<strong>in</strong>g from <strong>the</strong><br />
wide dispersion of a small <strong>population</strong> over a large area;<br />
<strong>in</strong> fact, <strong>in</strong> some localities, where it was impracticable to<br />
undertake <strong>the</strong> field work on or immediately follow<strong>in</strong>g<br />
December 31, <strong>the</strong> enumeration was begun prior to<br />
that date, while <strong>in</strong> o<strong>the</strong>rs it was deferred until late <strong>in</strong><br />
w<strong>in</strong>ter or until early spr<strong>in</strong>g.<br />
The topics covered by this special report on <strong>Indian</strong>s<br />
are 12 <strong>in</strong> number, namely, <strong>population</strong>; proportion of<br />
mixed-bloods; sex distribution; age distribution; stocks<br />
<strong>and</strong> tribes, <strong>in</strong> detail by purity of blood, tribal mixture,<br />
sex, <strong>and</strong> age; fecimdity <strong>and</strong> vitahty; marital condition;<br />
school attendance; iUiteracy; <strong>in</strong>ability to speak English;<br />
occupations; <strong>and</strong> <strong>Indian</strong>s taxed <strong>and</strong> not taxed.<br />
Inquiries were also made on <strong>the</strong> special <strong>Indian</strong> sched-<br />
ule as to graduation from educational <strong>in</strong>stitutions, al-<br />
lotments, residence on own l<strong>and</strong>s, <strong>and</strong> whe<strong>the</strong>r liv<strong>in</strong>g<br />
<strong>in</strong> civilized or aborig<strong>in</strong>al dwell<strong>in</strong>gs, but <strong>the</strong> answers<br />
were so deficient or manifestly <strong>in</strong>accurate as to render<br />
<strong>the</strong> results of Httle or no value.<br />
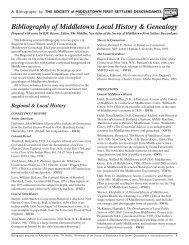
DISTRIBUTION OF THE INDIAN POPULATION OF THE UNITED STATES: <strong>1910</strong>.<br />
(In <strong>the</strong> case of Kansas <strong>and</strong> Pennsylvania tbs base figures are exclusive of <strong>Indian</strong>s <strong>in</strong> Haskell Institute <strong>and</strong> Carlisle <strong>Indian</strong> School, lespectively.]
Comparative statistics.—The total number of <strong>Indian</strong>s<br />
<strong>in</strong> <strong>the</strong> <strong>United</strong> <strong>States</strong>, exclusive of outly<strong>in</strong>g possessions,<br />
<strong>in</strong> <strong>1910</strong> was 265,683,' <strong>and</strong> <strong>in</strong> <strong>Alaska</strong> 25,331. Table 1<br />
presents <strong>the</strong> census figures for <strong>the</strong> <strong>United</strong> <strong>States</strong> <strong>and</strong><br />
Table 1<br />
YEAE.<br />
POPULATION.<br />
for <strong>Alaska</strong> separately for <strong>1910</strong> <strong>and</strong> earlier years, to-<br />
ge<strong>the</strong>r with figures for <strong>the</strong> <strong>United</strong> <strong>States</strong> (exclusive of<br />
<strong>Alaska</strong>) derived from <strong>the</strong> reports of <strong>the</strong> Commissioner<br />
of <strong>Indian</strong> Affairs.
Mexico, which <strong>in</strong> 1890 <strong>and</strong> 1900 was fifth, came third <strong>in</strong><br />
<strong>1910</strong>, hav<strong>in</strong>g replaced South Dakota, which <strong>in</strong> <strong>1910</strong> was<br />
<strong>in</strong> fourth place. Cahfornia, which formerly stood<br />
fourth, was fifth <strong>in</strong> <strong>1910</strong>, <strong>and</strong> Montana <strong>and</strong> Wash<strong>in</strong>gton,<br />
formerly sixth <strong>and</strong> seventh, had changed places <strong>in</strong> <strong>1910</strong>.<br />
M<strong>in</strong>nesota <strong>and</strong> Wiscons<strong>in</strong>, formerly eighth <strong>and</strong> n<strong>in</strong>th,<br />
also changed places <strong>in</strong> <strong>1910</strong>, <strong>and</strong> North Carol<strong>in</strong>a,<br />
which was twelfth <strong>in</strong> 1900, was tenth <strong>in</strong> <strong>1910</strong>, hav<strong>in</strong>g<br />
replaced North Dakota, which dropped 'to twelfth<br />
place, Michigan com<strong>in</strong>g eleventh <strong>in</strong> <strong>1910</strong>.<br />
Table Z<br />
<strong>United</strong> <strong>States</strong>..<br />
GEOGEAPmO DmsiONS:<br />
New Engl<strong>and</strong><br />
Middle Atlantic<br />
East North Central.<br />
West North Central.<br />
South Atlantic<br />
East South Central.<br />
.<br />
West South Central..<br />
Mounta<strong>in</strong><br />
Pacific<br />
DIVISION AND STATE.<br />
New Engl<strong>and</strong>:<br />
Ma<strong>in</strong>e<br />
New Hampshire<br />
Vermont<br />
Massachusetts<br />
Rhode Isl<strong>and</strong><br />
Connecticut<br />
Middle Atlantic:<br />
New York<br />
New Jersey<br />
Pennsylvania<br />
East North Centbal:<br />
Ohio<br />
<strong>Indian</strong>a<br />
Bl<strong>in</strong>ois<br />
Michigan<br />
Wiscons<strong>in</strong><br />
West North Central:<br />
M<strong>in</strong>nesota<br />
Iowa.-<br />
Missouri<br />
North Dakota<br />
South Dakota<br />
Nebraska<br />
South Atlantic:<br />
Delaware<br />
Maryl<strong>and</strong><br />
District of Columbia.<br />
Virg<strong>in</strong>ia<br />
West Virg<strong>in</strong>ia<br />
North Carol<strong>in</strong>a<br />
South Carol<strong>in</strong>a<br />
Georgia<br />
Florida<br />
East South Central:<br />
Kentucky<br />
Tennessee<br />
Alabama<br />
West South Central:<br />
Arkansas<br />
Louisiana<br />
Oklahoma ><br />
Texas<br />
Mounta<strong>in</strong>:<br />
Montana<br />
Idaho<br />
Wyom<strong>in</strong>g<br />
Colorado.'.<br />
New Mexico<br />
Arizona<br />
Utah<br />
Nevada.<br />
Pacific:<br />
Wash<strong>in</strong>gton<br />
Oregon<br />
California<br />
INDIAN <strong>population</strong>.<br />
<strong>1910</strong> 1900 1890<br />
265,683<br />
2,076<br />
7,717<br />
lg,25S<br />
41,406<br />
9,054<br />
2,612<br />
76,767<br />
76,338<br />
32,458<br />
892<br />
34,<br />
1S2<br />
6,046<br />
168<br />
1,563<br />
127<br />
279<br />
188<br />
7,519<br />
10, 142<br />
9,053<br />
471<br />
313<br />
6,486<br />
19, 137<br />
3,502<br />
2,444<br />
5<br />
55<br />
68<br />
539<br />
36<br />
7,851<br />
331<br />
95<br />
74<br />
234<br />
216<br />
909<br />
1,253<br />
460<br />
780<br />
74,825<br />
702<br />
10,745<br />
3,488<br />
1,486<br />
1,482<br />
20,573<br />
29,201<br />
3,123<br />
5,240<br />
10,997<br />
5,090<br />
16,371<br />
237,196<br />
1,600<br />
6,959<br />
16,027<br />
42,339<br />
6,685<br />
2,590<br />
65,674<br />
66, 155<br />
30,367<br />
POPULATION. 11<br />
798<br />
22<br />
5<br />
687<br />
35<br />
163<br />
6,257<br />
63<br />
1,639<br />
42<br />
243<br />
16<br />
6,354<br />
8,372<br />
9,182<br />
382<br />
130<br />
6,968<br />
20,226<br />
3,322<br />
2,130<br />
22<br />
354<br />
12<br />
5,687<br />
121<br />
19<br />
358<br />
102<br />
108<br />
177<br />
2,203<br />
593<br />
64,445<br />
470<br />
11,343<br />
4,226<br />
1,686<br />
1,437<br />
13, 144<br />
26, 480<br />
2,623<br />
5,216<br />
10,039<br />
4,951<br />
15,377<br />
1 Includes <strong>Indian</strong> <strong>population</strong> of <strong>Indian</strong> Territory for 1900 <strong>and</strong> 1890.<br />
248,253<br />
1,445<br />
7,209<br />
16,202<br />
46,822<br />
2,369<br />
3,396<br />
66,042<br />
72,002<br />
32,776<br />
559<br />
16<br />
34<br />
428<br />
180<br />
228<br />
6,044<br />
84<br />
1,081<br />
206<br />
6,625<br />
9,930<br />
10,096<br />
457<br />
128<br />
8,174<br />
19,854<br />
6,431<br />
1,682<br />
4<br />
44<br />
25<br />
349<br />
9<br />
1,516<br />
173<br />
68<br />
171<br />
71<br />
146<br />
1,143<br />
2,036<br />
250<br />
628<br />
64,456<br />
708<br />
11,206<br />
4,223<br />
1,844<br />
1,092<br />
15,044<br />
29,981<br />
3,466<br />
6,156<br />
11,181<br />
4,971<br />
16,624<br />
Of <strong>the</strong> 265,683 <strong>Indian</strong>s <strong>in</strong> <strong>the</strong> <strong>United</strong> <strong>States</strong> <strong>in</strong><br />
<strong>1910</strong> <strong>the</strong>re were 247,137 <strong>Indian</strong>s for whom special<br />
schedules conta<strong>in</strong><strong>in</strong>g data as to tribe <strong>and</strong> purity of<br />
blood were obta<strong>in</strong>ed, <strong>and</strong> 18,546 scattered <strong>Indian</strong>s<br />
enumerated on <strong>the</strong> general <strong>population</strong> schedule only.<br />
Table 3 shows this distribution by states.<br />
Table 3<br />
<strong>United</strong> <strong>States</strong> .<br />
division <strong>and</strong> state.<br />
GEOQRAPmc divisions:<br />
New Engl<strong>and</strong><br />
Middle Atlantic<br />
East North Central..<br />
West North Central.<br />
South Atlantic<br />
East South Central.<br />
West South Central.<br />
Mounta<strong>in</strong><br />
PactBc<br />
. .<br />
New Engl<strong>and</strong>:<br />
Ma<strong>in</strong>e<br />
New Hampshire<br />
Vermont<br />
Massachusetts<br />
Rhode Isl<strong>and</strong><br />
Connecticut<br />
Middle Atlantic:<br />
New York<br />
New Jersey<br />
Pennsylvania<br />
East North Central:<br />
Ohio<br />
<strong>Indian</strong>a<br />
Ill<strong>in</strong>ois<br />
Michigan<br />
Wiscons<strong>in</strong><br />
West North Central:<br />
M<strong>in</strong>nesota<br />
Iowa<br />
Missouri<br />
North Dakota<br />
South Dakota<br />
Nebraska<br />
Kansas<br />
South Atlantic:<br />
Delaware<br />
Maryl<strong>and</strong><br />
District olColumbia .<br />
Virg<strong>in</strong>ia<br />
West Virg<strong>in</strong>ia<br />
North Carol<strong>in</strong>a<br />
South Carol<strong>in</strong>a<br />
Georgia<br />
Florida<br />
East South Central:<br />
Kentucky<br />
Tennessee<br />
Alabama<br />
Mississippi<br />
West South Central:<br />
Arkansas<br />
Louisiana<br />
Oklahoma<br />
Texas<br />
Mounta<strong>in</strong>:<br />
Montana<br />
Idaho.<br />
Wyom<strong>in</strong>g,<br />
Colorado<br />
lolor<br />
New Mexico.<br />
Arizona<br />
Utah<br />
Nevada<br />
Pacific:<br />
Wash<strong>in</strong>gton.<br />
Oregon<br />
California<br />
.<br />
.<br />
number of <strong>in</strong>du.ns<br />
enumerated: <strong>1910</strong>.<br />
Total.<br />
265,683<br />
2,076<br />
7,717<br />
18,266<br />
41,406<br />
9,064<br />
2,612<br />
76,767<br />
76,338<br />
32, 458<br />
34<br />
284<br />
152<br />
6,046<br />
1168<br />
2 1,603<br />
127<br />
279<br />
188<br />
7,519<br />
10,142<br />
9,053<br />
471<br />
313<br />
6,486<br />
19,137<br />
3,602<br />
8 2,444<br />
5<br />
66<br />
68<br />
539<br />
36<br />
7,851<br />
331<br />
96<br />
74<br />
234<br />
216<br />
909<br />
1,253<br />
460<br />
780<br />
74,826<br />
702<br />
10,745<br />
3,488<br />
1,486<br />
1,482<br />
20,573<br />
29,201<br />
3,123<br />
6,240<br />
10,997<br />
6,090<br />
16,371<br />
On<br />
On general<br />
special popula-<br />
<strong>Indian</strong> tion<br />
schedules. schedule<br />
only.<br />
247,137<br />
1,320<br />
6,392<br />
16,502<br />
39,435<br />
7,870<br />
1,488<br />
71,630<br />
73,074<br />
29,426<br />
806<br />
3<br />
433<br />
"78<br />
5,209<br />
162<br />
2 1,121<br />
40<br />
95<br />
9<br />
6,761<br />
9,597<br />
8,756<br />
302<br />
71<br />
6,168<br />
18,822<br />
3,312<br />
• 2,004<br />
13<br />
7,287<br />
188<br />
20<br />
61<br />
251<br />
1,176<br />
423<br />
70,774<br />
433<br />
10,394<br />
3,426<br />
1,468<br />
769<br />
20,279<br />
28,748<br />
3,061<br />
4,949<br />
9,862<br />
4,580<br />
14,994<br />
1 Includes 62 <strong>Indian</strong>s with Wild West Show.<br />
" Includes 1,010 <strong>Indian</strong>s emimerated <strong>in</strong> Carlisle <strong>Indian</strong> School.<br />
' Includes 591 <strong>Indian</strong>s enumerated <strong>in</strong> Saskell Institute.<br />
18,546<br />
766<br />
1,326<br />
1,763<br />
1,971<br />
1,184<br />
1,124<br />
5,137<br />
2,264<br />
31<br />
26<br />
265<br />
284<br />
74<br />
837<br />
106<br />
382<br />
87<br />
184<br />
179<br />
758<br />
545<br />
297<br />
169<br />
242<br />
318<br />
316<br />
190<br />
440<br />
5<br />
65<br />
66<br />
177<br />
36<br />
564<br />
143<br />
95<br />
54<br />
155<br />
658<br />
77<br />
460<br />
357<br />
4,051<br />
361<br />
62<br />
28<br />
713<br />
294<br />
453<br />
72<br />
291<br />
1,146<br />
610<br />
1,377<br />
The number of <strong>Indian</strong>s <strong>in</strong> <strong>1910</strong> is shown for each<br />
of <strong>the</strong> 22 states hav<strong>in</strong>g an <strong>Indian</strong> <strong>population</strong> of 1,000<br />
or over, <strong>and</strong> for "All o<strong>the</strong>r states" comb<strong>in</strong>ed, <strong>in</strong> Table<br />
4. This is also shown graphically for <strong>the</strong> same states<br />
<strong>in</strong> <strong>the</strong> diagram accompany<strong>in</strong>g <strong>the</strong> table. The distri-<br />
bution of <strong>the</strong> <strong>Indian</strong> <strong>population</strong> of <strong>the</strong> <strong>United</strong> <strong>States</strong><br />
is shown graphically <strong>in</strong> <strong>the</strong> map on page 9.
12 INDIANS IN THE UNITED STATES.<br />
Table 4<br />
<strong>United</strong> <strong>States</strong>.<br />
Oklahoma<br />
Aricona<br />
New Mexico<br />
South Dakota..<br />
Califomia<br />
Wash<strong>in</strong>gton<br />
Montana<br />
Wiscons<strong>in</strong><br />
M<strong>in</strong>nesota<br />
North Carol<strong>in</strong>a.<br />
Michigan..,<br />
North Dakota..<br />
New York<br />
Nevada<br />
Oregon<br />
Nebraska<br />
Idkho<br />
Utah<br />
Kansas<br />
Wyom<strong>in</strong>g<br />
Colorado<br />
Mississippi<br />
Total lor 22 states.,<br />
All o<strong>the</strong>r states<br />
Number of<br />
<strong>Indian</strong>s:<br />
<strong>1910</strong>.
10,000 of <strong>the</strong> total <strong>population</strong> decreas<strong>in</strong>g from 9,871.4<br />
<strong>in</strong> 1880 to 3,936.1 <strong>in</strong> <strong>1910</strong>. Thus, while <strong>in</strong> 1880 almost<br />
<strong>the</strong> entire <strong>population</strong> of <strong>Alaska</strong> consisted of <strong>Indian</strong>s,<br />
<strong>in</strong> <strong>1910</strong> <strong>the</strong>y formed only about two-fifths of all <strong>the</strong><br />
<strong>in</strong>habitants.<br />
Table 5<br />
POPULATION. 13
14 INDIANS IN THE UNITED STATES.<br />
<strong>Indian</strong>s per 100 square miles.—For <strong>the</strong> <strong>United</strong> <strong>States</strong>,<br />
<strong>in</strong> <strong>1910</strong>, <strong>the</strong> number of <strong>Indian</strong>s per 100 square miles<br />
was 8.9. In Table 7 <strong>the</strong> number of <strong>Indian</strong>s per 100<br />
square miles <strong>in</strong> <strong>1910</strong> is shown for <strong>the</strong> 22 selected<br />
states, arranged <strong>in</strong> <strong>the</strong>ir order of density.<br />
Table 7
POPULATION. 15<br />
NUMBER OP INDIANS REPORTED ON SPECIAL INDIAN SCHEDULE, CLASSIFIED BY LINGUISTIC STOCKS AND<br />
TRIBES: <strong>1910</strong>.<br />
Table 8<br />
LINQTJISTIC STOCK AND TRIBE. Namber. MNSUISTIC STOCK ANDTKIBE. Number. LINGUISTIC STOCK AND TRIBE. Number. LINQUISTIC STOCK AND TRIBE. Number.<br />
Total.<br />
ALQONQUIAN STOCK .<br />
Abnakl<br />
Arapabo<br />
Blackfeet (syn. Slksika).<br />
Bro<strong>the</strong>rton<br />
Cheyanne<br />
Chickabomlny<br />
Chippewa (syn.Ojibway),<br />
Cree...<br />
Delaware<br />
Gros Ventres (syn. Ats<strong>in</strong>a)<br />
Kickapoo<br />
Malecite<br />
Mashpee<br />
Mattapony<br />
Menom<strong>in</strong>ee<br />
Miami<br />
Micmao<br />
Mohegan<br />
Montauk<br />
Munsee<br />
Narra^anset<br />
Niantic<br />
Ottawa<br />
Famunkey<br />
Passamaqiioddy<br />
Penobscot<br />
Peoria<br />
Pequot<br />
Piankashaw<br />
Piegan<br />
Foosepatuck<br />
Polawatoml<br />
Powhatan<br />
Sauk <strong>and</strong> Fox<br />
Shawnee<br />
Sh<strong>in</strong>neoock<br />
Stockbridges<br />
Wampanoag<br />
Wea<br />
Not reported<br />
ATHAPASKAN STOCK .<br />
Ahtena<br />
Apache<br />
Chastacosta<br />
Chetoo<br />
Cow Creek<br />
Hupa<br />
Jicarilla Apache.<br />
Kai-Fomo (syn. I^ato,<br />
Cahto)<br />
Kiowa Apache<br />
Llpan Apache<br />
Mattole<br />
Mescalero Apache<br />
Navajo (svn. Navaho)<br />
Eedwood"(syn. Whilkut)<br />
Bogue Kiver (syn. Tututnl)...<br />
Jalaz<br />
Tenankutch<strong>in</strong>.<br />
Tlatskanal.<br />
Tolowa (syn.<br />
City, S<strong>in</strong>ith<br />
di^uos)...<br />
Umpqua.<br />
Upper Coqullle..<br />
WaSakl<br />
Not reported.<br />
Caddoan stock.<br />
CmMAKUAN STOCK..<br />
Chiuarikan stock.<br />
,<br />
.<br />
.<br />
247,137<br />
40,975<br />
37<br />
1,419<br />
99<br />
172<br />
3,055<br />
115<br />
20,214<br />
459<br />
914<br />
510<br />
348<br />
142<br />
206<br />
1<br />
1,422<br />
226<br />
45<br />
22<br />
29<br />
71<br />
16<br />
1<br />
2,717<br />
83<br />
386<br />
266<br />
128<br />
66<br />
2<br />
2,268<br />
2,440<br />
131<br />
724<br />
1,338<br />
167<br />
533<br />
162<br />
30,406<br />
14,973<br />
7<br />
9<br />
9<br />
639<br />
SI<br />
139<br />
28<br />
34<br />
424<br />
22,455<br />
76<br />
— ,<br />
Ch<strong>in</strong>ookan stock.<br />
Ch<strong>in</strong>ook...<br />
Clackamas.<br />
Clatsop<br />
Wasco<br />
Wishram<br />
water) . .<br />
CmTIMACHAN STOCK.<br />
Chitimacha.<br />
(syn. Tum-<br />
CHtJMASHAN STOCK...<br />
San Luis Obispo.<br />
Santa Barbareno.<br />
Santa Ynez<br />
COSTANOAN STOCK.<br />
Santa Cruz.,<br />
Ckoatan gkotjp.,<br />
Croatan.<br />
£SKIMATJAN stock .<br />
Aleut<br />
Malemiut<br />
Not reported.<br />
Haidan stock (syn. Skittagetan)<br />
Haida.,<br />
IROQDOIAN STOCK.,<br />
Cayuga<br />
Cherdtee...<br />
Mohawk...<br />
Oneida<br />
Onondaga.,<br />
St. Begis...<br />
Tusoarora<br />
Wy<strong>and</strong>ot (syn. Huron).<br />
Not reported<br />
Kalapooun stock.<br />
Kalapooia<br />
Lakmiut<br />
Mary's Eiver (syn. Chepenafa)<br />
Santiam<br />
Wapato (syn. Atfalati) .,<br />
Yamel...<br />
Yonkalla.<br />
" Includes Bruie aioux, »uo; jmmtpajjBoiuuji., x,ui«, ..i.^«-".<br />
Sioux), 484; Two Kettle Sioux, 293; <strong>and</strong> o<strong>the</strong>r Teton Sioux, 4,964.<br />
.<br />
UNITED STATES.<br />
897<br />
315<br />
40<br />
242<br />
274<br />
38<br />
17<br />
17<br />
5,865<br />
5,865<br />
56<br />
31<br />
39,679<br />
81<br />
31,489<br />
368<br />
2,436<br />
365<br />
1,219<br />
2,907<br />
400<br />
353<br />
61<br />
106<br />
LUTUAMIAN STOCK<br />
Klamath<br />
Modoc<br />
Maidu stock (syn. Pujunan)<br />
Maidu (syn. Nish<strong>in</strong>am)..<br />
MiwoK STOCK (syn. Moquelumnan)<br />
Maria<br />
Middle Town.<br />
Miwok<br />
MnSKHOGEAN STOCK..<br />
Alibamu...<br />
Chickasaw.<br />
Choctaw...<br />
Creek<br />
Koasati<br />
Sem<strong>in</strong>ole...<br />
PiMAN STOCK.<br />
Mayo...<br />
Opata...<br />
Papago.<br />
Pima.:.<br />
Yaqui...<br />
POMO STOCK (syn. Kulanapan)<br />
.<br />
Clear Lake<br />
Gynomehro (syn. Gall<strong>in</strong>omero)<br />
Little Lake<br />
Lower Lake<br />
Pomo<br />
SAUNAN STOCK..<br />
San Antonio<br />
Saushan stock.<br />
Bellacoola<br />
Chehalis (syn.<br />
tulip, Satsop,<br />
town)<br />
Clallam<br />
Coeur d' Alene<br />
.<br />
Hump-<br />
George-<br />
Columbia (syn.S<strong>in</strong>kiuse).<br />
Colville (syn. Senijextee).<br />
Comox<br />
Cowichan<br />
Cowlitz<br />
Dwamish<br />
Fla<strong>the</strong>ad (syn. Salish). .<br />
Kalispel (syn. Fend<br />
d'Oreilles)<br />
Lummi.<br />
Methow<br />
Muckleshoot<br />
Nespelim<br />
Nisqualli.<br />
NooKsak<br />
Ok<strong>in</strong>agan<br />
Pisquow.<br />
Puyallup<br />
Qiimaielt<br />
Sanpoil..<br />
Shuswap.<br />
Skagit...<br />
Skokomish.<br />
Snohomish.<br />
Snoqualmu<br />
Songish<br />
Spokan.<br />
Squaxon<br />
Suquamish,<br />
Swmomish.<br />
Tillamook,<br />
Twana.<br />
Not reported,<br />
978<br />
696<br />
282<br />
1,100<br />
1,100<br />
22<br />
7<br />
670<br />
29,191<br />
298<br />
4,204<br />
15,917<br />
6,946<br />
98<br />
1,729<br />
8,607<br />
40<br />
5<br />
3,798<br />
4,236<br />
193<br />
33<br />
94<br />
96<br />
777<br />
16<br />
7,833<br />
385<br />
785<br />
1<br />
62<br />
105<br />
20<br />
486<br />
Shahaptian stock—Contd.<br />
Top<strong>in</strong>ish<br />
Umatilla<br />
Wallawalla<br />
Warm Spr<strong>in</strong>gs (syn. John<br />
Day, Ten<strong>in</strong>o, Tyigh,<br />
Des Chutes)<br />
Yakima<br />
Not reported<br />
Shastan stock..<br />
Hat Creek..<br />
Pit Eiver..<br />
Shasta<br />
Shoshonean stock.<br />
Bannock<br />
Chemehuevi<br />
Comanche<br />
Gabrieleno (syn. San Gar<br />
briel)<br />
Hopi(syn. Moqui, Koso).<br />
Juaneno (syn. Ban Juan<br />
Capistrano)<br />
Kawaiisu<br />
Kawia (syn. Cabuilla)....<br />
Kern Eiver<br />
Mono<br />
Pahvant<br />
Paiute<br />
Panam<strong>in</strong>t<br />
Paviotso (syn. Snake)<br />
— .<br />
San Luiseno (syn. Luisono)<br />
Serrano<br />
Shoshoni<br />
Tehachapi<br />
Ute<br />
SlOUAN STOCK.<br />
Ass<strong>in</strong>ibo<strong>in</strong><br />
Catawba<br />
Crow (syn. Absaraka). .<br />
Hidatsa (syn. Gros Ventres,<br />
M<strong>in</strong>itarl)<br />
Iowa<br />
Kansa<br />
M<strong>and</strong>an<br />
Missouri<br />
Omaha<br />
Oto<br />
Fonca<br />
Quapaw<br />
Santee Sioux (syn. Wahpekute<br />
Sioux, Mdewakanton<br />
Sioux)<br />
Sioux<br />
Sisseton Sioux (syn. Sisseton-Wahpeton<br />
Sioux,<br />
Wahpeton Sioux)<br />
Teton Sioux<br />
W<strong>in</strong>nebago.<br />
Yankton Sioux<br />
Yanktsnai Sioux (syn,<br />
Pabaksa Sioux)<br />
47<br />
272<br />
397<br />
550<br />
,362<br />
17<br />
1,578<br />
240<br />
985<br />
353<br />
16,842<br />
413<br />
355<br />
1,171<br />
11<br />
2,009<br />
16<br />
23<br />
755<br />
105<br />
1,448<br />
37<br />
780<br />
10<br />
3,038<br />
467<br />
118<br />
3,840<br />
2<br />
3 2,244<br />
32,941<br />
1,253<br />
124<br />
1,799<br />
547<br />
244<br />
238<br />
209<br />
13<br />
1,105<br />
1,373<br />
332<br />
875<br />
231<br />
1,539<br />
2,514<br />
14,284<br />
1,820<br />
2,088<br />
Ute.<br />
222; Sihasapa (syn. Blackfoot
16 INDIANS IN THE UNITED STATES.<br />
NUMBER OF INDIANS REPORTED ON SPECIAL INDIAN SCHEDULE, CLASSIFIED BY LINGUISTIC STOCKS AND<br />
TRIBES: <strong>1910</strong>—Cont<strong>in</strong>ued.<br />
Table 8—Cont<strong>in</strong>ued.<br />
LINQUISTIC STOCK AND TBIBE. Number. LINQUISTIC STOCK AND TBIBE. Number. LINQ<strong>in</strong>STIC STOCK AND TBIBE. Number. UNQUISTIC STOCK AND TKIBE. Number.<br />
TUNGIT STOCK (syn. Koluscban)<br />
Auk<br />
Chilkat<br />
Kake<br />
Not reported<br />
TONKAWAN STOCK<br />
Tonkawa<br />
TsmSHIAN STOCK<br />
TsimshJan<br />
TUNICAN STOCK.<br />
Tunica<br />
Wahlatpuan stock<br />
Cayuse<br />
Molala<br />
Wakashan stock<br />
Kltamat<br />
Kwakiutl<br />
Total<br />
Algonquian stock<br />
Delaware<br />
Athapaskan stock<br />
Ahtena<br />
Honkutch<strong>in</strong><br />
Kaiyuhldiotana<br />
Knaiakhotana<br />
Kutchln<br />
Nahane<br />
Natsltkutch<strong>in</strong><br />
Tenankutdi<strong>in</strong><br />
Tukkuthkutch<strong>in</strong><br />
Unakhotana<br />
Vuntakutcb<strong>in</strong><br />
Not reported<br />
BSKiMAxrAN stock<br />
Aleut ,<br />
Ghnagmiut<br />
Ikogmlut<br />
32<br />
2<br />
4<br />
3<br />
23<br />
42<br />
42<br />
51<br />
SI<br />
43<br />
43<br />
329<br />
298<br />
31<br />
388<br />
25,331<br />
3<br />
3,916<br />
297<br />
127<br />
160<br />
697<br />
359<br />
8<br />
177<br />
415<br />
6<br />
193<br />
5<br />
1,472<br />
14,087<br />
1,451<br />
326<br />
782<br />
Wakashan stock—Contd.<br />
Makah<br />
Nootka<br />
Not reported<br />
Washoan stock<br />
Washo<br />
W<strong>in</strong>tun stock (syn. Copehan)<br />
Nomelaki ,<br />
Patw<strong>in</strong><br />
W<strong>in</strong>tun (syn. Tr<strong>in</strong>ity<br />
<strong>Indian</strong>s)<br />
WiTAT STOCK (syn. Wishoskan)<br />
Humboldt Bay<br />
YAKONAN STOCK s<br />
Alsea<br />
Siuslaw<br />
Yaqu<strong>in</strong>a<br />
Eskimauan stock—Contd.<br />
Imaklimiut<br />
Iprackmiut<br />
Kaialigmiut<br />
Kakuakamiut<br />
Kan^maligmiut<br />
Kaviagmiut<br />
Kekchabukm<strong>in</strong>t<br />
E<strong>in</strong>ugumiut<br />
Kopagmlut<br />
Kowagmiut<br />
Kukpaurungmiut<br />
Kunmiut<br />
Kusetr<strong>in</strong>miut<br />
Kuskovakmlut<br />
Kuskowik<br />
Kuskwogmlut<br />
Magemiut<br />
Malemiut<br />
Naparktoo<br />
Neechuktamiut<br />
Nunatogmiut<br />
Nuniragmiut<br />
Nunochogmlut<br />
Nustaagagmiut. . :<br />
TTNTTBD STATES—Cont<strong>in</strong>ued.<br />
819<br />
819<br />
125<br />
186<br />
399<br />
152<br />
152<br />
55<br />
AIiASKA.<br />
2<br />
4<br />
192<br />
22<br />
1<br />
238<br />
32<br />
594<br />
9<br />
561<br />
6<br />
77<br />
133<br />
370<br />
37<br />
1,480<br />
376<br />
563<br />
9<br />
25<br />
285<br />
301<br />
158<br />
31<br />
Yanak stock<br />
Yana(syn. Nozi).<br />
Yokuts stock (syn. Maripo-<br />
Cbo<strong>in</strong>lmni<br />
Chookim<strong>in</strong>ah.<br />
Chukchansi...<br />
Kashowoo<br />
Tachi<br />
Weobiklilt....<br />
Wikchamni...<br />
Yokuts<br />
Yowdancbl. .<br />
YUCHEAN STOCK.<br />
Yuchi<br />
YVKIAN STOCK..<br />
Coast Yuki<br />
Redwood<br />
nom)<br />
Wai rappo.<br />
uki<br />
(syn. Hucb-<br />
Eskimauan stock—Contd.<br />
Nuwukmiut<br />
Pltukmiut<br />
Folazramiut<br />
Selawigmiut<br />
Sidarumlut<br />
Tikeramlut<br />
Togiagm<strong>in</strong>t<br />
Ukiv^miut<br />
Unaligmiut<br />
Utkiav<strong>in</strong>miut<br />
Utukamlut (syn. Otookogmiut)<br />
Yuit<br />
Sou<strong>the</strong>rn Eskimo (<strong>in</strong>clud<strong>in</strong>g<br />
Aglemiut, Chugachigmiut,Kaniagmi-<br />
ut, <strong>and</strong> Ugalakmiut). .<br />
Not reported<br />
Haidan stock (syn. Skittagetan)<br />
Haida.<br />
.<br />
.<br />
.<br />
533<br />
18<br />
4<br />
144<br />
4<br />
27<br />
6<br />
25<br />
302<br />
3<br />
78<br />
78<br />
198<br />
15<br />
15<br />
73<br />
95<br />
81<br />
4<br />
14<br />
258<br />
5<br />
320<br />
93<br />
140<br />
441<br />
123<br />
127<br />
292<br />
3,650<br />
474<br />
YUMAN STOCK<br />
Cocopa<br />
Diegueno<br />
Havasupai<br />
Maricopa<br />
Mohave (Mojare)<br />
Walapal (syn. Hualapal).<br />
Yayapal (Mohave-<br />
Apacne)<br />
Yuma<br />
Yuma Apache :<br />
Not reported<br />
YuEOK STOCK (syn. Weitspekan)<br />
Weitspec (syn. Yurok)...<br />
ZAPOTECAN STOCK<br />
ZUNIAN STOCK<br />
Zuni<br />
Stock or tribe not reported...<br />
Tungit stock (syn. Kolus-<br />
Chan)<br />
Auk<br />
Chilkat<br />
Henya<br />
Huna<br />
Hutenuwu<br />
Kake<br />
Knyu<br />
Sitka<br />
Stik<strong>in</strong>e<br />
Taku<br />
Tongas<br />
Yakutat<br />
Not reported<br />
TsmsHiAN stock<br />
Tsimshian...<br />
Stock or tribe not reported.<br />
.<br />
4,279<br />
24S<br />
756<br />
174<br />
386<br />
1,068<br />
501<br />
289<br />
834<br />
24<br />
12<br />
668<br />
668<br />
1<br />
1,667<br />
1,687<br />
1,644<br />
4,426<br />
267<br />
690<br />
214<br />
625<br />
536<br />
322<br />
29<br />
142<br />
184<br />
307<br />
313<br />
729<br />
729<br />
1,640
Table 9<br />
TEIBE AKD STATE.<br />
ABNAia (Algonqtiian).<br />
New York<br />
Ma<strong>in</strong>e -.-<br />
Pennsylvania.<br />
Wiscons<strong>in</strong><br />
AcoMA (Keresan)<br />
New Uexico...<br />
. . . . . .<br />
Ahtena (Atliapaskan).<br />
Oregon<br />
Aleut (Eskimauan)<br />
Oregon<br />
Alibamu (Muskhogean).<br />
Texas<br />
Louisiana.<br />
AL9EA (Yakonan).<br />
Oregon<br />
Soath Dakota..<br />
Wash<strong>in</strong>gton....<br />
Apache (Athapaskan)<br />
Arizona<br />
Oklahoma<br />
New Mexico....<br />
ICansas...<br />
California<br />
Nevada...<br />
Pennsylvania..<br />
Oregon<br />
Colorado<br />
Missouri<br />
South Dakota.<br />
Wyom<strong>in</strong>g<br />
Abapaho (AlgoncLuion)<br />
Wyom<strong>in</strong>g<br />
Oklahoma<br />
Montana<br />
Kansas<br />
Pennsylvania..<br />
South Dakota..<br />
California<br />
Aeikaba (Caddoan).<br />
North Dakota..<br />
New York<br />
Montana<br />
Pennsylvama..<br />
South Dakota..<br />
Nebraska..<br />
Oklahoma.<br />
AsannBora (Siouan)<br />
Montana<br />
North Dakota..<br />
Kansas<br />
Oregon<br />
South Dakota..<br />
Pennsylvania.<br />
AWK (Tl<strong>in</strong>git).<br />
Oregon<br />
—<br />
Bannock (Shoshonean)<br />
Idaho<br />
Montana<br />
Wyom<strong>in</strong>g<br />
Pennsylvania<br />
California<br />
South Dakota<br />
Oregon<br />
Nebraska<br />
Nevada<br />
Utah<br />
Number.<br />
37<br />
691<br />
691<br />
40<br />
40<br />
187<br />
111<br />
29<br />
14,973<br />
4,652<br />
271<br />
25<br />
1,419<br />
703<br />
685<br />
18<br />
1<br />
444<br />
425<br />
6<br />
4<br />
1,253<br />
363<br />
POPULATION. 17<br />
INDIAN TRIBES, BY STATES: <strong>1910</strong>.<br />
[The stock to which <strong>the</strong> tribe belongs is given <strong>in</strong> paren<strong>the</strong>sis <strong>in</strong> each case.]<br />
TKIBE AND STATE. Number.<br />
Bellacoola (Salishan)<br />
Wash<strong>in</strong>gton<br />
. . .<br />
Blackfeet (Algonquian)<br />
North Dakota..<br />
Montana<br />
Nebraska<br />
Oklahoma<br />
OregoK<br />
California<br />
Massachusetts.<br />
South Dakota.<br />
Bbo<strong>the</strong>bton ( Algonquian)<br />
Wiscons<strong>in</strong>..<br />
M<strong>in</strong>nesota..<br />
New York..<br />
Idaho<br />
Michigan...<br />
Caddo (Caddoan)<br />
Oklathoma<br />
Pennsylvania..<br />
Kansas<br />
South Dakota..<br />
Catawba (Siouan)..<br />
South Carol<strong>in</strong>a.<br />
Colorado..<br />
North Carol<strong>in</strong>a..<br />
Virg<strong>in</strong>ia<br />
Pennsylvania...<br />
Cayuga (Iroquoian)<br />
Catuse (Waiilatpuan)<br />
.<br />
.<br />
. .<br />
Chastacosta (Athapaskan).<br />
Oregon.<br />
Chehalis (Salishan)<br />
Chemehuevi (Shoshonean) .<br />
Chebokee (Iroquoian)<br />
1 Includes Chlricahua Apache (Oklahoma, 237; Arizona, 24); Coyotero Apache<br />
{Arizona, 655); <strong>and</strong> White Mounta<strong>in</strong> Apache (Anzona, 62; Nevada, 3; Oklahoma, 2).<br />
67090°—15<br />
2<br />
California<br />
North Dakota.<br />
Oregon<br />
Virg<strong>in</strong>ia.<br />
Ohio....<br />
Wiscons<strong>in</strong><br />
Missouri.<br />
Colorado<br />
Montana<br />
A^bama<br />
Idaho<br />
172<br />
162<br />
452<br />
TRIBE AND STATE.<br />
Cheeoeee (Iroquoian)—Con.<br />
Wash<strong>in</strong>gton<br />
South Dakota<br />
New York<br />
Arizona<br />
Michigan<br />
M<strong>in</strong>nesota<br />
Louisiana<br />
New Mexico<br />
Chetco (Athapaskan).<br />
Oregon<br />
California<br />
Pennsylvama.<br />
Cheyenne (Algonquian)<br />
Oklahoma<br />
Montana<br />
South Dakota..<br />
Petmsylvania.<br />
Colorado<br />
Kansas<br />
Nebraska<br />
Wyom<strong>in</strong>g<br />
Missouri<br />
North Dakota..<br />
CmozAHOMrNY (Algonquian)<br />
Virg<strong>in</strong>ia<br />
GmcKASAW (Muskhogean)<br />
Oklahoma..<br />
Kansas..:..<br />
Oregon..<br />
Arizona<br />
South Dakota..<br />
CmLKAT (Tl<strong>in</strong>git).<br />
Oregon<br />
Chiuakum (Chimakuan).<br />
Wash<strong>in</strong>gton<br />
Chimaeiko (Chimarikan)<br />
California<br />
Ch<strong>in</strong>ook (Ch<strong>in</strong>ookan).<br />
Wash<strong>in</strong>gton..<br />
Oregon<br />
Montana<br />
Oklahoma....<br />
Chippewa (Algonquian)<br />
M<strong>in</strong>nesota<br />
Wiscons<strong>in</strong><br />
Michigan....<br />
North Dakota<br />
Montana.<br />
Pennsylvania<br />
Kansas<br />
South Dakota<br />
Nebraska<br />
Oklahoma<br />
Oregon<br />
California<br />
Wash<strong>in</strong>gton<br />
District of Columbia..<br />
New York<br />
Ohio<br />
North Carol<strong>in</strong>a<br />
Arizona<br />
Ma<strong>in</strong>e<br />
Missouri..<br />
Utah..<br />
Chitimacha (Chltimachan) .<br />
Louisiana<br />
Pennsylvania<br />
.<br />
. . . . .<br />
Number.<br />
3,065<br />
1,522<br />
1,346<br />
133<br />
33<br />
6<br />
5<br />
4<br />
3<br />
2<br />
1<br />
115<br />
115<br />
4,204<br />
4,191<br />
4<br />
- 4<br />
3<br />
1<br />
1<br />
177<br />
125<br />
12<br />
1<br />
20,214<br />
TRIBE AND STATE.<br />
Choctaw (Muskhogean).<br />
Oklahoma<br />
Mississippi<br />
Louisiana<br />
Alabama<br />
Kansas<br />
South Dakota..<br />
Virg<strong>in</strong>ia..<br />
Oregon..<br />
Cho<strong>in</strong>imni (Yokuts).<br />
California<br />
Chookim<strong>in</strong>ah (Yokuts).<br />
California<br />
Chukchansi (Yokuts)<br />
California,<br />
Arizona..!.<br />
.<br />
. . -<br />
Clackamas (Ch<strong>in</strong>ookan)<br />
Oregon<br />
Wafii<strong>in</strong>gton..<br />
Clallam (Salishan).<br />
Wash<strong>in</strong>gton<br />
Oregon<br />
Pennsylvania.<br />
. .<br />
New York<br />
South Dakota.<br />
Clatsop (Ch<strong>in</strong>ookan).<br />
Wash<strong>in</strong>gton....<br />
Oregon<br />
OklEkhoma<br />
South Dakota..<br />
Clear L.ake (Pomo)<br />
California<br />
Coast Ycki (Yukian).<br />
California<br />
Cochiti (Keresan)..<br />
New Mexico<br />
CocoPA (Yuman)<br />
Arizona...<br />
California.<br />
CoEVB d'Alene (Salishan).<br />
Idaho<br />
Oregon<br />
Wash<strong>in</strong>gton...<br />
Pennsylvania.<br />
Columbia (Salishan).<br />
Wash<strong>in</strong>gton..<br />
Oregon<br />
CoLVTLLE (Salishan)..<br />
Wash<strong>in</strong>gton...<br />
Oregon<br />
Idaho<br />
Montana<br />
Pennsylvania.<br />
Comanche (Shoshonean)..<br />
Oklahoma<br />
Kansas<br />
Pennsylvania.<br />
Number.<br />
15,917<br />
14,551<br />
1,162<br />
115<br />
67<br />
11<br />
8<br />
8<br />
4<br />
1<br />
(Arizona, 490); San Carlos Apache (Arizona, 1,087; Oklahoma, 2); Tonto Apache<br />
18<br />
144<br />
142<br />
2<br />
40<br />
39<br />
1<br />
383<br />
11<br />
2<br />
1<br />
1<br />
26<br />
18<br />
4<br />
3<br />
1<br />
193<br />
15<br />
237<br />
237<br />
245<br />
229<br />
16<br />
284<br />
4<br />
4<br />
1<br />
385<br />
333<br />
52<br />
785<br />
717<br />
25<br />
17<br />
17<br />
1,171<br />
1,160<br />
7<br />
4
18 INDIANS IN THE UNITED STATES.<br />
Table 9—Cont<strong>in</strong>ued.<br />
TEIBE AND STATE.<br />
INDIAN TRIBES, BY STATES: <strong>1910</strong>—Cont<strong>in</strong>ued.<br />
[The stock to which <strong>the</strong> tribe belongs is given <strong>in</strong> paren<strong>the</strong>sis <strong>in</strong> each case.)
Table 9—Cont<strong>in</strong>ued.<br />
TRIBE AND STATE.<br />
Mashfee (Algonquian).<br />
Massachusetts<br />
Pennsylvania<br />
Mattapont (Algonquian)<br />
Virg<strong>in</strong>ia<br />
Mattole (Athapaskan).<br />
California<br />
Hayo (Fimaa)<br />
Arizona<br />
. . . .<br />
Menom<strong>in</strong>ee (Algonqaian).<br />
Wiscons<strong>in</strong><br />
Michigan<br />
M<strong>in</strong>nesota. . .<br />
Pennsylvania.<br />
Oklahoma<br />
South Dakota.<br />
Nebraska<br />
Oregon<br />
Mescaleho Apache (Attmpaskan)<br />
New Mexico.<br />
Kansas<br />
Oklahoma...<br />
Methow (SfiUsban)..<br />
Wash<strong>in</strong>gton<br />
Miami (Algonquian).<br />
Oklahoma.<br />
<strong>Indian</strong>a<br />
Michigan<br />
California<br />
Missouri<br />
Pennsylvania.<br />
MiCMAC (Algonquian)..<br />
Ma<strong>in</strong>e<br />
Massachusetts.<br />
M<strong>in</strong>nesota<br />
Middle TowN(Miwok).<br />
California<br />
MissouBi (Siouan)<br />
Oklahoma...<br />
Wash<strong>in</strong>gton.<br />
MiwoK (Miwok) .<br />
California.<br />
Nevada. .<br />
Modoc (Lutuamian).<br />
Oregon<br />
Oklahoma<br />
Califomia<br />
Missouri<br />
Arizona<br />
Pemnsylvania.<br />
Idaho<br />
Wash<strong>in</strong>gton.<br />
Mohave (Yuman).<br />
Arizona<br />
California<br />
Nevada<br />
Fennsylvania.<br />
Mohawk (Iroquoian).<br />
New York.<br />
Ohio<br />
Wiscons<strong>in</strong>.<br />
Number.<br />
!,•<br />
206<br />
201<br />
5<br />
40<br />
40<br />
1,350<br />
34<br />
13<br />
9<br />
7<br />
4<br />
3<br />
1<br />
1<br />
424<br />
416<br />
4<br />
4<br />
123<br />
90<br />
8<br />
2<br />
1<br />
1<br />
1<br />
45<br />
13<br />
670<br />
212<br />
33<br />
20<br />
10<br />
2<br />
2<br />
1<br />
1<br />
1<br />
1,058<br />
667<br />
368<br />
320<br />
12<br />
12<br />
POPULATION. 19<br />
INDIAN TRIBES, BY STATES: <strong>1910</strong>—Cont<strong>in</strong>ued.<br />
[The stock to which <strong>the</strong> tribe belongs is given <strong>in</strong> paren<strong>the</strong>sis <strong>in</strong> each case.]<br />
TKIBE AND STATE. Number. TRIBE AND STATE.<br />
Mohawk (Iroquoian)—Con.<br />
Oklahoma<br />
Michigan<br />
Pennsylvania<br />
Florida<br />
Idaho<br />
Ma<strong>in</strong>e<br />
MoHEGAN (Algonquian)..<br />
Connecticut<br />
MoLALA (Waiilatpuan).<br />
Oregon<br />
Wa^<strong>in</strong>gton.<br />
Mono (Shoshonean)<br />
Califomia.<br />
Nevada...<br />
. . .<br />
Montauk (Algonquian)..<br />
Wiscons<strong>in</strong>..<br />
New York.<br />
Oklahoma.<br />
MuCKLESHOOT (Sallshan).<br />
Wash<strong>in</strong>gton.,<br />
Oregon......<br />
MVNSEE (Algonquian).<br />
Kiansas<br />
Oklahoma<br />
New York<br />
—<br />
Pennsylvania.<br />
North Dakota.<br />
Oregon<br />
Nambe (Tanoan).<br />
New Mexico..<br />
Naekaganset (Algonquian)<br />
Wiscons<strong>in</strong><br />
Connecticut<br />
Massachusetts.<br />
Pennsylvania..<br />
Navajo (Athapaskan).<br />
Arizona<br />
New Mexico...<br />
trtah<br />
Califomia<br />
Pennsylvania.<br />
Colorado<br />
OklEkhoma<br />
South Dakota.<br />
Wyom<strong>in</strong>g<br />
Nespeum (Salishan)<br />
Wash<strong>in</strong>gton<br />
Nez PERCES(Shahaptian)..<br />
Idaho<br />
Wash<strong>in</strong>gton...<br />
Oregon<br />
Montana<br />
Pennsylvania.<br />
Kansas<br />
South Dakota.<br />
NiANTic (Algonquian).<br />
Connecticut<br />
NiSQTTALU (Salishan).<br />
Wash<strong>in</strong>gton.<br />
Oregon<br />
NoMELAKi (W<strong>in</strong>tun).<br />
Cihlifomia<br />
Pennsylvania.<br />
1,448<br />
1,3<br />
60<br />
29<br />
194<br />
191<br />
3<br />
71<br />
16<br />
8<br />
5<br />
2<br />
1<br />
22,455<br />
11,001<br />
10,354<br />
1,039<br />
20<br />
13<br />
8<br />
8<br />
4<br />
4<br />
i<br />
46<br />
46<br />
1,259<br />
1,035<br />
79<br />
58<br />
54<br />
31<br />
1<br />
1<br />
1<br />
137<br />
129<br />
8<br />
125<br />
122<br />
3<br />
.<br />
. . . . . .<br />
NooESAK (Salishan)<br />
Wash<strong>in</strong>gton<br />
NooTKA (Wakashan).<br />
Wash<strong>in</strong>gton<br />
Ok<strong>in</strong>agan (Salishan).<br />
Wash<strong>in</strong>gton...<br />
Oregon<br />
Montana<br />
Pennsylvania.<br />
Idaho<br />
Omaha (Siouan).<br />
Nebraska<br />
Kansas<br />
Pennsylvania.<br />
Oklahoma<br />
California<br />
North Dakota..<br />
Oneida (Iroquoian)..<br />
Wiscons<strong>in</strong><br />
New York<br />
Pennsylvania<br />
Oklahoma<br />
Michigan<br />
M<strong>in</strong>nesota<br />
South Dakota...<br />
Nebraska<br />
South Carol<strong>in</strong>a.<br />
Arizona<br />
North Dakota..<br />
Wyom<strong>in</strong>g<br />
Onondaga (Iroquoian).<br />
New York<br />
Pennsylvania.<br />
Michigan<br />
M<strong>in</strong>nesota<br />
Oklahoma<br />
South Dakota..<br />
Wiscons<strong>in</strong><br />
OPATA(Piman).<br />
Arizona<br />
Orleans (Karok)..<br />
Califomia<br />
Osage (Siouan).<br />
Oklahoma<br />
Kansas<br />
Pennsylvania..<br />
South Dakota.<br />
Arizona<br />
New Mexico...<br />
Wiscons<strong>in</strong>.<br />
Oto (Siouan)..<br />
Oklahoma.<br />
Nebraska.<br />
Kansas<br />
Oregon<br />
Wiscons<strong>in</strong>.<br />
Ottawa (Algonquian).<br />
Michigan...<br />
Oklahoma.<br />
Wiscons<strong>in</strong>..<br />
Nebraska..<br />
Pennsylvania<br />
Pahvant (Shoshonean).<br />
Utah.<br />
Paiute (Shoshonean).<br />
Nevada.<br />
Utah....<br />
Number.<br />
266<br />
11<br />
1,105<br />
1,075<br />
11<br />
11<br />
5<br />
2<br />
1<br />
2,436<br />
2,107<br />
211<br />
40<br />
26<br />
18<br />
10<br />
7<br />
7<br />
5<br />
2<br />
1<br />
1<br />
1<br />
327<br />
33<br />
1<br />
1<br />
1<br />
1<br />
1<br />
775<br />
775<br />
1,373<br />
1,345<br />
12<br />
7<br />
4<br />
2<br />
1<br />
1<br />
1<br />
332<br />
314<br />
10<br />
6<br />
1<br />
1<br />
2,717<br />
2,454<br />
170<br />
50<br />
23<br />
14<br />
37<br />
37<br />
780<br />
247<br />
238<br />
tribe <strong>and</strong> state. Number.<br />
Paiute (Shoshonean)—Con.<br />
California<br />
Arizona<br />
Pennsylvania<br />
Washmgton<br />
Kansas.<br />
South Dakota<br />
Montana<br />
Wyom<strong>in</strong>g<br />
Palcos (Shahaptian)<br />
Wash<strong>in</strong>gton..<br />
Oregon<br />
Pamtjnkey (Algonquian)<br />
Virg<strong>in</strong>ia<br />
Panam<strong>in</strong>t (Shoshonean).<br />
Califomia.<br />
Nevada...<br />
Papago (Piman)..<br />
Arizona<br />
Califomia<br />
Kansas<br />
Nevada<br />
South Dakota..<br />
Passamaquoddt (Algonquian)<br />
Ma<strong>in</strong>e<br />
Nebraska..<br />
New York.<br />
Patw<strong>in</strong> (W<strong>in</strong>tun).<br />
Califomia<br />
Paviotso (Shoshonean).<br />
Nevada<br />
Oregon<br />
Idaho<br />
Califomia<br />
Montana<br />
Missouri<br />
Wash<strong>in</strong>gton..<br />
— .<br />
Pawnee (Caddoan)..<br />
Oklahoma<br />
Arizona<br />
Pennsylvania.<br />
South Dakota.<br />
Montana<br />
Nebraska<br />
New York<br />
Pecos (Tanoan)..<br />
New Mexico...<br />
Pennsylvania.<br />
Penobscot (Algonquian) ...<br />
Ma<strong>in</strong>e<br />
New York<br />
New Hampshire<br />
Pannsylvania<br />
<strong>Indian</strong>a<br />
Nebraska<br />
Peoria (Algonquian).<br />
Oklahoma<br />
Missouri<br />
Kansas<br />
North Dakota..<br />
C^omia<br />
Penns^vania..<br />
South Dakota..<br />
Pequot (Algonquian).<br />
Connecticut<br />
Massachusetts.<br />
.<br />
.<br />
210<br />
69<br />
6<br />
5<br />
2<br />
2<br />
1<br />
1<br />
75<br />
7<br />
83<br />
83<br />
10<br />
1<br />
3,798<br />
3,785<br />
6<br />
3<br />
3<br />
1<br />
381<br />
3<br />
2<br />
186<br />
186<br />
3,038<br />
2,414<br />
341<br />
152<br />
101<br />
26<br />
2<br />
2<br />
573<br />
19<br />
18<br />
14<br />
5<br />
2<br />
1<br />
1<br />
10<br />
266<br />
253<br />
S<br />
3<br />
3<br />
1<br />
1<br />
128<br />
114<br />
5<br />
3<br />
3<br />
1<br />
1<br />
1<br />
49<br />
17
20 INDIANS IN THE UNITED STATES.<br />
Table 9—Cont<strong>in</strong>ued.<br />
TBIBE AKD STATE.<br />
PlANKASHAW (Algonquian)..<br />
Oklahoma<br />
FicuBis (Tonoan).<br />
New Mexico..<br />
FiEQAN (Algonquian).<br />
Montana<br />
Nebraska<br />
Pennsylvania.<br />
Arizona<br />
Idaho<br />
OMahoma<br />
Wyom<strong>in</strong>g<br />
Oregon<br />
PmA(P<strong>in</strong>ian).<br />
Arizona<br />
California<br />
Kansas<br />
Pennsylvania.<br />
New Mexico..<br />
Oregon<br />
PISQ0OW (Salishan).<br />
Wash<strong>in</strong>gton<br />
Pit Eivek (Shastan)<br />
California<br />
Oregon<br />
Nevada<br />
Oklahoma<br />
Pennsylvania.<br />
PojOAQUE (Tanoan).<br />
New Mexico<br />
POMO (Porno).<br />
California..<br />
Arizona<br />
. .<br />
PoNCA (Siouan)<br />
Oklahoma.<br />
Nebraska.<br />
Soath Dakota..<br />
Fennsylvania..<br />
PoosEPAHfCK(Algonquian).<br />
New York<br />
PoTAWATOMi (Algonquian)..<br />
Oklahoma<br />
Michigan<br />
Wiscons<strong>in</strong><br />
Nebraska<br />
South Dakota.<br />
Iowa<br />
Arizona<br />
Pennsylvania.,<br />
California<br />
M<strong>in</strong>nesota<br />
MoDtana<br />
Oregon<br />
Wash<strong>in</strong>gton<br />
Wyom<strong>in</strong>g<br />
Powhatan (Algonquian).<br />
Virg<strong>in</strong>ia<br />
PuTALLUP (Salishan).<br />
Wash<strong>in</strong>gton.<br />
Oregon<br />
Pennsylvania.<br />
.<br />
.<br />
Number.<br />
104<br />
104<br />
2,268<br />
2,221<br />
21<br />
12<br />
3<br />
3<br />
3<br />
3<br />
2<br />
4,236<br />
4,167<br />
60<br />
S<br />
2<br />
1<br />
1<br />
52<br />
52<br />
985<br />
16<br />
16<br />
777<br />
776<br />
1<br />
875<br />
619<br />
193<br />
42<br />
is<br />
3<br />
2,440<br />
819<br />
461<br />
245<br />
21<br />
10<br />
131<br />
"lii<br />
303<br />
278<br />
21<br />
3<br />
1<br />
INDIAN TRIBES, BY STATES: <strong>1910</strong>—Cont<strong>in</strong>ued.<br />
[The stock to which <strong>the</strong> tribe belongs is given <strong>in</strong> paren<strong>the</strong>sis <strong>in</strong> eac h c ase.]<br />
TRIBE .4.ND STATE. Number.<br />
QuAPAW (Siout<strong>in</strong>)<br />
. . . .<br />
Oklahoma<br />
Kansas<br />
California<br />
Nebraska<br />
Pennsylvania..<br />
South Dakota.<br />
QuiLEiTTE (Chimakuan)..<br />
Wash<strong>in</strong>gton<br />
QuiNAiELT (Salishan).<br />
Wash<strong>in</strong>gton.<br />
Oregon<br />
EEDWOOD (HUCHNOM) (Yukian)<br />
California.<br />
Eedwood (Whilkut) (Athapaskan)<br />
California<br />
Wash<strong>in</strong>gton.<br />
EOGUE ErvEK (Athapasian).<br />
Oregon<br />
California.<br />
Wash<strong>in</strong>gton.<br />
Saiaz (Athapaskan).<br />
California<br />
St. Eegis (Iroquoian).<br />
New York<br />
Peimsylvania<br />
Ma<strong>in</strong>e<br />
Oklahoma<br />
San Antonio (Sal<strong>in</strong>an)..<br />
California<br />
San Felipe (Keresan).<br />
New Mexico<br />
San Ildefonso (Tanoan)<br />
New Mexico<br />
San Juan (Tanoan).<br />
Now Mexico..<br />
Wash<strong>in</strong>gton...<br />
Pennsylvania.<br />
San Luis Obispo (Chumashan)<br />
California.<br />
San Luiseno (Shoshonean)..<br />
California<br />
S<strong>and</strong>ia (Tanoan)<br />
New Mexico.<br />
Sanpoil (SaUshan).<br />
Wash<strong>in</strong>gton...<br />
Oregon<br />
Pennsylvania.<br />
Santa Ana (Keresan).<br />
New Mexico<br />
231<br />
221<br />
6<br />
1<br />
1<br />
1<br />
1<br />
259<br />
259<br />
287<br />
1<br />
76<br />
383<br />
1,219<br />
1,140<br />
77<br />
1<br />
1<br />
16<br />
16<br />
490<br />
490<br />
123<br />
123<br />
387<br />
384<br />
2<br />
1<br />
467<br />
467<br />
240<br />
211<br />
tribe <strong>and</strong> state. Number.<br />
Santa Bap.babeno (Chumashan)<br />
California<br />
Santa Claka (Tanoan)<br />
New Mexico<br />
Santa Ceuz (Costanoan)<br />
California<br />
Sa>-ta Ynez (Chumashan) .<br />
California<br />
Santee Sioux (Siouan)<br />
Nebraska<br />
South Dakota<br />
M<strong>in</strong>nesota<br />
Montana<br />
North Dakota : . .<br />
Wiscons<strong>in</strong><br />
Oregon<br />
Santiam (Kalapooian)<br />
Oregon<br />
Santo DoMnfao (Keresan) .<br />
New Mexico<br />
Sauk AND Fox (Algonquian).<br />
Oklahoma<br />
Iowa<br />
Kansas<br />
Fennsylvania<br />
Nebraska<br />
Wash<strong>in</strong>gton<br />
Tennessee<br />
Missouri<br />
Ohio<br />
Michigan<br />
South Dakota<br />
Wiscons<strong>in</strong><br />
Sem<strong>in</strong>ole (Muskhogean)<br />
Oklahoma<br />
Texas<br />
Florida<br />
Kansas<br />
California<br />
Fennsylvania<br />
Seneca (Iroquoian)<br />
New York<br />
Oklahoma<br />
Pennsylvania<br />
Kansas<br />
California<br />
New Mexico<br />
Oregon<br />
South Dakota<br />
Wiscons<strong>in</strong><br />
Arizona<br />
Montana<br />
Sesbano (Shoshonean)<br />
California<br />
Fennsylvania<br />
Arizona<br />
Shasta (Shastan)<br />
California<br />
Oregon<br />
Wash<strong>in</strong>gton<br />
Shawnee (Algonquian)<br />
Oklahoma<br />
Kansas<br />
Missouri<br />
Pennsylvania<br />
Arizona<br />
South Dakota<br />
Montana<br />
.<br />
277<br />
17<br />
35<br />
1,539<br />
708<br />
378<br />
232<br />
107<br />
100<br />
13<br />
1<br />
817<br />
817<br />
724<br />
347<br />
257<br />
1,729<br />
1,503<br />
200<br />
16<br />
8<br />
1<br />
1<br />
2,907<br />
2,485<br />
215<br />
184<br />
7<br />
6<br />
2<br />
2<br />
2<br />
2<br />
1<br />
1<br />
118<br />
115<br />
2<br />
1<br />
353<br />
255<br />
96<br />
2<br />
1,338<br />
1,300<br />
14<br />
14<br />
4<br />
3<br />
tribe <strong>and</strong> state. Number.<br />
Sh<strong>in</strong>necock (Algonquian)<br />
New York<br />
Shoshoni (Shoshonean).<br />
Nevada<br />
Idaho<br />
Wyom<strong>in</strong>g<br />
Utah<br />
California<br />
Pennsylvania..<br />
Montana ,<br />
Arizona<br />
South Dakota.<br />
Kansas<br />
Nebraska<br />
Shuswap (Salishan).,<br />
Wash<strong>in</strong>gton<br />
SiA (Keresan)<br />
New Mexico.<br />
Sioux (Siouan)<br />
South Dakota.<br />
M<strong>in</strong>nesota<br />
North Dakota..<br />
Pennsylvania..<br />
Montana<br />
Nebraska<br />
New Jersey<br />
Oklahoma<br />
Kansas<br />
Wiscons<strong>in</strong><br />
Missouri<br />
Wyom<strong>in</strong>g<br />
Iowa<br />
Arizona<br />
California<br />
Ohio<br />
Utah<br />
Wash<strong>in</strong>gton<br />
Michigan<br />
New York<br />
Oregon<br />
SissETON Sioux (Siouan)<br />
South Dakota.<br />
North Dakota..<br />
Montana<br />
M<strong>in</strong>nesota ,<br />
Nebraska<br />
Kansas ,<br />
Nevada ,<br />
SiusLAW (Yakonan)<br />
Oregon<br />
Skagit (Salishan).<br />
Wash<strong>in</strong>gton...<br />
SK0K0ME3H (Salishan)<br />
Wash<strong>in</strong>gton..<br />
Oregon<br />
.<br />
. .<br />
, . .<br />
Snohomish (Salishan).<br />
Wash<strong>in</strong>gton..<br />
Oregon<br />
SNOQUALsnj (Salishan)..<br />
Wash<strong>in</strong>gton<br />
SONGISH (Salishan).<br />
Wash<strong>in</strong>gton<br />
Spokan (Salishan)<br />
Wash<strong>in</strong>gton<br />
Montana<br />
Idaho<br />
'.,'_<br />
'_<br />
Oregon<br />
Pennsylvania..<br />
.<br />
167<br />
"l67<br />
3,840<br />
1,555<br />
1,259<br />
700<br />
248<br />
33<br />
27<br />
10<br />
4<br />
2<br />
1<br />
1<br />
109<br />
~i09<br />
277<br />
161<br />
99<br />
96<br />
86<br />
62<br />
82<br />
53<br />
40<br />
18<br />
11<br />
2,514<br />
621<br />
255<br />
63<br />
15<br />
56<br />
"~56<br />
195<br />
193<br />
2<br />
661<br />
3<br />
93<br />
23<br />
"is<br />
643<br />
134<br />
96<br />
28<br />
6
Table 9—Cont<strong>in</strong>ued.<br />
TRIBE AND STATE.<br />
POPULATION. 21<br />
INDIAN TRIBES, BY STATES: <strong>1910</strong>—Cont<strong>in</strong>ued.<br />
[The stock to which <strong>the</strong> tribe belongs Is given <strong>in</strong> paren<strong>the</strong>sis <strong>in</strong> each case.]
22<br />
INDIANS IN THE UNITED STATES.<br />
INDIAN POPULATION OF THE DIFFERENT STATES, BY TRIBES: <strong>1910</strong>.<br />
[Under"Not reported" are <strong>in</strong>cluded <strong>Indian</strong>s iidians enumerated on <strong>the</strong> general <strong>population</strong> schedule only (see Table 3, p. 11) for whom "o <strong>in</strong>q<br />
3, p. 11) for whom no <strong>in</strong>quiry as to stoclc or tribe was made,or<br />
<strong>Indian</strong>s for whom special schedules were obta<strong>in</strong>ed but whose stock or tribe was not reported.]<br />
Table lO<br />
STATE AND TBIBE. Number. STATE AND TRIBE.<br />
Alabama.<br />
Cherokee<br />
Choctaw<br />
Creek<br />
Not reported.<br />
Abizona.<br />
Apache<br />
Apache<br />
• Chirlcahua Apache...<br />
Coyotero Apache<br />
San Carlos Apache . .<br />
Tonto Apache<br />
Wliite Mounta<strong>in</strong><br />
Apache<br />
Chemehuevi<br />
Cherokee<br />
Chickasaw<br />
Chippewa<br />
Chukchansi<br />
Cocopa<br />
Havasupai<br />
Hopi<br />
Hupa ;...<br />
Isieta<br />
Kawia<br />
Klamath<br />
Little Lake<br />
Maricopa<br />
Mayo<br />
Modoc<br />
Mohave<br />
Navajo<br />
'<br />
Oneida<br />
Opata<br />
- .<br />
Paiute<br />
Papago<br />
Pawnee<br />
Piegan<br />
Pima<br />
Porno<br />
Potawatomi<br />
Seneca<br />
Serrano<br />
Shawnee<br />
Shoshonl<br />
Sioux<br />
XJte<br />
Walapai<br />
Yaqm<br />
Yavapai<br />
Yuki<br />
Yuma<br />
Yuma Apache.<br />
Zunl<br />
Not reported..<br />
Abkansas<br />
Not reported.<br />
Califoenia<br />
Apache<br />
Arapaho<br />
Bannock<br />
Blackfeet<br />
Cayuse<br />
Chemehuevi<br />
Cherokee<br />
Chetco<br />
Chimariko<br />
Chippewa<br />
Chomimni<br />
Chookim<strong>in</strong>ah . .<br />
Chukdiami<br />
Clear Lake<br />
Coast Yukl<br />
Cocopa<br />
Creek<br />
Crow<br />
Delaware<br />
Diegueno<br />
Gabrieleno<br />
Oynomehro<br />
flat Creek<br />
Hopi<br />
Humboldt Bay.<br />
Hupa<br />
Isieta<br />
Juaneno<br />
Kai-Pomo<br />
Kashowoo<br />
Kawaiisu<br />
Kawla<br />
Kem River<br />
Kiowa<br />
Klamath<br />
L^una<br />
Little Lake<br />
.<br />
67<br />
185<br />
658<br />
29,201<br />
4,652<br />
2,344<br />
24<br />
490<br />
1,087<br />
655<br />
52<br />
28<br />
4<br />
1<br />
1<br />
2<br />
229<br />
174<br />
1,941<br />
1<br />
4<br />
1<br />
382<br />
40<br />
2<br />
667<br />
11,001<br />
1<br />
5<br />
,785<br />
19<br />
3<br />
,167<br />
1<br />
3<br />
1<br />
1<br />
3<br />
4<br />
3<br />
1<br />
496<br />
489<br />
289<br />
1<br />
191<br />
24<br />
1<br />
498<br />
460<br />
460<br />
16,371<br />
4<br />
1<br />
4<br />
1<br />
1<br />
260<br />
34<br />
1<br />
31<br />
6<br />
18<br />
4<br />
142<br />
193<br />
15<br />
16<br />
3<br />
11<br />
3<br />
756<br />
11<br />
33<br />
240<br />
42<br />
152<br />
617<br />
3<br />
16<br />
51<br />
4<br />
23<br />
754<br />
105<br />
1<br />
16<br />
19<br />
84<br />
Caufornia—Cont<strong>in</strong>ued.<br />
Lower Lake<br />
Maidu<br />
Maricopa<br />
Mar<strong>in</strong><br />
Mattole<br />
Miami<br />
Middle Town<br />
Mlwok<br />
Modoc<br />
Mohave<br />
Mono . . . :<br />
Navajo<br />
Nomelaki<br />
Omaha<br />
Orleans<br />
Paiute<br />
Panamtnt<br />
Papago.:<br />
Patwm<br />
Paviotso<br />
Peoria<br />
Pima<br />
Pit River<br />
Porno<br />
Potawatomi<br />
Quapaw<br />
Redwood-Huchnom..<br />
Redwood-Whlikut . .<br />
Rogue River<br />
San Antonio<br />
San Luis Obispo.<br />
SanLulseno<br />
Santa Barbareno.<br />
Santa Cruz<br />
Santa Ynez<br />
Sem<strong>in</strong>ole<br />
Seneca<br />
Serrano<br />
Shasta<br />
Shoshonl<br />
Sioux<br />
Tachl<br />
Tehaohapi<br />
Tolowa<br />
Umpqua<br />
Wailaki<br />
Walapai<br />
Wappo<br />
Wasco<br />
Washo<br />
Wechikhit<br />
Weitspec<br />
Wikchamni<br />
W<strong>in</strong>nebago<br />
W<strong>in</strong>tun<br />
Wy<strong>and</strong>ot<br />
Yakima<br />
Yana<br />
Yaqui<br />
Yokuts<br />
YowdancU<br />
Yuki<br />
Yuma<br />
Not reported<br />
Colorado.<br />
Apache<br />
Catawba<br />
Cherokee<br />
Cheyeime<br />
Creek<br />
Navajo<br />
Ute Capote Ute<br />
Moache Ute<br />
Sou<strong>the</strong>rn Ute<br />
Ute<br />
Wim<strong>in</strong>uchi Ute..<br />
Not reported<br />
Connecticut.<br />
Mohegan<br />
Narraganset<br />
Niantic<br />
Pequot....;..<br />
Not reported.<br />
Delaware<br />
— .<br />
Not reported<br />
District of Columbia.<br />
Chippewa<br />
Crow<br />
M<strong>and</strong>an<br />
YuchL<br />
Not reported.<br />
.<br />
Number.<br />
96<br />
1,098<br />
4<br />
22<br />
34<br />
1<br />
7<br />
669<br />
20<br />
389<br />
1,388<br />
20<br />
122<br />
2<br />
775<br />
210<br />
9<br />
6<br />
186<br />
101<br />
1<br />
776<br />
1<br />
1<br />
15<br />
74<br />
9<br />
6<br />
16<br />
1<br />
467<br />
2<br />
17<br />
35<br />
1<br />
6<br />
115<br />
255<br />
33<br />
3<br />
27<br />
2<br />
118<br />
1<br />
217<br />
2<br />
73<br />
1<br />
273<br />
1,482<br />
Ploeida.<br />
state <strong>and</strong> tribe.<br />
Mohawk<br />
Sem<strong>in</strong>ole<br />
Not reported.<br />
Georgia<br />
Idaho..<br />
Not reported.<br />
. . .<br />
Bannock<br />
Bro<strong>the</strong>rton<br />
Cayuse<br />
Cherokee<br />
Coeur d'Alene.<br />
Colville<br />
Cree<br />
Delaware<br />
Fla<strong>the</strong>ad<br />
Kaiispel<br />
Kutenai<br />
Modoc<br />
Mohawk<br />
Nez Peroes<br />
Ok<strong>in</strong>agan<br />
Paviotso<br />
Piegan<br />
Shoshonl<br />
Spokan<br />
Umatilla<br />
Wallawalla<br />
Warm Spr<strong>in</strong>gs.<br />
Wy<strong>and</strong>ot<br />
Yakima<br />
Not reported. .<br />
Ill<strong>in</strong>ois..<br />
Teton Sioux-Oglala Sioux<br />
Tuscarora<br />
Not reported<br />
INDIANA.<br />
Iowa.<br />
Delaware<br />
Miami<br />
Penobscot<br />
Wea ,<br />
Not reported.<br />
Potawatomi<br />
Sauk <strong>and</strong> Fox.<br />
Sioux<br />
'.<br />
Wumebago<br />
Not reported. .<br />
Kansas..<br />
Apache<br />
Arapaho<br />
Arikara<br />
Ass<strong>in</strong>ibo<strong>in</strong><br />
Caddo<br />
Cayuga<br />
Cayuse<br />
Cherokee<br />
Cheyenne<br />
Chickasaw<br />
Chippewa<br />
Choctaw<br />
Comanche<br />
Cree<br />
Creek<br />
Crow<br />
Delaware<br />
Fla<strong>the</strong>ad<br />
Gros Ventres<br />
Hidatsa<br />
Hopi<br />
Hupa<br />
Iowa<br />
Isieta<br />
Kaiispel<br />
Kansa<br />
Kiclcapoo<br />
Kiowa<br />
Klamath<br />
Little Lake<br />
Menom<strong>in</strong>ee<br />
Mlescalero Apache.<br />
Miami<br />
Modoc<br />
Molala<br />
Munsee<br />
Navajo<br />
Nez Perees<br />
Omaha<br />
Oneida<br />
Number.<br />
3,488<br />
363<br />
2<br />
4<br />
8<br />
284<br />
17<br />
2<br />
4<br />
6<br />
15<br />
107<br />
1<br />
»2<br />
1,035<br />
1<br />
152<br />
3<br />
1,259<br />
96<br />
22<br />
1<br />
4<br />
1<br />
12<br />
87<br />
188<br />
1<br />
179<br />
279<br />
2<br />
90<br />
1<br />
2<br />
184<br />
471<br />
6<br />
257<br />
7<br />
32<br />
169<br />
2,444<br />
1<br />
6<br />
5<br />
1<br />
1<br />
71<br />
5<br />
4<br />
92<br />
11<br />
7<br />
1<br />
33<br />
14<br />
14<br />
1<br />
1<br />
1<br />
2<br />
6<br />
124<br />
1<br />
2<br />
6<br />
211<br />
17<br />
2<br />
6<br />
4<br />
4<br />
8<br />
1<br />
1<br />
41<br />
8<br />
1<br />
11<br />
26<br />
STATE AND TRIBE. Number.<br />
Kansas—Cont<strong>in</strong>ued<br />
Osage<br />
Oto<br />
Ottawa<br />
Paiute<br />
Papago<br />
Pawnee<br />
• Peoria<br />
Pima<br />
Ponca<br />
Potawatomi<br />
Puyailup<br />
Quapaw<br />
Bogue River<br />
Sauk <strong>and</strong> Fox<br />
Sem<strong>in</strong>ole<br />
Seneca<br />
Shawnee<br />
Shoshonl<br />
Sioux<br />
Sisseton Sioux<br />
Stockbridges<br />
Teton Sioux<br />
Brule Sioux<br />
Oglala Sioux<br />
Sans Arc Sioux..<br />
Teton Sioux<br />
Tillamook<br />
Tuscarora<br />
Ute Sou<strong>the</strong>rn Ute...<br />
Ute<br />
Wasco<br />
Washo<br />
Wichita<br />
W<strong>in</strong>nebago<br />
Wy<strong>and</strong>ot<br />
Yakima<br />
Yankton Sioux<br />
Yanktonai Sioux<br />
Not reported<br />
Kentucky<br />
Not reported.<br />
Louisiana.<br />
Alibamu<br />
Cherokee<br />
Chitimacha.,<br />
Choctaw<br />
Koasati<br />
Tunica<br />
Not reported.<br />
Ma<strong>in</strong>e.<br />
Abnaki<br />
Chippewa<br />
Malecite<br />
Micmac<br />
Mohawk<br />
Passamaquoddy<br />
Penobscot<br />
St. Regis<br />
Not reported<br />
Maryl<strong>and</strong><br />
Not reported.<br />
Massachusetts. .<br />
Blackfeet<br />
Malecite<br />
Mashpee<br />
Micmac<br />
Narraganset-<br />
Pequot<br />
Wampanoag<br />
Not reported.<br />
Michigan.<br />
Bro<strong>the</strong>rton..<br />
Cherokee<br />
Chippewa. .<br />
Cree<br />
Iowa<br />
Menom<strong>in</strong>ee..<br />
Miami<br />
Mohawk<br />
Oneida..<br />
Ottawa<br />
Potawatomi<br />
. .<br />
. . .<br />
Sauk <strong>and</strong> Fox.<br />
Sioux<br />
Tuscarora<br />
Not reported. .<br />
12<br />
6<br />
14<br />
2<br />
3<br />
14<br />
3<br />
5<br />
42<br />
819<br />
3<br />
6<br />
3<br />
69<br />
8<br />
7<br />
14<br />
1<br />
40<br />
6<br />
1<br />
34<br />
4<br />
4<br />
2<br />
24<br />
1<br />
1<br />
12<br />
1<br />
11<br />
3<br />
1<br />
4<br />
5<br />
21<br />
6<br />
11<br />
2<br />
500<br />
234<br />
~234<br />
780<br />
111<br />
1<br />
60<br />
115<br />
85-<br />
43<br />
375<br />
7<br />
1<br />
133<br />
23<br />
1<br />
381<br />
253<br />
1<br />
87<br />
55<br />
65<br />
1<br />
3<br />
201<br />
21<br />
2<br />
17<br />
152<br />
291<br />
7,519<br />
2<br />
3<br />
,725<br />
28<br />
1<br />
34<br />
2<br />
5<br />
10<br />
1<br />
!.454<br />
461<br />
1<br />
1<br />
1<br />
790
POPULATION. 23<br />
INDIAN POPULATION OF THE DIFFEEENT STATES, BY TRIBES: <strong>1910</strong>—Cont<strong>in</strong>ued.<br />
[Under "Not reported" are <strong>in</strong>cluded <strong>Indian</strong>s enumerated on tlie general <strong>population</strong> schedule only (see Table 3, p. 11) forwhom no <strong>in</strong>quiry as to stock or tribe was made, or<br />
<strong>Indian</strong>s for whom special schedules were obta<strong>in</strong>ed but whose stock or tribe was not reported.]<br />
Table 10—Cont<strong>in</strong>ued.<br />
STATE AND TKIBE. Number.<br />
M<strong>in</strong>nesota .<br />
Bro<strong>the</strong>rton<br />
Cherokee<br />
Chippewa<br />
Cree<br />
Creek<br />
Crow<br />
Laguna<br />
Menom<strong>in</strong>ee<br />
Micmac<br />
Oneida<br />
Onondaga<br />
Potawatomi.<br />
Santee Sioux<br />
Sioux<br />
Sisseton Sioux<br />
Stockbridges<br />
Teton Sioux— Oglala<br />
Sioux<br />
W<strong>in</strong>nebago<br />
Not reported<br />
MiSSISSIFFI.<br />
Chippewa<br />
Choctaw<br />
Creek<br />
Cte<br />
Not reported.<br />
Missotmi.<br />
Apache<br />
Cherokee<br />
Cheyenne<br />
Chippewa<br />
Creek<br />
Miami.<br />
ModOR<br />
Paviotso<br />
Peoria<br />
Sauk aadFox..<br />
Slmwncc<br />
Sioux<br />
Not reported..<br />
Montana.<br />
Arapaho<br />
Arikara<br />
Ass<strong>in</strong>ibo<strong>in</strong><br />
Baimock<br />
Blackteet<br />
Cayu«<br />
Cherokee<br />
Cheyenne<br />
Ch<strong>in</strong>ook<br />
Chippewa<br />
Colvflle<br />
Cree<br />
Creek<br />
Crow<br />
Delaware<br />
Fla<strong>the</strong>ad<br />
Qros Ventres<br />
Hidatsa<br />
Kallspel<br />
Kiowa<br />
Kutenai<br />
M<strong>and</strong>an<br />
Nes Perces<br />
Oldnagan<br />
Paiute<br />
Paviotso<br />
Pawnee<br />
Piegan<br />
Potawatomi<br />
Santee Sioux<br />
Seneca<br />
Shawnee<br />
Shoshoni<br />
Sioux<br />
Sisseton Sioux<br />
Spokon<br />
Teton Sioux<br />
Oglala Sioux..<br />
Teton Sioux..<br />
Umatilla<br />
Vte<br />
Warm Spr<strong>in</strong>gs<br />
Yakima<br />
Yankton Sioux...<br />
Yanktonai Sioux..<br />
Not reported<br />
Nebbasea.<br />
Arikara<br />
Bannock. .<br />
Blaclcfeet..<br />
Cbe.venne..<br />
Chippewa.<br />
Creek<br />
,<br />
9,033<br />
3<br />
2<br />
1,234<br />
1<br />
2<br />
1<br />
3<br />
13<br />
1<br />
7<br />
1<br />
1<br />
232<br />
161<br />
63<br />
5<br />
314<br />
1,253<br />
1<br />
1,162<br />
6<br />
2<br />
82<br />
313<br />
1<br />
13<br />
2<br />
1<br />
2<br />
1<br />
10<br />
2<br />
5<br />
5<br />
14<br />
11<br />
246<br />
10,745<br />
18<br />
4<br />
1,229<br />
23<br />
33<br />
2<br />
12<br />
1,346<br />
12<br />
486<br />
17<br />
309<br />
34<br />
1,698<br />
1<br />
400<br />
503<br />
1<br />
424<br />
5<br />
54<br />
2<br />
1<br />
26<br />
2<br />
2,221<br />
1<br />
107<br />
1<br />
1<br />
10<br />
86<br />
.255<br />
134<br />
40<br />
10<br />
1<br />
1<br />
1<br />
372<br />
1<br />
440<br />
3,502<br />
STATE AND TH<strong>in</strong>E. Number.<br />
Nebr-aska—Cont<strong>in</strong>ued.<br />
Fla<strong>the</strong>ad<br />
Iowa<br />
Kalispel<br />
Kidcapob<br />
Koasati<br />
Kutenai<br />
Malecite<br />
Menom<strong>in</strong>ee<br />
Omaha<br />
Oneida<br />
Oto<br />
Ottawa<br />
Passamaquoddy<br />
Pawnee<br />
Penobscot<br />
Piegan<br />
Ponca<br />
Potawatomi<br />
Quapaw<br />
Santfie Sioux<br />
Sauk <strong>and</strong> Fox<br />
Shoshoni<br />
Sioux<br />
Sisseton Sioux<br />
Teton Sioux<br />
Oglala Sioux...<br />
Teton Sioux<br />
W<strong>in</strong>nebago<br />
Wy<strong>and</strong>ot<br />
Yankton Sioux<br />
Not reported<br />
Nevada.<br />
Apaohe—White Mounta<strong>in</strong><br />
Apache<br />
Bannock ,<br />
Chemehuevi<br />
Creek<br />
Maidu<br />
Mlwok<br />
Uohave<br />
Mono<br />
Paiute<br />
Pamam<strong>in</strong>t<br />
Papago<br />
Paviotso<br />
PitEiver...<br />
Shoshoni<br />
Sisseton Sioux<br />
Teton Sioux<br />
Ute<br />
Washo<br />
W<strong>in</strong>tun<br />
Not reported<br />
New Hampshire.<br />
Penobscot<br />
Not reported..<br />
New Jersey<br />
Sioux<br />
Not reported.<br />
New Mexico—<br />
Acoma<br />
Apache<br />
Cherokee<br />
Cochiti<br />
Hopi<br />
Isleta<br />
Jemez<br />
Jicarilla Apache<br />
Laguna<br />
Lipan Apache<br />
Me.
24<br />
INDIANS IN THE UNITED STATES.<br />
INDIAN POPULATION OF THE DIFFERENT STATES, BY TRIBES: <strong>1910</strong>—Cont<strong>in</strong>ued.<br />
[Under "Not reported" are <strong>in</strong>cludedI <strong>Indian</strong>s enumerated on <strong>the</strong> <strong>the</strong>^general general <strong>population</strong> schedule only (see Table Tables, 3, p. 11) for whom no <strong>in</strong>qi Inquiry as to stock or tribe was made.<br />
or <strong>Indian</strong>s for whom special schedules were obta<strong>in</strong>ed but whose stock or tribe was not reported.]<br />
Table 10—Cont<strong>in</strong>ued.<br />
STATE AND TKIBE.<br />
Obegon—Cont<strong>in</strong>ued,<br />
Munsee<br />
Nez Peroes<br />
Nisqualll<br />
Ok<strong>in</strong>agan..'<br />
Oto<br />
Paloos<br />
Paviotso<br />
Piegan<br />
Pima<br />
Pit River<br />
Potawatomi<br />
Puyallup<br />
Qumaielt<br />
Rogue River<br />
Banpoil<br />
Bantee Sioux<br />
Santiam<br />
Seneca<br />
Shasta<br />
Sioux<br />
Siuslaw<br />
Skokomlsh.<br />
Snohomish.<br />
Spokan<br />
Suquamish<br />
Tenankutch<strong>in</strong><br />
Tillamook<br />
Tolowa<br />
Tsimshian<br />
Umatilla<br />
Umpqua<br />
Upper Coquille .<br />
WallawaUa<br />
Wapato<br />
Warm Spr<strong>in</strong>gs...<br />
Wasco<br />
Washo<br />
W<strong>in</strong>nebago<br />
Yakima.<br />
Yamel<br />
YaquJna<br />
Yonkalla<br />
Yukl<br />
Znni<br />
Not reported<br />
Pennsyivania<br />
Abnaki<br />
Apache<br />
Arapaho<br />
Arikara<br />
Ass<strong>in</strong>ibo<strong>in</strong><br />
Bannock<br />
Caddo<br />
Catawba...:<br />
Cayuga<br />
Cayuso<br />
Cherokee<br />
Chetco<br />
Cheyemie<br />
Chippewa<br />
Chitimacha<br />
Clallam<br />
Coeurd'Alene<br />
Colville<br />
Comanche<br />
Crow<br />
Delaware<br />
Hidatsa<br />
Hopi<br />
Iowa<br />
Klamath<br />
Lipan Apache. . . -<br />
Little Lake<br />
Lummi<br />
Mashpee<br />
Menom<strong>in</strong>ee<br />
Miami<br />
Modoc<br />
Mohave<br />
Mohawk<br />
Munsee<br />
Narraganset<br />
Navajo<br />
NezPerces<br />
Nomelakl<br />
Oidnagan.<br />
Omaha<br />
Oneida<br />
Onondaga<br />
Osage<br />
Ottawa<br />
Paiute<br />
Pawnee<br />
Pecos<br />
Penobscot<br />
Peoria<br />
Piegan<br />
Pima<br />
Pit River<br />
Fonca<br />
Potawatomi<br />
.<br />
.'..<br />
Number.<br />
1<br />
58<br />
8<br />
11<br />
1<br />
7<br />
341<br />
2<br />
1<br />
81<br />
1<br />
21<br />
1<br />
368<br />
1<br />
1<br />
1<br />
7<br />
2<br />
3<br />
28<br />
1<br />
1<br />
18<br />
3<br />
14<br />
152<br />
90<br />
15<br />
8<br />
390<br />
17<br />
502<br />
184<br />
S<br />
2<br />
62<br />
4<br />
13<br />
11<br />
3<br />
2<br />
664<br />
1,503<br />
3<br />
3<br />
1<br />
5<br />
8<br />
1<br />
10<br />
2<br />
SO<br />
1<br />
33<br />
134<br />
19<br />
2<br />
1<br />
9-<br />
4<br />
6<br />
7<br />
10<br />
13<br />
1<br />
23<br />
1<br />
3<br />
2<br />
5<br />
9<br />
1<br />
2<br />
1<br />
3<br />
2<br />
1<br />
13<br />
31<br />
3<br />
2<br />
11<br />
40<br />
33<br />
7<br />
6<br />
5<br />
18<br />
1<br />
3<br />
1<br />
12<br />
2<br />
1<br />
3<br />
3<br />
STATE AND TRIBE.<br />
Pennsylvania—Cont<strong>in</strong>ued,<br />
Puyallup<br />
Quapaw<br />
St. Regis<br />
San Juan<br />
Sanpoil<br />
Sauk <strong>and</strong> Fox<br />
Sem<strong>in</strong>ole<br />
Seneca<br />
Serrano<br />
Shawnee<br />
Shoshonl ,<br />
Sioux<br />
Spokan<br />
Stockbridges<br />
Teton Sioux—Sihasapa<br />
Tuscarora<br />
Umatilla<br />
Umpqua<br />
Wampanoag<br />
Washo<br />
Wichita<br />
W<strong>in</strong>nebago<br />
Wy<strong>and</strong>ot<br />
Yuma<br />
Not reported<br />
Rhode Isl<strong>and</strong><br />
Not reported<br />
SoTTTH Carol<strong>in</strong>a<br />
Catawba<br />
Cherokee<br />
Oneida<br />
Not reported<br />
South Dakota<br />
Alsea<br />
Apache<br />
Arapaho<br />
Arikara<br />
Ass<strong>in</strong>ibo<strong>in</strong><br />
Banhock<br />
Blackieet<br />
Caddo<br />
Cayuse<br />
Cherokee<br />
Cheyenne<br />
Chickasaw<br />
Chippewa<br />
• Choctaw<br />
ClaUam<br />
Clatsop<br />
Creek<br />
Crow<br />
Delaware<br />
Gros Ventres<br />
Hidatsa<br />
Hopi<br />
Kutenai<br />
Laguna<br />
M<strong>and</strong>an<br />
Menom<strong>in</strong>ee<br />
Navajo<br />
Nez Perces<br />
Oneida<br />
Onondaga<br />
Osage<br />
Paiute<br />
Papago<br />
Pawnee<br />
Peoria<br />
Ponca<br />
Potawatomi<br />
Quapaw<br />
Santiee Sioux<br />
Sauk <strong>and</strong> Pox<br />
Seneca<br />
Shawnee<br />
Shoshoni<br />
Sioux<br />
Sisseton Sioux<br />
Stockbridges<br />
Teton Sioux<br />
Brule Sioux<br />
. ,<br />
--.<br />
Hunkpapa Sioux . .<br />
M<strong>in</strong>niconjou Sioux.<br />
Oglala Sioux<br />
Sans Arc Sioux<br />
Sihasapa<br />
Teton Sioux<br />
Two Kettle Sioux...<br />
Umatilla<br />
Ute<br />
Wichita<br />
Wiimebago<br />
Wy<strong>and</strong>ot<br />
Yankton Sioux<br />
Yanktonai Sioux<br />
Not reported<br />
Number.<br />
1<br />
1<br />
77<br />
1<br />
1<br />
14<br />
1<br />
184<br />
2<br />
4<br />
27<br />
6<br />
1<br />
15<br />
2<br />
1<br />
10<br />
3<br />
15<br />
17<br />
2<br />
1<br />
438<br />
284<br />
284<br />
331<br />
87<br />
2<br />
143<br />
19,137<br />
7<br />
133<br />
1<br />
73<br />
8<br />
1<br />
1<br />
9<br />
63<br />
1<br />
2<br />
1<br />
2<br />
3<br />
4<br />
5<br />
3<br />
4<br />
1<br />
7<br />
1<br />
4<br />
2<br />
1<br />
5<br />
1<br />
18<br />
10<br />
1<br />
378<br />
1<br />
2<br />
2<br />
2<br />
277<br />
1,553<br />
3<br />
13,795<br />
795<br />
930<br />
387<br />
5,998<br />
213<br />
346<br />
4,838<br />
288<br />
1<br />
4<br />
20<br />
1,534<br />
803<br />
372<br />
STATE AND TRIBE.<br />
Tennessee<br />
Texas<br />
Utah<br />
Cherokee<br />
Chickasaw<br />
Choctaw<br />
Credr ,<br />
Osage<br />
Sauk <strong>and</strong> Fox ,<br />
Not reported ,<br />
Alibamu<br />
Creek<br />
Isleta<br />
Koasati<br />
Sem<strong>in</strong>ole<br />
Not reported<br />
Bannock<br />
',<br />
Chippewa<br />
Navajo<br />
Pahvant<br />
Paiute<br />
Shoshoni<br />
Sioux<br />
Ute<br />
Capote Ute<br />
Gr<strong>and</strong> River Ute...<br />
Moache Ute<br />
U<strong>in</strong>ta Ute<br />
Uncompahgre Ute.<br />
Ute<br />
White River Ute...<br />
Not reported<br />
Vermont<br />
Not reported<br />
Virg<strong>in</strong>ia<br />
Catawba<br />
Cherokee<br />
Chickahom<strong>in</strong>y<br />
Choctaw<br />
Mattapony<br />
Pamunkey<br />
Powhatan<br />
Not reported<br />
Wash<strong>in</strong>gton<br />
Alsea<br />
BeUacoola<br />
Cayuse<br />
Chehalis<br />
Cherokee<br />
"Chimakum<br />
Ch<strong>in</strong>ook<br />
Chippewa<br />
Clackamas<br />
Clallam<br />
Clatsop<br />
Coeur d'Alene<br />
Columbia<br />
Colville<br />
Comox<br />
Cowichan<br />
Cowlitz<br />
Cree ,<br />
Dwamish<br />
Fla<strong>the</strong>ad<br />
Haida<br />
Hob<br />
Hupa<br />
Kalispel<br />
Kitamat<br />
Klamath<br />
KUkitat<br />
Kutenai<br />
Kwakiutl<br />
Laguna<br />
Lummi.<br />
Makah<br />
Methow<br />
Missouri<br />
Modoc<br />
Molala<br />
Muckleshoot<br />
Nespelim<br />
Nez Perces<br />
NisquaUi<br />
Nooksak<br />
Nootka<br />
Ok<strong>in</strong>agan<br />
Paiute<br />
Paloos<br />
Paviotso<br />
Number.<br />
216<br />
45<br />
3<br />
4<br />
2<br />
1<br />
6<br />
155<br />
702<br />
187<br />
1<br />
34<br />
11<br />
200<br />
3,123<br />
1<br />
1<br />
1,039<br />
37<br />
238<br />
248<br />
2<br />
1,472<br />
4<br />
1<br />
1<br />
373<br />
412<br />
362<br />
319<br />
85<br />
26<br />
26<br />
539<br />
4<br />
19<br />
115<br />
8<br />
1<br />
83<br />
131<br />
178<br />
10,997<br />
1<br />
2<br />
6<br />
279<br />
8<br />
3<br />
177<br />
6<br />
1<br />
383<br />
18<br />
4<br />
333<br />
717<br />
1<br />
62<br />
105<br />
91<br />
19<br />
46<br />
6<br />
44<br />
11<br />
157<br />
1<br />
4<br />
370<br />
1<br />
1<br />
1<br />
348<br />
354<br />
14<br />
1<br />
1<br />
5<br />
191<br />
•46<br />
79<br />
129<br />
85<br />
15<br />
256<br />
5<br />
75<br />
2<br />
STATE ADD TRIBE.<br />
Wash<strong>in</strong>qton—Cont<strong>in</strong>ued<br />
Pisquow<br />
Potawatomi<br />
Puyallup<br />
Quileute<br />
Qu<strong>in</strong>aielt<br />
Redwood-Whilkut. .<br />
Rogue River<br />
San Juan<br />
Sanpoil<br />
Sauk <strong>and</strong> Fox<br />
Shasta<br />
Shuswap<br />
Sioux<br />
Skagit<br />
Skokomish<br />
Snohomish<br />
Snoqualmu<br />
Songish<br />
Spokan<br />
Squaxon<br />
Stockbridges<br />
Suquamish<br />
Swmomish<br />
Takelma<br />
Tillamook<br />
Tlatskanai<br />
Top<strong>in</strong>lsh<br />
Tsimshian<br />
Twana<br />
Umatilla<br />
Umpqua<br />
Waflaki<br />
Walapai<br />
WallawaUa<br />
Wapato<br />
Warm Spr<strong>in</strong>gs<br />
Wasco<br />
Washo<br />
Wikohamni<br />
Wiimebago<br />
Wishram<br />
Yakima<br />
Yamel<br />
Yankton Sioux<br />
Yaqu<strong>in</strong>a<br />
Not reported<br />
West Virg<strong>in</strong>ia<br />
Not reported j .<br />
Wiscons<strong>in</strong><br />
Abnaki<br />
Bro<strong>the</strong>rton<br />
Cherokee<br />
Chippewa<br />
Delaware<br />
Iowa<br />
Klckapoo<br />
Klamath<br />
Menom<strong>in</strong>ee<br />
Mohawk<br />
Montauk<br />
Narraganset '.<br />
Oneida<br />
Onondaga<br />
Osage<br />
Oto<br />
Ottawa<br />
Potawatomi<br />
Santee Sioux<br />
Sauk <strong>and</strong> Fox<br />
Seneca<br />
Sioux<br />
Stockbridges<br />
Teton Sioux:<br />
Brule Sioux<br />
Twana<br />
W<strong>in</strong>nebago<br />
Not reported<br />
Wyom<strong>in</strong>g<br />
Apache<br />
Arapaho<br />
Bannock<br />
Chemehuevl<br />
Chevenne<br />
Gros Ventres<br />
Hidatsa<br />
Navajo<br />
Oneida<br />
Paiute<br />
Piegan. ,<br />
Potawatomi<br />
Shoshoni<br />
Sioux<br />
Ute<br />
Yankton Sioux<br />
Not reported<br />
. .<br />
Number.<br />
62<br />
1<br />
278<br />
259<br />
287<br />
2<br />
3<br />
2<br />
238<br />
8 2<br />
9<br />
2<br />
S6<br />
193<br />
661<br />
93<br />
23<br />
379<br />
44<br />
2<br />
306<br />
333<br />
1<br />
6<br />
3<br />
47<br />
37<br />
60<br />
85<br />
17<br />
2<br />
3<br />
6<br />
27<br />
43<br />
54<br />
1<br />
1<br />
1<br />
274<br />
1,279<br />
4<br />
6<br />
1,342<br />
36<br />
3&<br />
10,142<br />
2<br />
162<br />
14<br />
4,299<br />
4<br />
1<br />
1<br />
1<br />
1,350<br />
12<br />
21<br />
g<br />
2,107<br />
1<br />
1<br />
60'<br />
245<br />
13<br />
1<br />
2<br />
1»<br />
502<br />
2<br />
1<br />
735<br />
588-<br />
1,486<br />
1<br />
703<br />
9<br />
7<br />
3 1<br />
&<br />
4<br />
1<br />
1<br />
3<br />
1<br />
700<br />
9<br />
6<br />
2<br />
29
Table 11 co<strong>in</strong>iTT.<br />
Alabaua.<br />
Autauga<br />
Bartour<br />
Blount<br />
Bullock<br />
Calhoun<br />
Chambers<br />
Cherokee<br />
Choctaw<br />
Clarke<br />
Cofflee<br />
Colbert<br />
Conecuh<br />
Cov<strong>in</strong>gton<br />
Crenshaw<br />
Dallas<br />
Dekalb<br />
Escambia<br />
Greene<br />
Jackson<br />
Jefferson<br />
Lawrence<br />
Limestone<br />
Lowndes<br />
Madison<br />
Marengo<br />
Marshall<br />
Mobile<br />
Monroe<br />
Montgomery<br />
. .<br />
Morgan<br />
Perry<br />
Pike<br />
Bussell<br />
Shelby<br />
Tallapoosa...<br />
Wash<strong>in</strong>gton..<br />
Abizona.<br />
Apache<br />
Cochise<br />
Cocon<strong>in</strong>o...<br />
Glte<br />
Oraham<br />
Maricopa...<br />
Mohave<br />
Navajo<br />
Pima<br />
P<strong>in</strong>al<br />
Santa Cruz.<br />
Yavapai<br />
Yuma<br />
Arkansas..<br />
—<br />
Arkansas...<br />
Benton<br />
Boone<br />
Calhoun<br />
Carroll<br />
Chicot.,<br />
Clark<br />
Clay<br />
Cleburne. .<br />
Clevel<strong>and</strong>..<br />
Columbia...<br />
Crawford...<br />
Crittenden.<br />
Dallas<br />
Desha<br />
Drew<br />
Faulkner<br />
iS'aDkl<strong>in</strong><br />
Fulton<br />
Garl<strong>and</strong><br />
Grant<br />
Hempstead<br />
Howard<br />
Independence.<br />
Jackson<br />
Jefferson<br />
Johnson<br />
Lafayette<br />
Lee<br />
L<strong>in</strong>coln<br />
Little River...<br />
Logan<br />
liOnoke<br />
Miller<br />
Mississippi<br />
Montgomery..<br />
Nevada<br />
Ouachita<br />
Pike<br />
FulaskL<br />
POPULATION. 25<br />
INDIAN POPULATION OP THE UNITED STATES, BY COUNTIES: <strong>1910</strong>, 1900, AND 1890.<br />
<strong>1910</strong> 1900 1S90<br />
909<br />
118<br />
163<br />
116<br />
6<br />
5<br />
7<br />
291<br />
3<br />
172<br />
29,201<br />
6,131<br />
26<br />
2,788<br />
2,508<br />
450<br />
3,099<br />
541<br />
5,752<br />
3,495<br />
3,139<br />
6<br />
479<br />
787<br />
460<br />
11<br />
167<br />
143<br />
177<br />
10<br />
2 26,480<br />
5,540<br />
11<br />
1,206<br />
729<br />
34<br />
3,084<br />
1,237<br />
6,099<br />
2,662<br />
2,999<br />
268<br />
683<br />
66<br />
' 1, 143<br />
116<br />
2<br />
2<br />
3<br />
1<br />
3<br />
3<br />
173<br />
1<br />
7<br />
8<br />
1<br />
1<br />
2<br />
6<br />
4<br />
402<br />
3<br />
1<br />
8 29,981<br />
904<br />
138<br />
27<br />
424<br />
47<br />
Abkansas—Cont<strong>in</strong>ued.<br />
R<strong>and</strong>olph<br />
St. Francis<br />
Sal<strong>in</strong>e<br />
Scott<br />
Searcy<br />
Sebastian<br />
Sevier<br />
Sharp<br />
Union<br />
Wash<strong>in</strong>gton<br />
White<br />
Yell<br />
California.<br />
Alameda<br />
Alp<strong>in</strong>e<br />
Amador<br />
Butte<br />
Calaveras<br />
Colusa<br />
Contra Costa.<br />
Del Norte<br />
Eldorado<br />
Fresno<br />
Gleim<br />
Humboldt<br />
Imperial<br />
Inyo<br />
Kem<br />
Lake<br />
Lassen<br />
Los Angeles<br />
Madera<br />
Mar<strong>in</strong> ,...<br />
Mariposa<br />
Mendoc<strong>in</strong>o<br />
Merced<br />
Modoc<br />
Mono<br />
Monterey<br />
Napa<br />
Nevada<br />
Orange<br />
Placer<br />
Plumas<br />
Riverside<br />
Sacramento<br />
San Benito<br />
San Bernard<strong>in</strong>o..<br />
San Diego<br />
SanFrancfaco<br />
San Joaqu<strong>in</strong><br />
San Luis Obispo.,<br />
San Mateo<br />
Santa Barbara<br />
Santa Clara<br />
Santa Cruz<br />
Shasta<br />
Sierra<br />
Siskiyou<br />
Solano<br />
Sonoma<br />
Stanislaus<br />
Sutter<br />
Tehama<br />
Tr<strong>in</strong>ity<br />
Tulare<br />
Tuolumne<br />
Venttua<br />
Yolo<br />
Yuba<br />
Colorado.<br />
Adams<br />
Arapahoe<br />
Bent<br />
Boulder<br />
Clear Creek..<br />
Conejos<br />
Costilla<br />
Denver ;<br />
Dolores<br />
El Paso<br />
Fremont<br />
Gilp<strong>in</strong><br />
H<strong>in</strong>sdate<br />
Huerfano<br />
La Plata<br />
Lake<br />
Larimer<br />
Las Animas.<br />
Logan<br />
Mesa<br />
M<strong>in</strong>eral<br />
<strong>1910</strong> 1900<br />
16,371<br />
41<br />
94<br />
143<br />
298<br />
161<br />
337<br />
177<br />
313<br />
32<br />
1,652<br />
682<br />
792<br />
220<br />
32<br />
433<br />
410<br />
97<br />
419<br />
26<br />
192<br />
1,170<br />
646<br />
386<br />
29<br />
6<br />
52<br />
21<br />
102<br />
380<br />
1,590<br />
673<br />
1,516<br />
46<br />
8<br />
14<br />
1<br />
45<br />
16<br />
15<br />
756<br />
54<br />
1,109<br />
1<br />
340<br />
3D<br />
18<br />
94<br />
227<br />
.204<br />
186<br />
3<br />
32<br />
16<br />
1,482<br />
218<br />
16,377<br />
71<br />
142<br />
130<br />
201<br />
100<br />
121<br />
8<br />
269<br />
138<br />
620<br />
24<br />
1,728<br />
940<br />
344<br />
61<br />
428<br />
381<br />
69<br />
401<br />
25<br />
173<br />
1,363<br />
4<br />
503<br />
389<br />
26<br />
IS<br />
74<br />
444<br />
572<br />
2,197<br />
15<br />
1<br />
1<br />
1<br />
72<br />
9<br />
67<br />
862<br />
31<br />
480<br />
2<br />
316<br />
25<br />
20<br />
99<br />
234<br />
176<br />
149<br />
5<br />
28<br />
24<br />
11<br />
599<br />
4<br />
1<br />
179<br />
1<br />
1890<br />
5 16,624<br />
25<br />
224<br />
58<br />
319<br />
77<br />
277<br />
3<br />
376<br />
136<br />
347<br />
1,379<br />
860<br />
337<br />
566<br />
335<br />
144<br />
31<br />
152<br />
681<br />
30<br />
499<br />
368<br />
58<br />
15<br />
159<br />
5<br />
73<br />
374<br />
40<br />
41<br />
399<br />
478<br />
31<br />
2<br />
47<br />
6<br />
73<br />
19<br />
10<br />
693<br />
10<br />
710<br />
11<br />
297<br />
12<br />
1<br />
101<br />
193<br />
178<br />
218<br />
91<br />
41<br />
27<br />
6 1,092<br />
Colorado—Cont<strong>in</strong>ued.<br />
Montezuma<br />
Otero<br />
Park<br />
Prowers<br />
Pueblo<br />
Eio Blanco<br />
Rio Gr<strong>and</strong>e<br />
•Routt<br />
San Miguel.<br />
Teller<br />
Weld<br />
Connecticut.<br />
Fairfield<br />
Hartford<br />
Litchfield<br />
Middlesex<br />
New Haven.<br />
. .<br />
New London.<br />
Toll<strong>and</strong> ,.<br />
W<strong>in</strong>dham<br />
Delaware.<br />
Kent.:<br />
New Castle.<br />
District of Columbia.<br />
Florida..<br />
Brevard...<br />
Dade<br />
DeSoto...<br />
DuVal<br />
Escambia..<br />
HUlsboro..<br />
Jackson<br />
Lake<br />
Lee..<br />
Monroe<br />
Nassau<br />
Palm Beach.<br />
Pasco<br />
Polk<br />
Putnam<br />
St. Johns<br />
Santa Rosa..<br />
Sumter<br />
Volusia<br />
Walton<br />
Georgia.<br />
Baldw<strong>in</strong><br />
Berrien<br />
Bulloch<br />
Burke<br />
Carroll<br />
Chatham<br />
Clarke<br />
Cobb<br />
Coffee<br />
Columbia<br />
Coweta<br />
Crisp<br />
Decatur<br />
Eff<strong>in</strong>gham. .<br />
Emanuel<br />
Floyd<br />
Forsyth<br />
Fulton<br />
Glynn<br />
Gordon<br />
Hancock<br />
Haralson<br />
Harris<br />
Irw<strong>in</strong><br />
Jackson<br />
Liberty<br />
Macon<br />
Madison<br />
Meriwe<strong>the</strong>r.<br />
Miller<br />
Oglethorpe.<br />
Pickens<br />
Polk<br />
Quitman. .<br />
Rabun<br />
Richmond.<br />
Screven<br />
Spald<strong>in</strong>g...<br />
• Includes384personsspecially enumerated <strong>in</strong> 1890, not distributed by counties.<br />
, x j t, * • ,nnn<br />
a Includes 3 024 <strong>Indian</strong>s on San Carlos <strong>Indian</strong> Reservation, <strong>in</strong> GUa <strong>and</strong> Graham Counties, not returned by counties m 1900.<br />
s Includes 28,469 <strong>Indian</strong>s specially enumerated <strong>in</strong> 1890, not distributed by counties.<br />
• Includes 32 <strong>Indian</strong>s specmlly enumerated <strong>in</strong> 1890, not distributed by counties.<br />
t Includes 5,107 <strong>Indian</strong>s specially enumerated <strong>in</strong> 1890, not distributed by counties.<br />
e Includes 985 <strong>Indian</strong>s specially enumerated <strong>in</strong> 1890. not distributed by counties.<br />
<strong>1910</strong> 1900<br />
463<br />
6<br />
'358'<br />
29<br />
96<br />
11<br />
659<br />
1<br />
6<br />
33<br />
1<br />
2<br />
9<br />
22<br />
358<br />
81<br />
109<br />
1<br />
14<br />
2<br />
146<br />
19<br />
1890<br />
228.<br />
31<br />
17<br />
13<br />
5<br />
26.<br />
106<br />
'32-<br />
171<br />
"~23<br />
134<br />
3<br />
2<br />
1<br />
1<br />
1<br />
1<br />
68
26 INDIANS IN THE UNITED STATES.<br />
INDIAN POPULATION OF THE UNITED STATES, BY COUNTIES: <strong>1910</strong>, 1900, AND 1890—Cont<strong>in</strong>ued.<br />
TabI6 11—Cont<strong>in</strong>ued.<br />
COUNTY.
POPULATION.<br />
INDIAN POPULATION OP THE UNITED STATES, BY COUNTIES: <strong>1910</strong>, 1900, AND 1890—Cont<strong>in</strong>ued.<br />
Table 1 1—Contlnned.<br />
COUNTY.<br />
UASSACHCSETTS.<br />
Barnstable.<br />
Berkshire...<br />
Bristol<br />
Dukes<br />
Frankl<strong>in</strong>...<br />
Hampden.<br />
Hampsliire.<br />
Middlesex..<br />
Norfolk<br />
Plymouth.<br />
Suflolk<br />
Worcester..<br />
UlCHIQAN.<br />
Alcona...<br />
Alger<br />
Allegan.<br />
Alpena..<br />
Antrim..<br />
Arenac...<br />
Baraga...<br />
Barry<br />
Bay<br />
Benzie...<br />
Berrien..<br />
Branch..<br />
Calhoun.<br />
. . . . . .<br />
.<br />
CharleToiz.<br />
Cheboygan<br />
Chippewa..<br />
Clare<br />
Cl<strong>in</strong>ton<br />
Crawford...<br />
Delta<br />
Dick<strong>in</strong>son.<br />
Eaton<br />
Emmet<br />
Gladw<strong>in</strong><br />
Gogebic<br />
Gr<strong>and</strong> Traverse.<br />
Gratiot<br />
Sillsdale<br />
Houghton<br />
Huron<br />
Ingham :<br />
Ionia<br />
Iosco<br />
Iron<br />
Isabella<br />
Jackson<br />
Kalamazoo<br />
Kalkaska<br />
Kent<br />
Lake<br />
Lapeer<br />
Leelanau<br />
Lenawee<br />
Liv<strong>in</strong>gston<br />
Luce<br />
Mack<strong>in</strong>ac<br />
Macomb<br />
Manistee<br />
Marquette<br />
Mason<br />
Mecosta<br />
Menom<strong>in</strong>ee<br />
Midl<strong>and</strong><br />
Monroe<br />
Montcalm<br />
Montmorency<br />
Muskegon<br />
Newaygo<br />
Oakl<strong>and</strong><br />
Oceana<br />
Ogemaw<br />
Ontonagon . .<br />
Osceola<br />
Oscoda<br />
Ottawa<br />
Fresque Isle.<br />
Bosconamon..<br />
Sag<strong>in</strong>aw<br />
St. Clair<br />
St. Joseph<br />
Sanilac<br />
Schoolcralt...<br />
Shiawassee...<br />
Tuscola<br />
Von Buren. .<br />
Washtenaw.<br />
Wayne<br />
Wexford<br />
<strong>1910</strong><br />
68S<br />
272<br />
1<br />
40<br />
147<br />
6<br />
7,519<br />
SO<br />
28<br />
156<br />
8<br />
592<br />
119<br />
140<br />
26<br />
3<br />
68<br />
132<br />
334<br />
199<br />
35<br />
47<br />
502<br />
2<br />
4<br />
74<br />
4<br />
4<br />
1<br />
454<br />
17<br />
1<br />
7<br />
990<br />
16<br />
24<br />
37<br />
30S<br />
39<br />
101<br />
35<br />
281<br />
42<br />
2<br />
21<br />
18<br />
i<br />
6<br />
141<br />
15<br />
1<br />
3<br />
38<br />
112<br />
4<br />
41<br />
34<br />
1900<br />
687<br />
231<br />
3<br />
154<br />
3<br />
6,354<br />
62<br />
106<br />
173<br />
118<br />
488<br />
162<br />
50<br />
6<br />
4<br />
83<br />
68<br />
321<br />
182<br />
449<br />
19<br />
4<br />
247<br />
54<br />
56<br />
1<br />
666<br />
46<br />
2<br />
12<br />
13<br />
515<br />
275<br />
2<br />
61<br />
319<br />
38<br />
101<br />
50<br />
250<br />
32<br />
27<br />
16<br />
130<br />
1<br />
32<br />
1890<br />
1428<br />
146<br />
9<br />
13<br />
133<br />
2<br />
1<br />
13<br />
3<br />
19<br />
8<br />
27<br />
29<br />
21<br />
2 5,625<br />
184<br />
120<br />
287<br />
1<br />
32<br />
71<br />
35<br />
222<br />
132<br />
441<br />
3<br />
1<br />
10<br />
217<br />
7<br />
914<br />
17<br />
10<br />
1<br />
35<br />
50<br />
2<br />
356<br />
22<br />
295<br />
13<br />
1<br />
1<br />
227<br />
22<br />
56<br />
335<br />
44<br />
129<br />
4<br />
16<br />
14<br />
32<br />
18<br />
10<br />
271<br />
4<br />
69<br />
24<br />
3<br />
51<br />
13<br />
232<br />
8<br />
11<br />
1<br />
42<br />
M<strong>in</strong>nesota.<br />
Aitk<strong>in</strong><br />
Becker<br />
Beltr»mi<br />
Benton<br />
Big Stone. .<br />
Blue Earth.<br />
Carlton<br />
Chisago<br />
Clearwater<br />
Cook<br />
Crow W<strong>in</strong>g<br />
Dakota<br />
Dodge<br />
Douglas<br />
Ereebom<br />
Goodhue<br />
Hennep<strong>in</strong><br />
Hubbard<br />
Itasca<br />
Kanabec<br />
Kittson<br />
Koochich<strong>in</strong>g<br />
LacquiFarle<br />
Lake<br />
Le Sueur<br />
L<strong>in</strong>coln<br />
Mahnomen<br />
Marshall<br />
MilleLacs<br />
Morrison<br />
Murray<br />
Nicollet<br />
Otter Tail<br />
Benn<strong>in</strong>gton<br />
P<strong>in</strong>e.<br />
Pipestone<br />
Polk<br />
Ramsey<br />
Redwood<br />
Renville<br />
Bice<br />
Roseau<br />
St. Louis<br />
Scott<br />
Sherburne<br />
Stearns<br />
Steele....<br />
Stevens<br />
Swift<br />
Todd<br />
Traverse<br />
Wabasha<br />
Wadena<br />
Wash<strong>in</strong>gton<br />
W<strong>in</strong>ona<br />
Wright<br />
Yellow Medic<strong>in</strong>e..<br />
Mississippi.<br />
Adams<br />
Amite<br />
Attala<br />
Bolivar<br />
Carroll<br />
Choctaw.<br />
Claiborne<br />
Clarke<br />
Clay<br />
Coahoma<br />
Copiah<br />
Cov<strong>in</strong>gton<br />
DeSoto<br />
Frankl<strong>in</strong><br />
Greene<br />
Grenada<br />
Hancock<br />
Harrison<br />
H<strong>in</strong>ds<br />
Holmes<br />
Jackson<br />
Jasper<br />
Jefferson<br />
Jones<br />
Kemper<br />
Lauderdale...<br />
Leake<br />
Lee.<br />
Leflore<br />
Marshall.<br />
Monroe<br />
Montgomery..<br />
Neshoba.<br />
Newton<br />
Noxubee<br />
Oktibbeha....<br />
Fanola<br />
.<br />
<strong>1910</strong><br />
9,053<br />
54<br />
1,636<br />
1,402<br />
1<br />
394<br />
1,172<br />
24<br />
250<br />
220<br />
17<br />
90<br />
2<br />
6<br />
56<br />
27<br />
1<br />
225<br />
3<br />
84<br />
97<br />
1,636<br />
227<br />
7<br />
174<br />
220<br />
7<br />
10<br />
167<br />
1<br />
75<br />
30<br />
1,253<br />
484<br />
126<br />
1900<br />
'9,182<br />
138<br />
14<br />
1,416<br />
356<br />
1,429<br />
65<br />
48<br />
3<br />
632<br />
37<br />
20<br />
32<br />
166<br />
110<br />
1<br />
5<br />
38<br />
972<br />
12<br />
2,203<br />
1<br />
191<br />
1<br />
20<br />
178<br />
573<br />
435<br />
1<br />
1890<br />
< 10, 096<br />
1<br />
135<br />
52<br />
11<br />
16<br />
12<br />
101<br />
120<br />
3<br />
54<br />
18<br />
2,036<br />
1<br />
1<br />
1<br />
6<br />
1<br />
2<br />
1<br />
9<br />
2<br />
6<br />
37<br />
2<br />
39<br />
1<br />
14<br />
2<br />
1<br />
179<br />
2<br />
5<br />
34<br />
14<br />
436<br />
2<br />
623<br />
349<br />
Mississippi—Cont<strong>in</strong>ued.<br />
Pearl River<br />
Ferry<br />
Pike.<br />
Rank<strong>in</strong><br />
Scott<br />
Sharkey<br />
Smith<br />
Tallahatchie<br />
Tishom<strong>in</strong>go<br />
Warren<br />
Wayne<br />
Wilk<strong>in</strong>son<br />
W<strong>in</strong>ston<br />
Yazoo<br />
MiSSOUBI.<br />
Atchison...<br />
Audra<strong>in</strong><br />
Barry<br />
Bates<br />
Boll<strong>in</strong>ger...<br />
Boone ,<br />
Buchanan..<br />
Callaway...<br />
Clark<br />
Clay<br />
Cl<strong>in</strong>ton<br />
Cole<br />
Cooper<br />
Crawford..<br />
Dade<br />
Daviess<br />
Dekalb<br />
Greene<br />
Harrison...<br />
Jackson<br />
Jasper<br />
Jefferson...<br />
Johnson<br />
Lafayette.<br />
Lawrence..<br />
L<strong>in</strong>coln<br />
L<strong>in</strong>n<br />
McDonald.<br />
Macon<br />
Maries<br />
Marion<br />
Mercer<br />
M06r<br />
Newton.<br />
Nodaway<br />
Pettis<br />
Phelps;<br />
Pike.<br />
Platte<br />
Folk<br />
Ralls<br />
R<strong>and</strong>olph<br />
Ray<br />
St. Charles<br />
St. Francois<br />
St. Louis<br />
St. Louis City .<br />
Ste. Genevieve.<br />
Sal<strong>in</strong>e<br />
Shannon<br />
Shelby<br />
Stoddard<br />
Stone<br />
Texas<br />
Vernon<br />
Warren<br />
Webster<br />
Wright<br />
Montana.<br />
Beaverhead<br />
Carbon<br />
Cascade<br />
Chouteau<br />
Custer<br />
Dawson<br />
Deer Lodge.<br />
Fergus<br />
Fla<strong>the</strong>ad<br />
Granite<br />
Jeflerson<br />
Lewis <strong>and</strong> Clark.<br />
L<strong>in</strong>coln<br />
Madison<br />
Meagher<br />
Missoula.<br />
Park<br />
Powell<br />
.<br />
.<br />
<strong>1910</strong><br />
124<br />
313<br />
48<br />
2<br />
1<br />
111<br />
1900<br />
10,745 a 11,343<br />
= S^^lSSSufeiZSltedl'?8w"otcLd^^^^^^<br />
8 Sdffl 2 i^fcdS onVhiteEarth <strong>Indian</strong>'Heservation, not returned fcy counties <strong>in</strong> 1900; returned <strong>in</strong> 19l6 m Becker, Clearwat«r, <strong>and</strong> Mahnomen Counties.<br />
* Includes 8'208 <strong>Indian</strong>s speciaUy enumerated <strong>in</strong> 1890, not distributed by counties.<br />
'.KS^ 'I'^TiSffifoZ '^riSdiii"Z'SvT4%'not re^^'^co^^^^ <strong>in</strong> 1900; returned <strong>in</strong> <strong>1910</strong> <strong>in</strong> Rosebud <strong>and</strong> Yellowstone CountlM<br />
' iSctadS B:^^ndirss?«Sl7enuS^t?d 1^890, not distributed iJy counties, <strong>and</strong> 2;28? <strong>Indian</strong>s on Crow <strong>Indian</strong> Reservation, not returned by counties <strong>in</strong> 1890;<br />
returned <strong>in</strong> <strong>1910</strong>* <strong>in</strong> Rosebud <strong>and</strong> Yellowstone Counties.<br />
4<br />
96<br />
1,209<br />
6<br />
122<br />
344<br />
2<br />
105<br />
6<br />
24<br />
,107<br />
3<br />
10<br />
7<br />
144<br />
31<br />
130<br />
21<br />
1<br />
16<br />
443<br />
1,429<br />
1,367<br />
2<br />
365<br />
36<br />
62<br />
1,802<br />
2<br />
27<br />
1890<br />
1<br />
123<br />
12<br />
7<br />
1<br />
41<br />
1<br />
6 128<br />
1<br />
1<br />
1<br />
8<br />
13<br />
2<br />
2<br />
1<br />
1<br />
1<br />
10<br />
2<br />
31<br />
1<br />
1<br />
'11,206<br />
20<br />
190<br />
159<br />
56<br />
21<br />
7<br />
121<br />
11<br />
14<br />
165<br />
7
28 INDIANS IN THE UNITED STATES.<br />
Table 1 1— Cont<strong>in</strong>ued.<br />
INDIAN POPULATION OF THE UNITED STATES, BY COUNTIES: <strong>1910</strong>, 1900, AND 1890—Cont<strong>in</strong>ued.<br />
COUNTY.<br />
Montana—Cont<strong>in</strong>ued.<br />
Ravalli ,<br />
Rosebud<br />
S<strong>and</strong>ers ,<br />
Silver Bow<br />
Sweet Grass<br />
Teton<br />
Valley<br />
Yellowstone<br />
Nebraska .<br />
Boyd....<br />
Burt<br />
Cedar<br />
Cherry..<br />
Clay<br />
Cum<strong>in</strong>g..<br />
Dakota..<br />
Dawes. .<br />
.<br />
Dawson.<br />
Dixon...<br />
Douglas.<br />
Gosper<br />
Holt<br />
Keith<br />
Kimball<br />
Knox<br />
Lancaster...<br />
Nance<br />
Nemaha<br />
Platte<br />
Richardson.<br />
Saunders<br />
Sheridan<br />
Thurston<br />
Wayne<br />
Nevada.<br />
.<br />
.<br />
ChurchiU....<br />
Clark<br />
Douglas<br />
Elko<br />
Esmeralda...<br />
Eureka<br />
Humboldt. .<br />
L<strong>and</strong>er<br />
L<strong>in</strong>coln<br />
Lyon<br />
Nye<br />
Ormsby<br />
Storey<br />
Washoe<br />
White P<strong>in</strong>e..<br />
New Hampshike.<br />
Belknap<br />
Carroll<br />
Cheshire<br />
Coos<br />
Grafton<br />
Hillsborough.<br />
Merrimack<br />
Rock<strong>in</strong>gham.<br />
New Jeesey.<br />
Atlantic<br />
Bergen<br />
Burl<strong>in</strong>gton.<br />
Camden<br />
Cape May..<br />
Essex<br />
Gloucester.<br />
Hudson<br />
Hunterdon.<br />
Mercer.<br />
Middlesex.<br />
Monmouth.<br />
Passaic<br />
Somerset...<br />
Union<br />
Warren<br />
New Mexico.<br />
Bernalillo.<br />
Colfax<br />
Dona Ana..<br />
Grant<br />
Guadalupe.<br />
.<br />
<strong>1910</strong><br />
14<br />
2,7S8<br />
179<br />
1<br />
26<br />
2,489<br />
1,774<br />
462<br />
3,502<br />
76<br />
925<br />
13<br />
334<br />
6<br />
1,915<br />
5,240<br />
231<br />
233<br />
292<br />
603<br />
628<br />
121<br />
647<br />
94<br />
114<br />
285<br />
523<br />
449<br />
71<br />
750<br />
199<br />
34<br />
18<br />
168<br />
20,573<br />
1,192<br />
11<br />
2<br />
3<br />
4<br />
1900<br />
14<br />
14<br />
74<br />
2,060<br />
1,793<br />
13<br />
3,322<br />
8<br />
12<br />
5<br />
961<br />
2<br />
22<br />
1,965<br />
5,216<br />
262<br />
55<br />
807<br />
832<br />
179<br />
626<br />
160<br />
296<br />
307<br />
372<br />
234<br />
113<br />
866<br />
207<br />
22<br />
19<br />
13,144<br />
4,768<br />
16<br />
1890<br />
16,431<br />
107<br />
1<br />
5<br />
2<br />
1<br />
625<br />
3<br />
201<br />
1,898<br />
2 5, 156<br />
230<br />
117<br />
301<br />
406<br />
194<br />
425<br />
382<br />
355<br />
414<br />
134<br />
100<br />
303<br />
238<br />
16<br />
84<br />
18<br />
' 15,044<br />
3,469<br />
18<br />
11<br />
4<br />
New Mexico—Cont<strong>in</strong>ued.<br />
L<strong>in</strong>coln<br />
McK<strong>in</strong>ley<br />
Mora<br />
Otero<br />
Bio Arriba<br />
San Juan<br />
San Miguel<br />
S<strong>and</strong>oval<br />
Santa Fe<br />
Socorro<br />
Taos<br />
Torrance<br />
Union<br />
Valencia<br />
New York.<br />
Albany<br />
Allegany<br />
Broome<br />
Cattaraugus.<br />
Cayuga<br />
Chautauqua.<br />
Chemung<br />
Chenango<br />
Cl<strong>in</strong>ton<br />
Columbia<br />
Cortl<strong>and</strong><br />
Delaware<br />
Dutchess<br />
Erie<br />
Frankl<strong>in</strong>.<br />
Fulton...<br />
Hamilton..<br />
Herkimer..<br />
Jefferson...<br />
Lewis<br />
Liv<strong>in</strong>gston. .<br />
. . .<br />
Madison<br />
Moiu:oe<br />
Montgomery..<br />
Nassau<br />
New York<br />
Niagara<br />
Oneida<br />
Onondaga<br />
Ontario<br />
Orange<br />
Oswego<br />
queens<br />
Rensselaer<br />
St. Lawrence.<br />
Saratoga<br />
Schenectady.<br />
Schoharie<br />
Schuyler<br />
Seneca<br />
'..<br />
Steuben<br />
Suffolk<br />
Tioga<br />
Tompk<strong>in</strong>s<br />
Ulster<br />
Warren<br />
Wash<strong>in</strong>gton..<br />
Wayne<br />
Westchester..<br />
Wyom<strong>in</strong>g<br />
NOBTH CAEOUNA.<br />
Alleghany<br />
Anson<br />
Bladen<br />
—<br />
Buncombe. .<br />
Caldwell<br />
Chatham<br />
Cherokee<br />
Columbus. ..<br />
Cumberl<strong>and</strong>.<br />
Davidson<br />
Davie<br />
Dupl<strong>in</strong><br />
Edgecombe.<br />
Forsyth<br />
Gaston<br />
Graham<br />
Granville<br />
Guilford<br />
Halifax<br />
Harnett<br />
Haywood<br />
1 Includes 3,538 <strong>Indian</strong>s specially enumerated <strong>in</strong> 1890, not distributed by counties.<br />
> Includes 1,667 <strong>Indian</strong>s specially enumerated <strong>in</strong> 1890, not distributed by counties.<br />
3 Includes 6,490 <strong>Indian</strong>s specially enumerated <strong>in</strong> 1890, not distributed by counties.<br />
4 Includes 5,318 <strong>Indian</strong>s specially enumerated <strong>in</strong> 1890, not distributed by counties.<br />
6 Includes 2 <strong>Indian</strong>s specially enumerated <strong>in</strong> 1890, not credited to any county.<br />
<strong>1910</strong><br />
13<br />
8,276<br />
7<br />
444<br />
1,370<br />
2, 847<br />
11<br />
2,839<br />
353<br />
146<br />
632<br />
21<br />
2<br />
2,400<br />
6,046<br />
11<br />
4<br />
1,013<br />
8^<br />
1,170<br />
'i,'388'<br />
439<br />
21<br />
8<br />
33<br />
146<br />
14<br />
60<br />
34<br />
1<br />
10<br />
194<br />
397<br />
42<br />
643<br />
1<br />
12<br />
7<br />
1<br />
3<br />
3<br />
246<br />
7,851<br />
157<br />
1900<br />
487<br />
1,275<br />
1,700<br />
14<br />
996<br />
136<br />
510<br />
3,177<br />
5,257<br />
1,104<br />
19<br />
27<br />
1<br />
1,265<br />
2<br />
1,262<br />
9<br />
347<br />
26<br />
24<br />
347<br />
29<br />
478<br />
7<br />
168<br />
11<br />
5,687<br />
37<br />
267<br />
1<br />
127<br />
1S90<br />
26<br />
499<br />
1<br />
46<br />
689<br />
14<br />
50S<br />
3,374<br />
< 6,044<br />
s 1,616<br />
28<br />
1<br />
1<br />
1<br />
151<br />
2<br />
7<br />
1<br />
27<br />
North Carol<strong>in</strong>a—Contd.<br />
Hertford<br />
Iredell<br />
Jackson<br />
McDowell<br />
Maoon<br />
Madison<br />
Mitchell<br />
Montgomery<br />
Moore<br />
Nash<br />
New Hanover<br />
Northampton<br />
Orange<br />
Pender<br />
Polk<br />
Robeson<br />
Rock<strong>in</strong>gham<br />
Rowan<br />
Ru<strong>the</strong>rford<br />
Sampson<br />
Sootl<strong>and</strong><br />
Swa<strong>in</strong><br />
Vance<br />
Wake<br />
Warren<br />
Wash<strong>in</strong>gton<br />
Watauga<br />
Yadk<strong>in</strong><br />
Yancey<br />
North Dakota.<br />
Benson<br />
Bott<strong>in</strong>eau.<br />
Burleigh...<br />
Cavalier<br />
Dunn<br />
Emmons<br />
Gr<strong>and</strong> Forks.<br />
McHenry<br />
McLean<br />
Mercer<br />
Morton<br />
Mountrail<br />
Nelson<br />
Pemb<strong>in</strong>a<br />
Ramsey<br />
. Richl<strong>and</strong><br />
Rolette<br />
Sargent<br />
Stutsman....<br />
Towner<br />
Walsh<br />
Ward<br />
Williams<br />
Ohio.<br />
^ , , -. , ... ...^ x<br />
Allen<br />
Ashtabula<br />
A<strong>the</strong>ns<br />
Belmont<br />
Brown<br />
Butler<br />
Clark<br />
Clermont<br />
Cl<strong>in</strong>ton<br />
.Cuyahoga<br />
Erie<br />
Fairfield<br />
Frankl<strong>in</strong><br />
Gallia<br />
Greene<br />
Hamilton<br />
Hard<strong>in</strong><br />
•Highl<strong>and</strong><br />
Huron<br />
Jackson<br />
Jefferson<br />
Lake<br />
Lawrence<br />
Lora<strong>in</strong><br />
Lucas<br />
Madison<br />
Mahon<strong>in</strong>g<br />
Marion<br />
Mercer<br />
Miami<br />
Montgomery.<br />
Musk<strong>in</strong>gum .<br />
Noble<br />
Ottawa<br />
Pauld<strong>in</strong>g<br />
Pickaway....<br />
« Includes 7,980 <strong>Indian</strong>s specially enumerated <strong>in</strong> 1890, not distributed by counties; <strong>and</strong> 103 <strong>Indian</strong>s <strong>in</strong> counties that were annexed to or taken to form o<strong>the</strong>r i<br />
between 1890 <strong>and</strong> 1900. ^. ^. ^ . xt _^t. t^ , ^ ^ ^<br />
' Includes 1,905 <strong>Indian</strong>s on that part of St<strong>and</strong><strong>in</strong>g Bock <strong>Indian</strong> Reservation which was <strong>in</strong> North Dakota, not returned by counties m 1900.<br />
8 Includes 2 <strong>Indian</strong>s on part of St<strong>and</strong><strong>in</strong>g Bock <strong>Indian</strong> Reservation, not returned by counties <strong>in</strong> 1890.<br />
9 Includes 13 <strong>Indian</strong>s specially enumerated <strong>in</strong> 1890, not distributed by counties.<br />
.<br />
<strong>1910</strong><br />
460<br />
5,895<br />
213<br />
74<br />
812<br />
21<br />
6,486<br />
1,026<br />
82<br />
5<br />
183<br />
237<br />
6<br />
1<br />
3<br />
630<br />
134<br />
1,288<br />
88<br />
8<br />
126<br />
2,129<br />
49<br />
3<br />
3<br />
13<br />
87<br />
48<br />
1900<br />
340<br />
1<br />
3,877<br />
134<br />
875<br />
6,968<br />
1,181<br />
6<br />
4<br />
60<br />
14<br />
40<br />
'1,911<br />
2<br />
6<br />
2,646<br />
42<br />
2<br />
1<br />
1890<br />
7<br />
314<br />
15<br />
1<br />
1<br />
2<br />
174<br />
Z 1<br />
&<br />
70O<br />
4<br />
i<br />
« 8, 174<br />
8<br />
14<br />
21<br />
2<br />
85<br />
1<br />
20<br />
1<br />
14<br />
3<br />
7<br />
.14<br />
6<br />
22<br />
1<br />
1<br />
1<br />
1<br />
18<br />
2
Table 1 1—C!ont<strong>in</strong>ued.<br />
POPULATION.<br />
INDIAN POPULATION OP THE UNITED STATES, BY COUNTIES: <strong>1910</strong>, 1900, AND 1890—Cont<strong>in</strong>ued.<br />
COUNTY.<br />
Omo—Cont<strong>in</strong>ued.<br />
Portage<br />
Preble<br />
Putnam<br />
Boss<br />
S<strong>and</strong>usky<br />
Soioto<br />
Shelby<br />
Summit<br />
Tuscarawas . .<br />
Union<br />
Van Wert<br />
Warren<br />
Wash<strong>in</strong>gton...<br />
Wood<br />
Wy<strong>and</strong>ot<br />
Oeljihoua.<br />
Adair ,<br />
Atoka ,<br />
Beckham<br />
Bla<strong>in</strong>e<br />
Bryan<br />
Caddo<br />
Canadian. .<br />
Oarter<br />
Cherokee...<br />
Choctaw<br />
Oimarron. .<br />
Clevel<strong>and</strong> . .<br />
Coal<br />
iComanche..<br />
'Craig<br />
Creek<br />
Custer<br />
Delaware...<br />
X)ewey<br />
BUis<br />
30<br />
INDIANS IN THE UNITED STATES.<br />
INDIAN POPULATION OP THE UNITED STATES, BY COUNTIES: <strong>1910</strong>, 1900, AND 1890—Cont<strong>in</strong>ued.<br />
Table 1 1—Contlnned.<br />
COUNTT.<br />
Tbioiessee—Cont<strong>in</strong>ued.<br />
Sevier<br />
Shelby<br />
Smith<br />
Stewart<br />
Sumner<br />
Tipton<br />
Union<br />
Van Buren<br />
Wash<strong>in</strong>gton<br />
Weakley<br />
White<br />
Texas..<br />
Atascosa..<br />
B<strong>and</strong>era..<br />
Bastrop..<br />
Bee<br />
Bexar....<br />
Bowie<br />
Brazoria.<br />
Brazos<br />
Brewster.<br />
Burnet...<br />
Caldwell..<br />
Cameron.<br />
Chambers....<br />
Cherokee<br />
Clay<br />
Coke<br />
CoU<strong>in</strong><br />
Cooke<br />
Dallas<br />
Deaf Smith...<br />
Delta<br />
Denton<br />
Donley<br />
Eastl<strong>and</strong><br />
El Paso<br />
Erath<br />
Fann<strong>in</strong><br />
Fayette<br />
FranHhi<br />
Freestone<br />
Galveston....<br />
Gillespie<br />
Gonzales<br />
Grayson<br />
Gregg<br />
Guadalupe...<br />
Hansford<br />
Hardeman<br />
Harris<br />
Harrison<br />
Hays<br />
Henderson. .<br />
Hidalgo<br />
Hill<br />
Hopk<strong>in</strong>s<br />
Houston.<br />
Hunt<br />
Iron<br />
Jeff Davis<br />
JeSerson<br />
Kaui<strong>in</strong>an<br />
Kerr<br />
K<strong>in</strong>ney..<br />
Lamar...<br />
Lavaca<br />
Liberty<br />
Limestone<br />
Llano<br />
McLennan<br />
Madison<br />
Marion<br />
Matagorda<br />
Med<strong>in</strong>a<br />
Milam<br />
Montague<br />
Montgomery..<br />
Morris<br />
Nacogdoches.<br />
Navarro<br />
Nolan<br />
Nueces<br />
Orange<br />
Polk<br />
B<strong>and</strong>all<br />
Red River<br />
Runnels<br />
Rusk<br />
Sab<strong>in</strong>e<br />
San Jac<strong>in</strong>to. .<br />
San Saba<br />
Schleicher<br />
Smith<br />
Stonewall. . .<br />
Tarrant<br />
Taylor<br />
Tom Green...<br />
Travis<br />
Tr<strong>in</strong>ity<br />
Tyler<br />
Upshur<br />
<strong>1910</strong><br />
702<br />
11<br />
41<br />
2<br />
200<br />
3<br />
202<br />
1<br />
1900<br />
470<br />
2<br />
"if<br />
"m<br />
1890<br />
1708<br />
4<br />
223<br />
Texas—Cont<strong>in</strong>ued.<br />
Val Verde<br />
Walker<br />
Waller<br />
Wash<strong>in</strong>gton<br />
Webb<br />
Wharton<br />
Wichita<br />
Williamson ,<br />
Wise<br />
Wood<br />
Utah..<br />
Beaver<br />
Box Elder...<br />
Cache<br />
Carbon<br />
Davis<br />
Emery<br />
Garfleld<br />
Iron<br />
Juab<br />
Kane<br />
Millard 1<br />
Piute<br />
Rich<br />
Salt Lake<br />
San Juan<br />
Sanpete<br />
Sevier :.<br />
Sumlnit.<br />
Tooele<br />
U<strong>in</strong>ta<br />
Utah<br />
Wasatch<br />
Wash<strong>in</strong>gton..<br />
Wayne<br />
Weber<br />
Vermont..<br />
Addison<br />
Benn<strong>in</strong>gton..<br />
Chittenden..<br />
Frankl<strong>in</strong><br />
Orleans<br />
Rutl<strong>and</strong><br />
Wash<strong>in</strong>gton..<br />
W<strong>in</strong>dsor<br />
VmeiNU..<br />
Amherst<br />
Bristol city<br />
Carroll<br />
Charles City<br />
Chesterfield<br />
Culpeper<br />
D<strong>in</strong>widdle<br />
Elizabeth City.<br />
Fredericksburg city<br />
Goochl<strong>and</strong><br />
Grayson<br />
Hanover ,<br />
Henrico<br />
K<strong>in</strong>g <strong>and</strong> Clueen<br />
K<strong>in</strong>g William<br />
Lee<br />
New Kent<br />
Norfolk<br />
Northampton ,<br />
Pittsylvania<br />
Portsmouth city<br />
Pr<strong>in</strong>ce George<br />
Pr<strong>in</strong>ce William<br />
Pulaski<br />
Richmond city<br />
Roanoke<br />
Southampton ...<br />
Staunton city<br />
Wash<strong>in</strong>gton.<br />
Williamsburg city .<br />
Wy<strong>the</strong><br />
Wash<strong>in</strong>gton.<br />
Asot<strong>in</strong><br />
Benton...<br />
Chehalis..<br />
Chelan<br />
Clallam...<br />
Clarke<br />
Cowlitz...<br />
Douglas...<br />
Ferry<br />
Frankl<strong>in</strong>..<br />
Garfleld...<br />
Grant<br />
Isl<strong>and</strong>....<br />
Kmg..<br />
Kitsap<br />
Kittites...<br />
Klickitat..<br />
z Includes 7,526 <strong>Indian</strong>s specially enumerated <strong>in</strong> 1890, not distributed by counties.<br />
<strong>1910</strong><br />
3,123<br />
24<br />
150<br />
1<br />
2<br />
47<br />
1,029<br />
141<br />
97<br />
4<br />
7<br />
26<br />
539<br />
113<br />
1<br />
180<br />
64<br />
112<br />
37<br />
2<br />
7<br />
2<br />
1<br />
10,997<br />
84<br />
67<br />
814<br />
7<br />
8<br />
108<br />
262<br />
358<br />
357<br />
36<br />
214<br />
1900<br />
2,623<br />
34<br />
188<br />
1<br />
1<br />
7<br />
471<br />
15<br />
4<br />
71<br />
1,313<br />
155<br />
118<br />
7<br />
354<br />
108<br />
152<br />
10,039<br />
337<br />
138<br />
733<br />
20<br />
71<br />
1<br />
720<br />
44<br />
221<br />
334<br />
281<br />
105<br />
169<br />
1890<br />
3<br />
2 3,456<br />
173<br />
1<br />
34<br />
349<br />
1<br />
1<br />
HI<br />
1<br />
1<br />
1<br />
3<br />
3<br />
4<br />
137<br />
1<br />
10<br />
43<br />
1<br />
a 11,181<br />
31<br />
186<br />
171<br />
44<br />
38<br />
10<br />
141<br />
195<br />
364<br />
207<br />
160<br />
SO<br />
Wash<strong>in</strong>gton—Cont<strong>in</strong>ued.<br />
Lewis<br />
Llncoto<br />
Okanogan<br />
Pacific<br />
Pierce<br />
San Juan<br />
Skagit.<br />
Skamania<br />
Snohomish<br />
Spokane<br />
Stevens. :<br />
Thurston<br />
Wahkiakum.<br />
Walla WaUa.<br />
Whatcom<br />
Whitman<br />
Yakima.<br />
West Vibq<strong>in</strong>ia..<br />
Cabell...<br />
Hampshire..<br />
Lewis<br />
Logan<br />
McDowell...<br />
Nicholas<br />
Preston<br />
Putnam<br />
Tucker<br />
Wiscons<strong>in</strong>..<br />
Adams<br />
Ashl<strong>and</strong><br />
Barron<br />
Bayfield<br />
Brown<br />
Burnett<br />
Calumet<br />
Chippewa<br />
Clark<br />
Columbia<br />
Crawford<br />
Dane<br />
Dodge<br />
Door<br />
Douglas<br />
Dunn<br />
Eau Claire<br />
Fond duLac...<br />
Forest<br />
Green Lsike<br />
Iowa<br />
Iron<br />
Jackson<br />
Juneau<br />
Kenosha.:<br />
La Crosse<br />
Langlade ,<br />
L<strong>in</strong>coln<br />
Manitowoc<br />
Marathon<br />
Mar<strong>in</strong>ette<br />
Marquette<br />
Milwaukee<br />
Monroe<br />
Oconto<br />
Oneida.<br />
Outagamie<br />
Pierce<br />
Polk<br />
Rac<strong>in</strong>e<br />
Richl<strong>and</strong><br />
Rook<br />
Rusk<br />
Sauk<br />
Sawyer<br />
Shawano<br />
Sheboygan<br />
Trempealeau..<br />
Vernon<br />
Vilas<br />
Walworth<br />
Washburn<br />
Wash<strong>in</strong>gton...<br />
Waukeana<br />
Waupaca<br />
Waushara<br />
W<strong>in</strong>nebago....<br />
Wood<br />
Wyom<strong>in</strong>g..<br />
Albany<br />
Carbon<br />
Crook<br />
Fremont. . .<br />
Johnson<br />
Laramie<br />
Natrona....<br />
Park<br />
Sheridan<br />
Sweetwater.<br />
U<strong>in</strong>ta<br />
<strong>1910</strong><br />
121<br />
8<br />
287<br />
823<br />
235<br />
542<br />
212<br />
479<br />
62<br />
799<br />
25<br />
854<br />
177<br />
91<br />
15<br />
658<br />
9<br />
1,873<br />
21<br />
10,142<br />
2<br />
,096<br />
54<br />
458<br />
876<br />
238<br />
237<br />
67<br />
29<br />
14<br />
23<br />
20<br />
17<br />
9<br />
264<br />
17<br />
35<br />
148<br />
2<br />
6<br />
28<br />
230<br />
16<br />
1<br />
37<br />
82<br />
152<br />
35<br />
17<br />
369<br />
219<br />
78<br />
1,136<br />
115<br />
3<br />
65<br />
6<br />
1,224<br />
1,743<br />
10<br />
25<br />
568<br />
151<br />
1<br />
21<br />
108<br />
1<br />
2<br />
1,463<br />
1900<br />
85<br />
11<br />
230<br />
886<br />
212<br />
601<br />
226<br />
679<br />
79<br />
594<br />
2<br />
901<br />
134<br />
31<br />
30<br />
519<br />
"ii745<br />
12<br />
8,372<br />
53<br />
887<br />
25<br />
494<br />
703<br />
151<br />
257<br />
102<br />
51<br />
16<br />
162<br />
197<br />
49<br />
18<br />
4<br />
276<br />
253<br />
70<br />
113<br />
1<br />
14<br />
2<br />
921<br />
1,768<br />
5<br />
22<br />
259<br />
1<br />
90<br />
1,6<br />
8<br />
'i,'677<br />
1890<br />
81<br />
22<br />
la<br />
104<br />
44<br />
76<br />
32<br />
248<br />
31<br />
311<br />
87<br />
340<br />
90<br />
41<br />
10-<br />
269<br />
102<br />
68<br />
4 9,930'<br />
60'<br />
18<br />
40<br />
3M<br />
732<br />
81<br />
165<br />
134<br />
18<br />
11<br />
22<br />
183<br />
2<br />
13<br />
12<br />
119'<br />
1<br />
44<br />
13.<br />
5<br />
65<br />
128.<br />
8'<br />
25<br />
48-<br />
29-<br />
943.<br />
1<br />
114<br />
7<br />
390-<br />
12.<br />
30^<br />
1<br />
2;<br />
44 2-<br />
> 1,844<br />
10'<br />
3<br />
14:<br />
1<br />
2:<br />
6 1.
FiiH-ilood <strong>and</strong> mixed-blood <strong>Indian</strong>s.—The Thirteenth<br />
Census was <strong>the</strong> first at which any returns worthy<br />
of tabulation were secured as to <strong>the</strong> proportion of<br />
fuU-bloods <strong>and</strong> mixed-bloods <strong>in</strong> <strong>the</strong> <strong>Indian</strong> popula-<br />
tion. Table 12 presents a summary of <strong>the</strong> results of<br />
this <strong>in</strong>quiry.<br />
Table 12<br />
PROPORTION OF MIXED-BLOODS.
32<br />
7able 13<br />
INDIANS IN THE UNITED STATES.
PROPORTION OF MIXED-BLOODS. 33<br />
DISTRIBUTION OF INDIANS ACCORDING TO PURITY OF BLOOD, FOR EACH PRINCIPAL STOCK, TRIBE, AND<br />
STATE: <strong>1910</strong>—Cont<strong>in</strong>ued.<br />
Tattle 14—Contd.<br />
[This table shows each stock <strong>and</strong> tribe hav<strong>in</strong>g 200 or more <strong>Indian</strong>s <strong>in</strong> <strong>1910</strong>.]
34 INDIANS IN THE UNITED STATES.<br />
DISTRIBUTION OF INDIANS ACCORDING TO PURITY OP BLOOD, FOR EACH PRINCIPAL STOCK TRIBE, AND<br />
'<br />
STATE: <strong>1910</strong>—Cont<strong>in</strong>ued.<br />
Table 14—Contd.<br />
[This table shows each stock <strong>and</strong> tribe hav<strong>in</strong>g 200 or more <strong>Indian</strong>s <strong>in</strong> <strong>1910</strong>.]
In <strong>the</strong> <strong>United</strong> <strong>States</strong>, as shown by Table 14, <strong>the</strong>re<br />
were six stocks each with more than 1,000 members<br />
<strong>in</strong> <strong>1910</strong>, <strong>in</strong> which <strong>the</strong> full-bloods represented more<br />
than 90 per cent of <strong>the</strong> total, namely, Zmiian, 99.1<br />
Keresan, 98.7; Piman, 96.9; Tanoan, 95.7; Yuman,<br />
93.5; <strong>and</strong> Athapaskan, 93 per cent; <strong>and</strong> among <strong>the</strong><br />
Navajo tribe of <strong>the</strong> last-named stock <strong>the</strong> full-bloods<br />
constituted 99.3 per cent of <strong>the</strong> 22,455 members.<br />
The Croatan, a much mixed group of composite<br />
orig<strong>in</strong>, with 5,865 members, had <strong>the</strong> smallest proportion<br />
of full-bloods, 7.8 per cent, <strong>and</strong> <strong>the</strong> Iroquoian<br />
stock, with 39,679 members, <strong>the</strong> next smallest pro-<br />
portion, 30.1 per cent; but of <strong>the</strong> last-named stock<br />
<strong>the</strong> full-bloods ia <strong>the</strong> Cherokee tribe, with 31,489<br />
members, constituted only 21.9 per cent. Of <strong>the</strong><br />
o<strong>the</strong>r large stocks, <strong>the</strong> Shoshonean, with 16,842<br />
members, had 87.1 per cent of full-bloods, but with a<br />
range among <strong>the</strong> tribes from 62.9 per cent for <strong>the</strong><br />
Comanche to 99.9 per cent for <strong>the</strong> Hopi. Among <strong>the</strong><br />
<strong>Indian</strong>s of Siouan stock, representiag a total of 32,941<br />
members <strong>in</strong> <strong>1910</strong>, <strong>the</strong> full-bloods constituted 68.4 per<br />
cent, but with a range among <strong>the</strong> tribes from 24.2<br />
per cent for <strong>the</strong> Iowa to 89 per cent for <strong>the</strong> Himkpapa<br />
Sioux. The Muskhogean stock, with 29,191 members,<br />
had 46.7 per cent of full-bloods <strong>in</strong> <strong>1910</strong>, but for <strong>the</strong><br />
Choctaw tribe alone, with 15,917 members, <strong>the</strong> percentage<br />
was 44.6. The Algonquian stock, with 40,975<br />
members, had a slightly lower percentage, 44.9, but<br />
among <strong>the</strong> Chippewa tribe, with 20,214 members, <strong>the</strong><br />
full-bloods constituted only 34.5 per cent.<br />
The proportion of full-bloods often varies consid-<br />
erably, <strong>and</strong> for some tribes greatly, <strong>in</strong> different states,<br />
as shown by <strong>the</strong> figures <strong>in</strong> Table 14. For example,<br />
while <strong>the</strong> Chippewa tribe, of Algonquian stock,<br />
showed as a whole 34.5 per cent of fuU-bloods, tKo'se<br />
<strong>in</strong> M<strong>in</strong>nesota showed 43.7 per cent as agaiust only 2<br />
per cent for those <strong>in</strong> North Dakota <strong>and</strong> 17.3 per cent<br />
for those <strong>in</strong> Montana.<br />
In <strong>Alaska</strong> <strong>the</strong> Eskimauan stock, with 14,087 mem-<br />
bers reported <strong>in</strong> <strong>1910</strong>, had 91.3 per cent of full-bloods,<br />
<strong>and</strong> no tribe, except <strong>the</strong> Aleut, with less than 87<br />
per cent; <strong>the</strong> Athapaskan stock, with 3,916 members,<br />
93 per cent; <strong>and</strong> <strong>the</strong> Tliagit stock, with 4,426 mem-<br />
bers, 87.9 per cent. The Aleut tribe, with 1,451<br />
members, had <strong>the</strong> smallest proportion of full-bloods,<br />
68.8 per cent.<br />
WkUe <strong>and</strong> <strong>Indian</strong> mixed-bloods.— ^The mixed-bloods<br />
represent<strong>in</strong>g a mixture of white <strong>and</strong> <strong>Indian</strong> are subdivided<br />
<strong>in</strong> Table 15 <strong>in</strong>to those <strong>in</strong> whom <strong>the</strong> <strong>Indian</strong><br />
blood predom<strong>in</strong>ated, those of whom one parent was a<br />
full-blood <strong>Indian</strong> <strong>and</strong> <strong>the</strong> o<strong>the</strong>r white—that is, <strong>the</strong><br />
half-breeds proper—<strong>and</strong> those who were more than<br />
one-half white.<br />
Of <strong>the</strong> 88,030 persons of mixed white <strong>and</strong> <strong>Indian</strong><br />
blood <strong>in</strong> <strong>the</strong> <strong>United</strong> <strong>States</strong>, 18,169, or 20.6 per cent,<br />
were less than half white; 24,353, or 27.7 per cent,<br />
half <strong>Indian</strong> <strong>and</strong> half white; <strong>and</strong> 43,937, or 49.9 per<br />
cent— ^practically one-half of <strong>the</strong> total— ^were more<br />
than half white. "<br />
Thus about four-fifths of <strong>the</strong> <strong>Indian</strong><br />
<strong>and</strong> white mixed-bloods wer« at least half white. For<br />
PROPORTION OF MIXED-BLOODS. 35<br />
499 mixed-bloods <strong>the</strong> a<strong>in</strong>oxmt of white blood was<br />
imknown, <strong>and</strong> for 1,072 Mexican blood was reported.<br />
The latler are classed with those for whom <strong>the</strong> degree<br />
of mixture is unknown because, while a "Mexican" is<br />
presumably white or a mixture of white <strong>and</strong> <strong>Indian</strong>,<br />
<strong>the</strong>re is no way of tell<strong>in</strong>g what proportion, if any, of<br />
his blood is <strong>Indian</strong>.<br />
Table 15<br />
DEGREE OF MIXTTTBE.
36 INDIANS IN THE UNITED STATES.<br />
The proportion of mixed-bloods with <strong>the</strong> white<br />
blood predomiaat<strong>in</strong>g was highest <strong>in</strong> Oklahoma (75.4<br />
per cent), a fact which is probably susceptible of <strong>the</strong><br />
same explanation as <strong>the</strong> high proportion of mixedbloods<br />
<strong>in</strong> Oklahoma, which was noted on page 32.<br />
The next highest proportion (41.2 per cent) was<br />
found <strong>in</strong> M<strong>in</strong>nesota. The lowest proportions of this<br />
class were reported <strong>in</strong> New Mexico (0.6 per cent),<br />
Nevada (4.2 per cent), Arizona (7.6 per cent), <strong>and</strong><br />
North Carol<strong>in</strong>a (9.3 per cent), <strong>the</strong> proportion be<strong>in</strong>g<br />
above 10 per cent <strong>in</strong> each of <strong>the</strong> o<strong>the</strong>r states.<br />
Table 17 shows, for <strong>the</strong> <strong>United</strong> <strong>States</strong>, <strong>the</strong> distribu-<br />
tion of <strong>the</strong> white <strong>and</strong> <strong>Indian</strong> mixed-bloods accord<strong>in</strong>g to<br />
<strong>the</strong> proportion of white blood <strong>in</strong> each of <strong>the</strong> pr<strong>in</strong>cipal<br />
stocks <strong>and</strong> tribes <strong>and</strong> for certa<strong>in</strong> tribes <strong>in</strong> each of <strong>the</strong><br />
pr<strong>in</strong>cipal states, as reported <strong>in</strong> <strong>1910</strong>.<br />
DISTRIBUTION OF WHITE AND INDIAN MIXED-BLOODS ACCORDING TO PROPORTION OF WHITE BLOOD, FOR<br />
EACH PRINCIPAL STOCK, TRIBE, AND STATE: <strong>1910</strong>.<br />
Table 17<br />
STOCK, TBIBE, AND<br />
STATE.<br />
Algonquiad stock..<br />
Arapaho.'<br />
Cheyenne<br />
Oklahoma J . .<br />
.<br />
.<br />
Chtepewa<br />
Michigan<br />
M<strong>in</strong>nesota<br />
Montana<br />
North DEikota...<br />
Pennsylvania<br />
Wiscons<strong>in</strong><br />
Cree<br />
Montana<br />
Delaware<br />
Gros Ventres<br />
EUckapoo<br />
Menom<strong>in</strong>ee<br />
MiftTnl<br />
Oklahoma<br />
Ottawa<br />
Michigan<br />
Oklahoma<br />
Penobscot<br />
Piegan<br />
Porawatomie<br />
ITftngftq<br />
Michigan<br />
Oklahoma<br />
Sauk <strong>and</strong> Fox<br />
Shawnee<br />
Stockbridges<br />
Athapaskan stock .<br />
Apache<br />
Arizona<br />
Hapa<br />
, Bogue Blver<br />
Wailaki.<br />
Caddoan stock<br />
Caddo<br />
CnnfoOKAN stock. ..<br />
Ch<strong>in</strong>ook<br />
Oregon<br />
Wash<strong>in</strong>gton<br />
Cboatan geoup<br />
Croatan<br />
lEOQUOIAN STOCK ...<br />
Cherokee<br />
North Carol<strong>in</strong>a .<br />
Oklahoma<br />
Mohawk<br />
Oneida<br />
Wiscons<strong>in</strong><br />
St. Regis<br />
Seneca<br />
New York<br />
Oklahoma<br />
Wy<strong>and</strong>ot<br />
[This table shows each stock <strong>and</strong> tribe hav<strong>in</strong>g 200 or more <strong>Indian</strong>s <strong>in</strong> <strong>1910</strong> of which 100 or more were white <strong>and</strong> <strong>Indian</strong> mixed-bloods.]<br />
21,318<br />
101<br />
319<br />
139<br />
13,031<br />
2,123<br />
4,556<br />
402<br />
2,829<br />
103<br />
2,693<br />
413<br />
273<br />
631<br />
118<br />
103<br />
713<br />
164<br />
100<br />
966<br />
759<br />
158<br />
181<br />
1,025<br />
1,461<br />
486<br />
177<br />
749<br />
154<br />
776<br />
216<br />
1,015<br />
122<br />
111<br />
292<br />
159<br />
143<br />
111<br />
416<br />
261<br />
112<br />
136<br />
26,102<br />
WHITE AND INDIAN MIXED-BLOODS: <strong>1910</strong>.<br />
A3<br />
-I<br />
5,565<br />
53<br />
122<br />
78<br />
3,051<br />
830<br />
1,349<br />
57<br />
27<br />
17<br />
714<br />
10.<br />
21<br />
61<br />
318<br />
42<br />
18<br />
523<br />
502<br />
8<br />
115<br />
200<br />
418<br />
217<br />
118<br />
66<br />
52<br />
139<br />
72<br />
235<br />
94<br />
2,540<br />
2,540<br />
2,137<br />
1,702<br />
192<br />
1,429<br />
14<br />
107<br />
78<br />
44<br />
163<br />
108<br />
45<br />
31<br />
Number.<br />
•a<br />
71780<br />
30<br />
106<br />
38<br />
5,516<br />
506<br />
1,302<br />
257<br />
2,153<br />
44<br />
1,121<br />
196<br />
177<br />
143<br />
64<br />
31<br />
180<br />
42<br />
4<br />
213<br />
176<br />
17<br />
59<br />
377<br />
212<br />
127<br />
19<br />
58<br />
45<br />
101<br />
84<br />
44<br />
217<br />
72<br />
106<br />
84<br />
122<br />
56<br />
60<br />
1,856<br />
3,835<br />
H<br />
7,804<br />
10<br />
77<br />
17<br />
4,388<br />
766<br />
1,844<br />
77<br />
648<br />
42<br />
816<br />
204<br />
84<br />
405<br />
32<br />
10<br />
215<br />
80<br />
78<br />
221<br />
IS<br />
133<br />
7<br />
422<br />
828<br />
141<br />
38<br />
625<br />
57<br />
527<br />
60<br />
142<br />
77<br />
40<br />
170<br />
121<br />
^3<br />
71<br />
272<br />
272<br />
P<br />
169<br />
76<br />
136<br />
130<br />
'i24<br />
16.1<br />
52.6<br />
38.2<br />
56.1<br />
23.4<br />
39.1<br />
29.6<br />
14.2<br />
1.0<br />
16.5<br />
26.5<br />
2.4<br />
3.3<br />
10.8<br />
17.8<br />
59.2<br />
44.6<br />
25.6<br />
18.0<br />
54.1<br />
66.1<br />
5.1<br />
63.6<br />
19.5<br />
28 6<br />
44.7<br />
66.7<br />
8.8<br />
33.8<br />
17.9<br />
33.3<br />
23.2<br />
27.9<br />
30.6<br />
7.5<br />
25.2<br />
12.6<br />
27.0<br />
15.1<br />
6.9<br />
11.6<br />
3.7<br />
54.4<br />
54.4<br />
8.2<br />
7.2<br />
44.8<br />
6.3<br />
4.8<br />
34.3<br />
34.4<br />
4.4<br />
34.0<br />
48.9<br />
31.0<br />
Per cent ol total.<br />
i<br />
36.5<br />
29.7<br />
33.2<br />
27.3<br />
42.3<br />
23.8<br />
29.9<br />
63.9<br />
76.1<br />
42.7<br />
41.6<br />
47.5<br />
64.8<br />
22.7<br />
54.2<br />
30.1<br />
25.2<br />
25.6<br />
4.0<br />
22.0<br />
23.2<br />
10.8<br />
32.6<br />
36.8<br />
14.5<br />
26.1<br />
10.7<br />
7.7<br />
29.2<br />
13.0<br />
55.4<br />
42.6<br />
39.6<br />
74.3<br />
45.3<br />
74.1<br />
32.2<br />
32.4<br />
44.0<br />
46.7<br />
50.0<br />
44.1<br />
39.8<br />
39. J<br />
14.7<br />
9.8<br />
9.1<br />
9.6<br />
86.0<br />
33.0<br />
33.0<br />
84.4<br />
43.4<br />
26.7<br />
41.4<br />
13.9<br />
s o<br />
36.1<br />
9.9<br />
24.1<br />
12.2<br />
33.7<br />
36.1<br />
40.6<br />
19.2<br />
22.9<br />
40.8<br />
30.3<br />
49.4<br />
30.8<br />
64.2<br />
27.1<br />
9.7<br />
30.2<br />
48.8<br />
78.0<br />
22.9<br />
9.6<br />
84.2<br />
3.9<br />
41.2<br />
56.7<br />
29.0<br />
21.5<br />
83.4<br />
37.0<br />
67.9<br />
27.8<br />
14.0<br />
11.5<br />
11.7<br />
18.2<br />
23.3<br />
13.3<br />
29.5<br />
36.0<br />
40.9<br />
46.4<br />
38.4<br />
52.2<br />
5.8<br />
5.8<br />
76.6<br />
82.6<br />
46.2<br />
83.6<br />
9.2<br />
32.7<br />
32.6<br />
10.6<br />
22.5<br />
24.4<br />
27.6<br />
76.3<br />
II<br />
0.8<br />
7.9<br />
4.4<br />
4.3<br />
0.6<br />
1.0<br />
(»)<br />
2.7<br />
{')<br />
1.6<br />
0.7<br />
1.1<br />
2.4<br />
0.8<br />
1.0<br />
0.9<br />
1.2<br />
2.5<br />
0.2<br />
0.2<br />
1.1<br />
1.2<br />
7.5<br />
18.0<br />
18.0<br />
6.3<br />
2.3<br />
4.5<br />
0.5<br />
0.6<br />
'o.h<br />
STOCK, TBIBE, AND<br />
STATE.<br />
KABOK STOCK.<br />
Orleans<br />
EiOWAN STOCK.<br />
Kiowa<br />
ZUTENAIAN STOCK.<br />
Kutenal<br />
Montana..<br />
LUTUAMIAN STOCK...<br />
IHamath<br />
Haidu stock..<br />
Maidu ,<br />
MiwoK stock .<br />
Miwok<br />
MUSKHOSEAN STOCK<br />
Chickasaw. .<br />
. .<br />
Choctaw<br />
Oklahoma<br />
Creek<br />
Alabama..<br />
Oklahoma<br />
Sem<strong>in</strong>ole<br />
Oklahoma .<br />
PiMAN STOCK..<br />
POMO STOCK..<br />
Pomo<br />
SALISHAN STOCK.<br />
Clallam<br />
Colville.....<br />
Fla<strong>the</strong>ad...<br />
Montana..<br />
Kalispel<br />
Montana..<br />
Lummi<br />
Ok<strong>in</strong>agan...<br />
Puyallup...<br />
Snohomish.<br />
Spokan<br />
Suquamish<br />
SHAHAPTIAN STOCK .<br />
Nez Perces.<br />
Idaho<br />
WallawaUa.<br />
Yakima..*..<br />
> Ifess than one-tenth of 1 per cent.<br />
276<br />
294<br />
210<br />
525<br />
525<br />
354<br />
13,723<br />
166<br />
209<br />
2,687<br />
132<br />
428<br />
280<br />
220<br />
200<br />
158<br />
141<br />
132<br />
119<br />
190<br />
233<br />
127<br />
977<br />
276<br />
218<br />
266<br />
312<br />
WHITE AND INDIAN MIXED-BLOODS: <strong>1910</strong>.<br />
ja5<br />
84<br />
84<br />
79<br />
63<br />
161<br />
161<br />
87<br />
~73<br />
Number.<br />
II<br />
OS<br />
w<br />
1,648 2,336 9,586<br />
603<br />
1<br />
498<br />
63<br />
63<br />
23<br />
80<br />
43<br />
750<br />
272<br />
120<br />
114<br />
20<br />
60<br />
148<br />
165<br />
1,296<br />
1,273<br />
490<br />
8<br />
456<br />
57<br />
63<br />
19<br />
1«2<br />
45<br />
1,133<br />
~64<br />
215<br />
70<br />
49<br />
53<br />
44<br />
46<br />
64<br />
45<br />
96<br />
96<br />
53<br />
101<br />
71<br />
100<br />
135<br />
65<br />
65<br />
201<br />
200<br />
67<br />
49<br />
2,189<br />
5,865<br />
5,831<br />
1,497<br />
172<br />
1,310<br />
33<br />
30<br />
27<br />
21<br />
801<br />
~35<br />
160<br />
115<br />
81<br />
110<br />
90<br />
22<br />
50<br />
24<br />
37<br />
93<br />
16<br />
55<br />
33<br />
146<br />
95<br />
153<br />
3<br />
3<br />
22<br />
"ii<br />
153<br />
17<br />
121<br />
20.9<br />
20.9<br />
34.8<br />
34.8<br />
7.8<br />
7.8<br />
8.0<br />
Per cent of total.<br />
a<br />
13.2<br />
21.2<br />
21.2<br />
19.6<br />
26.9 50.3<br />
30.0 46.7<br />
12.0<br />
6.3<br />
11.0<br />
10.5<br />
19.9<br />
0.6<br />
21.6<br />
38.4<br />
40.1<br />
13.9<br />
38.3<br />
27.9<br />
32.6<br />
12.1<br />
33.9<br />
40.9<br />
18.5<br />
15.2<br />
51.8<br />
13.6<br />
42.0<br />
30.0<br />
18.9<br />
45.7<br />
27.8<br />
43.5<br />
52.3<br />
7.5<br />
25.6<br />
17.0<br />
11.4<br />
48.8<br />
41.3<br />
42.2<br />
40.9<br />
50.2<br />
25.0<br />
22.3<br />
26.5<br />
27.8<br />
32.6<br />
48.5<br />
37.8<br />
50.5<br />
41.2<br />
41.7<br />
36.6<br />
32.6<br />
37.6<br />
43.3<br />
u<br />
16.2<br />
16.2<br />
0.3<br />
71.0<br />
71.0<br />
72.5<br />
22.8<br />
23.3<br />
13.5<br />
13.5<br />
21.5<br />
22.2<br />
76.0<br />
72.0<br />
72.9<br />
59.2<br />
95.0<br />
56.9<br />
20.1<br />
19.1<br />
1.8<br />
12.9<br />
19.3<br />
29.8<br />
26.5<br />
37.4<br />
41.1<br />
36.8<br />
55.0<br />
57.0<br />
15.6<br />
37.9<br />
20.2<br />
19.5<br />
39.9<br />
12.6<br />
34.6<br />
19.9<br />
15.1<br />
64.9<br />
30.4<br />
an<br />
51.7<br />
51.7<br />
0.6<br />
"o^i<br />
1.1<br />
0.6<br />
1.1<br />
0.7<br />
1.5<br />
1.6<br />
6.7<br />
7.0<br />
72.9<br />
0.1<br />
0.2<br />
0.8<br />
0:6
PROPORTION OF MIXED-BLOODS. 37<br />
DISTRIBUTION OP WHITE AND INDIAN MIXED-BLOODS ACCO RDING TO PROPORTION OP WHITE BLOOD, FOR<br />
EACH PRINCIPAL STOCK, TRIBE, AND STATE: <strong>1910</strong>—Cont<strong>in</strong>ued.<br />
Table 17-Contd,<br />
[This table shows each stoolE <strong>and</strong> tribe hav<strong>in</strong>g 200 or more <strong>Indian</strong>s <strong>in</strong> <strong>1910</strong> ol which 100 or more were white <strong>and</strong> <strong>Indian</strong> mixed-bloods.]
38<br />
Negro <strong>and</strong> <strong>Indian</strong> mixed-Uoods.—The distribution<br />
of <strong>the</strong> Negro <strong>and</strong> <strong>Indian</strong> mixed-bloods is given <strong>in</strong><br />
Table 18.<br />
The number of Negro <strong>and</strong> <strong>Indian</strong> mixed-bloods re-<br />
ported, 2,255, is probably an understatement, ow<strong>in</strong>g to<br />
dis<strong>in</strong>cl<strong>in</strong>ation to admit Negro blood. Of <strong>the</strong> number<br />
reported, 31.8 per cent were less than half Negro, 32.3<br />
per cent half <strong>Indian</strong> <strong>and</strong> half Negro, <strong>and</strong> 34.6 per cent<br />
more than half Negro, while for 1.3 per cent <strong>the</strong> porportion<br />
of Negro blood was not reported.<br />
Table 18<br />
Total<br />
Les9 tban half Negro . .<br />
Half Negro, half <strong>Indian</strong><br />
More than half Ne^o . .<br />
Unknown proportions..<br />
.<br />
DEGREE or MIXTUBE.<br />
INDIANS IN THE UNITED STATES.<br />
negro <strong>and</strong> <strong>in</strong>dian<br />
mixed-bloods:<br />
<strong>1910</strong>.<br />
Number.<br />
2,255<br />
717<br />
729<br />
780<br />
29<br />
Per cent<br />
of total.<br />
100.0<br />
31.8<br />
32.3<br />
34.6<br />
1.3<br />
FvM-tribcd <strong>and</strong> mixed-tribal <strong>Indian</strong>s.—Table 19 classi-<br />
fies, for <strong>the</strong> <strong>United</strong> <strong>States</strong>, <strong>the</strong> full-blood <strong>Indian</strong>s accord<strong>in</strong>g<br />
to whe<strong>the</strong>r both parents belonged to <strong>the</strong> same<br />
tribe or to different tribes, or represented a mixture<br />
of tribes.<br />
Table 19<br />
Total<br />
degree o? tribal mixture.<br />
Fun-tribal blood<br />
Ulxed-trlbal blood<br />
Two tribes<br />
Three or more tribes<br />
Tribal blood of one parent unknown.<br />
full-blood<br />
INDIANS: <strong>1910</strong>.<br />
Number.<br />
150,053<br />
139, 289<br />
10,251<br />
8,924<br />
1,327<br />
513<br />
Per cent<br />
of total.<br />
100.0<br />
Of <strong>the</strong> 150,053 full-blood <strong>Indian</strong>s <strong>in</strong> <strong>the</strong> <strong>United</strong><br />
92.8<br />
6.8<br />
5.9<br />
0.9<br />
0.3<br />
<strong>States</strong> <strong>in</strong> <strong>1910</strong>, 139,289, or 92.8 per cent, were of fulltribal<br />
blood, <strong>and</strong> 10,251, or 6.8 per cent, were of mixed-<br />
tribal blood, while for 513, or three-tenths of 1 per<br />
cent, <strong>in</strong>formation on this po<strong>in</strong>t was not available.<br />
Of <strong>the</strong> 10,251 who reported mixed-tribal blood, 8,924<br />
represented a mixture of two tribes only <strong>and</strong> 1,327 a<br />
mixture of more than two tribes.<br />
Table 20 shows <strong>the</strong> number <strong>and</strong> percentage of<br />
persons of full-tribal blood <strong>and</strong> of mixed-tribal blood<br />
among full-blood <strong>Indian</strong>s, for <strong>the</strong> 22 states presented<br />
<strong>in</strong> Table 13. The proportion of <strong>Indian</strong>s of full-tribal<br />
blood is also shown graphically, by states, <strong>in</strong> <strong>the</strong> map<br />
foUowitig <strong>the</strong> table.<br />
The table shows that <strong>the</strong> proportion of full-tribal<br />
blood among full-blood <strong>Indian</strong>s was uniformly high,<br />
generally over 90 per cent. The only states west of <strong>the</strong><br />
Mississippi that had proportions below 90 per cent<br />
were South Dakota, Wash<strong>in</strong>gton, Kansas, Oregon, <strong>and</strong><br />
North Dakota. In <strong>the</strong>se states members of different<br />
tribes are frequently found on <strong>the</strong> same reservations,<br />
with <strong>the</strong> result that <strong>in</strong>termarriages are comparatively<br />
frequent.<br />
Table 20
states, as reported <strong>in</strong> <strong>1910</strong>. Table 21 shows, for each<br />
stock hav<strong>in</strong>g 200 or more <strong>Indian</strong>s, <strong>the</strong> number <strong>and</strong><br />
percentage of fuU-blood <strong>Indian</strong>s who were of pure<br />
or mixed stock or for whom <strong>the</strong> stock was <strong>in</strong> part<br />
unknown<br />
Table 21<br />
:<br />
PROPORTION OF MIXED-BLOODS. 39
40 INDIANS IN THE UNITED STATES.<br />
PROPORTION OF FULL-BLOOD AND MIXED-BLOOD INDIANS, AND OF INDIANS OF FULL-TRIBAL BLOOD, IN<br />
EACH PRINCIPAL TRIBE: <strong>1910</strong>.<br />
HOPI<br />
NAVAJO<br />
ZUNI<br />
PIMA<br />
MOHAVE<br />
PAPAQO<br />
LAQUNA<br />
UTE<br />
ARAPAHO<br />
PAVIOTSO<br />
CHEYENNE<br />
SHOSHONI<br />
ONEIDA<br />
WINNEBAGO<br />
YANKTONAI SIOUX<br />
MONO<br />
OMAHA<br />
NEZ PERCES<br />
YAKIMA<br />
APACHE<br />
SEMINOLE<br />
TETON SIOUX<br />
KIOWA<br />
SENECA<br />
CROW<br />
SISSETON SIOUX<br />
YANKTON SIOUX<br />
OTTAWA<br />
ASSINIBOIN<br />
COMANCHE<br />
CREEK<br />
PIEGAN<br />
SANTEE SIOUX<br />
MENOMINEE<br />
MAIDU<br />
CHOCTAW<br />
OSAGE<br />
SHAWNEE<br />
POTAWATOMI<br />
CHIPPEWA<br />
CHICKASAW<br />
CHEROKEE<br />
ST. REGIS<br />
CROATAN<br />
FULL BLOOD<br />
I FULL TRIBAL YV/////A MIXED TRIBAL<br />
\^^W^A MIXED BLOOD<br />
] TRIBAL BLOOD OF ONE PARENT UNKNOWN<br />
NOT REPORTED
PROPORTION OF MIXED -BLOODS. 41<br />
DISTRIBUTION OF FULL-BLOOD INDIANS ACCORDING TO TRIBAL MIXTURE, FOR EACH PRINCIPAL TRIBE AND<br />
STATE: <strong>1910</strong>.<br />
Table 22<br />
TBIBE AND STATE.<br />
Aloonquun stock.<br />
Arapaho<br />
Oklahoma<br />
Wyom<strong>in</strong>g<br />
Cheyenne<br />
Montana<br />
Oklahoma<br />
South Dakota..<br />
Chippewa<br />
Michigan<br />
M<strong>in</strong>nesota<br />
Montana<br />
North Dakota.;<br />
Pennsylvania..<br />
Wiscons<strong>in</strong><br />
Ciee<br />
Montana<br />
Delaware<br />
Qros Ventres ,<br />
Eickapoo<br />
Kansas<br />
Oklahoma<br />
Mashpee<br />
Menom<strong>in</strong>ee<br />
Miami<br />
Oklahoma<br />
Ottawa<br />
Michigan<br />
Oklahoma<br />
Passamaquoddy .<br />
Penobscot<br />
Piegan<br />
Fotawatomi<br />
Kansas<br />
Michigan<br />
Oklahoma<br />
Wiscons<strong>in</strong>.<br />
Sauk <strong>and</strong> Fox<br />
Iowa<br />
Oklahoma<br />
Shawnee<br />
Stockbridges<br />
Athapaskan stock.<br />
Apache<br />
Arizona<br />
Oklahoma<br />
Hupa<br />
Jicarilla Apache. .<br />
Mescalero Apache.<br />
Navajo<br />
Arizona<br />
New Mexico...<br />
Utah<br />
Bogue Eiver<br />
Wailaki<br />
Caddoan stock.<br />
Arikara<br />
Caddo<br />
Pawnee<br />
Wichita<br />
CmuAKUAN stock.<br />
Quileute<br />
Ch<strong>in</strong>ookan stock.<br />
Ch<strong>in</strong>ook.<br />
Wasco<br />
Oregon<br />
Wlshram .<br />
Cboatan oboue.<br />
Croatan<br />
. . . .<br />
lEOQUOIAN STOCK<br />
Cherokee<br />
North Carol<strong>in</strong>a.<br />
Oklahoma<br />
Mohawk<br />
Oneida<br />
New York<br />
Wiscons<strong>in</strong><br />
Onondaga<br />
St. Begi^<br />
.<br />
Total.,<br />
1,311<br />
621<br />
661<br />
2,662<br />
1,181<br />
1,379<br />
74<br />
6,970<br />
1,558<br />
3,595<br />
84<br />
58<br />
31<br />
1,601<br />
. 40<br />
35<br />
279<br />
390<br />
240<br />
112<br />
126<br />
1<br />
704<br />
59<br />
22<br />
1,720<br />
1,664<br />
12<br />
295<br />
85<br />
1,214<br />
960<br />
319<br />
281<br />
115<br />
227<br />
647<br />
245<br />
260<br />
635<br />
184<br />
3,801<br />
3,491<br />
263<br />
345<br />
694<br />
411<br />
22,304<br />
10,900<br />
10,322<br />
1,034<br />
223<br />
82<br />
[This table shows each tribe hav<strong>in</strong>g 200 or more <strong>Indian</strong>s <strong>in</strong> <strong>1910</strong>. Per cent not shown where base is less than SO.]<br />
372<br />
644<br />
308<br />
240<br />
53<br />
12<br />
41<br />
159<br />
134<br />
216<br />
6,900<br />
934<br />
5,919<br />
63<br />
2,098<br />
188<br />
1,854<br />
299<br />
133<br />
Number.<br />
Fulltribal<br />
blood.<br />
1,269<br />
601<br />
654<br />
2,507<br />
1,103<br />
1,346<br />
30<br />
6,784<br />
1,433<br />
3,575<br />
78<br />
57<br />
31<br />
1,574<br />
26<br />
24<br />
213<br />
357<br />
200<br />
79<br />
119<br />
1<br />
665<br />
47<br />
12<br />
1,535<br />
1,496<br />
7<br />
2SS<br />
60<br />
1,206<br />
795<br />
78<br />
211<br />
490<br />
218<br />
235<br />
467<br />
143<br />
3,749<br />
3,469<br />
245<br />
325<br />
692<br />
392<br />
22,241<br />
10,888<br />
10,291<br />
1,023<br />
167<br />
74<br />
319<br />
299<br />
530<br />
274<br />
206<br />
31<br />
3<br />
28<br />
95<br />
84<br />
154<br />
457<br />
6,785<br />
FTJLL-BLOOD INDIANS: <strong>1910</strong>.<br />
Mixedtribal<br />
blood.<br />
42<br />
20<br />
7<br />
139<br />
64<br />
33<br />
42<br />
173<br />
122<br />
15<br />
12<br />
10<br />
180<br />
167<br />
6<br />
6<br />
25<br />
8<br />
164<br />
60<br />
55<br />
36<br />
16<br />
65<br />
27<br />
24<br />
68<br />
40<br />
33<br />
Tribal<br />
blood<br />
of one<br />
parent<br />
unknown.
42 INDIANS IN THE UNITED STATES.<br />
DISTRIBUTION OF PULL-BLOOD INDIANS ACCORDING TO TRIBAL MIXTURE, FOR EACH PRINCIPAL TRIBE AND<br />
STATE: <strong>1910</strong>—Cont<strong>in</strong>ued.<br />
Table 22—Contd.<br />
TRIBE AND STATE.<br />
Shahaftian stock.<br />
KliMtat<br />
Nez Forces<br />
Idaho<br />
Umatilla<br />
Oregon<br />
Wallawalla<br />
Warm Spr<strong>in</strong>gs.<br />
Yakima<br />
Seastan stock.<br />
Hat Creek<br />
Pit River<br />
Shasta<br />
California.<br />
Shoshonean stock.<br />
Bannock<br />
Chemehuevi<br />
California<br />
Comanche<br />
Hopi<br />
Kawia<br />
Mono<br />
Faiute<br />
California<br />
Nevada<br />
Utah<br />
Faviotso<br />
California<br />
Idaho<br />
Nevada<br />
Oregon<br />
San Luiseno<br />
Shoshoni<br />
Idaho<br />
Nevada<br />
Utah<br />
Wyom<strong>in</strong>g ,<br />
Ute.......tT:<br />
Colorado<br />
Utah<br />
SIOUAN stock.<br />
Ass<strong>in</strong>lbo<strong>in</strong><br />
Crow<br />
Hidatsa<br />
Iowa.<br />
M<strong>and</strong>an..<br />
Omaha...<br />
Oto.<br />
Ponca<br />
Nebraska<br />
Oklahoma<br />
Quapaw<br />
Santee Sioux<br />
M<strong>in</strong>nesota<br />
Montana<br />
Nebraska<br />
North Dakota<br />
South Dakota<br />
Slouz<br />
M<strong>in</strong>nesota<br />
South Dakota. . .<br />
Slsseton Sioux<br />
Montana<br />
North Dakota<br />
South Dakota<br />
Teton Sioux<br />
North Dakota<br />
South Dakota.<br />
.<br />
Total.<br />
335<br />
970<br />
804<br />
219<br />
131<br />
126<br />
538<br />
,043<br />
220<br />
841<br />
101<br />
62<br />
323<br />
31S<br />
242<br />
736<br />
2,006<br />
702<br />
1,215<br />
674<br />
183<br />
229<br />
198<br />
2,664<br />
80<br />
133<br />
2,113<br />
334<br />
a51<br />
3,329<br />
1,163<br />
1,392<br />
240<br />
502<br />
2,112<br />
707<br />
1,382<br />
793<br />
1,242<br />
418<br />
59<br />
10<br />
71<br />
165<br />
885<br />
591<br />
211<br />
461<br />
60<br />
374<br />
63<br />
799<br />
100<br />
78<br />
410<br />
66<br />
145<br />
'<br />
494<br />
117<br />
98<br />
1,631<br />
204<br />
469<br />
926<br />
10,598<br />
225<br />
10,289<br />
(This table shows each tribe hav<strong>in</strong>g 200 or more <strong>Indian</strong>s <strong>in</strong> <strong>1910</strong>. Per cent not shown where base is less than SO.]<br />
Number.<br />
FuUtribal<br />
blood.<br />
252<br />
865<br />
756<br />
158<br />
98<br />
100<br />
470<br />
916<br />
174<br />
697<br />
75<br />
53<br />
305<br />
297<br />
235<br />
690<br />
1,995<br />
652<br />
1,155<br />
656<br />
175<br />
222<br />
196<br />
2,598<br />
64<br />
132<br />
2,089<br />
313<br />
339<br />
3,224<br />
1,113<br />
1,341<br />
237<br />
495<br />
2,088<br />
707<br />
1,366<br />
•762<br />
1,178<br />
235<br />
34<br />
5<br />
66<br />
79<br />
877<br />
583<br />
185<br />
455<br />
58<br />
373<br />
31<br />
672<br />
99<br />
65<br />
403<br />
16<br />
89<br />
441<br />
115<br />
92<br />
1,394<br />
162<br />
424<br />
786<br />
9,747<br />
129<br />
9,560<br />
FDLL-BLOOD INDIANS: <strong>1910</strong>.<br />
Mixedtribal<br />
blood.<br />
80<br />
104<br />
47<br />
61<br />
68<br />
125<br />
46<br />
137<br />
24<br />
21<br />
7<br />
103<br />
40<br />
49<br />
3<br />
7<br />
20<br />
12<br />
30<br />
64<br />
182<br />
25<br />
5<br />
5<br />
86<br />
8<br />
8<br />
2<br />
1<br />
.32<br />
125<br />
1<br />
13<br />
7<br />
50<br />
54<br />
50<br />
2<br />
5<br />
228<br />
42<br />
45<br />
131<br />
772<br />
96<br />
650<br />
Tribal<br />
blood<br />
of one<br />
parent<br />
unknown,<br />
79<br />
Per cent of total.<br />
Fulltribal<br />
blood.<br />
75.2<br />
89.2<br />
94.0<br />
72.1<br />
74.8<br />
79.4<br />
87 4<br />
87.8<br />
79.1<br />
82.9<br />
74.3<br />
85.5<br />
94.4<br />
94.3<br />
97.1<br />
93.8<br />
99.5<br />
92.9<br />
95.1<br />
97.3<br />
95.6<br />
96.9<br />
99.0<br />
97.5<br />
80.0<br />
99.2<br />
98.9<br />
93.7<br />
96.6<br />
96.8<br />
96.5<br />
96.3<br />
9S.7<br />
98.6<br />
98.9<br />
100.0<br />
98.8<br />
96.1<br />
94.8<br />
56.2<br />
57.6<br />
93.0<br />
47.9<br />
99.1<br />
98.6<br />
87.7<br />
98.7<br />
96.7<br />
99.7<br />
49.2<br />
84.1<br />
99.0<br />
83.3<br />
98.3<br />
24.2<br />
61.4<br />
89.3<br />
98.3<br />
93.9<br />
.85.5<br />
79.4<br />
90.4<br />
84.9<br />
92.0<br />
57.3<br />
92.9<br />
Mixedtribal<br />
blood.<br />
23.9<br />
10.7<br />
5.8<br />
27.9<br />
25.2<br />
20.6<br />
12.6<br />
12.0<br />
20.9<br />
16.3<br />
25.7<br />
14.5<br />
5.6<br />
5.7<br />
2.9<br />
3.3<br />
0.5<br />
6.4<br />
4.6<br />
2.2<br />
2.7<br />
3.1<br />
1.0<br />
2.4<br />
20.0<br />
1.1<br />
6.3<br />
2.0<br />
3.1<br />
3.5<br />
3.5<br />
1.3<br />
1.4<br />
0.9<br />
0.9<br />
3.8<br />
5.2<br />
43.5<br />
42.4<br />
7.0<br />
52.1<br />
0.9<br />
1.4<br />
10.9<br />
1.3<br />
3.3<br />
0.3<br />
50.8<br />
15.6<br />
1.0<br />
16.7<br />
1.7<br />
75.8<br />
37.2<br />
10.1<br />
1.7<br />
5.1<br />
14.0<br />
14.1<br />
7.3<br />
42.7<br />
6.3<br />
Tribal<br />
blood<br />
of one<br />
parent<br />
unknown.<br />
0.9<br />
0.1<br />
0.1<br />
0.2<br />
0.8<br />
3.0<br />
(')<br />
0.7<br />
0.3<br />
0.4<br />
1.6<br />
"o.'s<br />
1.4<br />
0.1<br />
0.2<br />
b'.i<br />
0.1<br />
'q.2<br />
0.3<br />
1.4<br />
0.6<br />
1.0<br />
0.6<br />
1.0<br />
0.7<br />
Per<br />
cent<br />
fuU<br />
tribal<br />
ofaU<br />
<strong>Indian</strong>s.<br />
62.2<br />
68.7<br />
73.0<br />
58.1<br />
64.5<br />
25.2<br />
85.5<br />
67.3<br />
72.5<br />
70.8<br />
21.2<br />
20.8<br />
73.8<br />
83.7<br />
90.4<br />
58.9<br />
99.3<br />
86.4<br />
79.8<br />
84.1<br />
83.3<br />
89.9<br />
82.4<br />
85.5<br />
63.4<br />
86.8<br />
86.5<br />
91.8<br />
72.6<br />
84.0<br />
88.4<br />
86.2<br />
95.6<br />
70.7<br />
93.0<br />
97.5<br />
92.8<br />
60.8<br />
65.5<br />
43.0<br />
13.9<br />
4.0<br />
27.7<br />
37.8<br />
79.4<br />
42.5<br />
55.7<br />
52.0<br />
30.1<br />
60.3<br />
13.4<br />
43.7<br />
42.7<br />
60.7<br />
56.9<br />
16.0<br />
23.5<br />
44.3<br />
71.4<br />
33.2<br />
55.4<br />
63.5<br />
68.3<br />
50.6<br />
68.2<br />
34.9<br />
69.3<br />
TBIBE' <strong>and</strong>state.<br />
SlOUAN stock—<br />
Cont<strong>in</strong>ued.<br />
Teton Sioux—Contd.<br />
Brule Sioux<br />
Hunkpapa Sioux.<br />
North Dakota.<br />
South Dakota.<br />
M<strong>in</strong>nicoDjou Sioux<br />
Oglala Sioux<br />
Sans Arc Sioux<br />
Sihasapa<br />
North Dakota.<br />
South Dakota.<br />
Two Kettle Sioux.<br />
O<strong>the</strong>r Teton Sioux<br />
W<strong>in</strong>nebago<br />
Nebraska<br />
Wiscons<strong>in</strong><br />
Yankton Sioux<br />
Montana<br />
North Dakota..<br />
South Dakota..<br />
Yanktonai Sioux...<br />
North Dakota<br />
South Dakota..<br />
Tanoan stock.<br />
Isleta<br />
Jemez<br />
San Juan...<br />
Santa Clara.<br />
Taos<br />
Wahlatpuan stock.<br />
Cayuse ,<br />
Wakashan stock.<br />
Makah<br />
Washoan stock.<br />
Washo<br />
Calilomia.<br />
Nevada...<br />
W<strong>in</strong>tun stock.<br />
W<strong>in</strong>tun ,<br />
Yokuts stock.<br />
Yokuts<br />
Cocopa..<br />
YUMAN stock.<br />
Maricopa<br />
Mohave<br />
Arizona<br />
Califomia<br />
Walapai<br />
Yavapai<br />
Yuma<br />
Arizona<br />
California<br />
YUKOK stock.<br />
Weitspec ,<br />
Zuni<br />
ZUNIAN stock.<br />
' Less than one-tenth of 1 per cent.<br />
.<br />
Total,<br />
593<br />
954<br />
119<br />
835<br />
353<br />
4,168<br />
64<br />
333<br />
SO<br />
282<br />
143<br />
3,990<br />
1,S43<br />
865<br />
630<br />
1,348<br />
279<br />
156<br />
910<br />
1,144<br />
473<br />
499<br />
382<br />
509<br />
254<br />
342<br />
228<br />
414<br />
121<br />
255<br />
243<br />
585<br />
367<br />
1,038<br />
651<br />
385<br />
485<br />
256<br />
816<br />
187<br />
628<br />
528<br />
1,662<br />
Number.<br />
Fulltribal<br />
blood.<br />
441<br />
463<br />
25<br />
428<br />
142<br />
3,744<br />
21<br />
122<br />
24<br />
97<br />
55<br />
3,928<br />
1,530<br />
860<br />
628<br />
1,026<br />
220<br />
40<br />
763<br />
768<br />
293<br />
474<br />
851<br />
418<br />
380<br />
251<br />
505<br />
194<br />
262<br />
620<br />
209,<br />
410<br />
108<br />
241<br />
242<br />
568<br />
339<br />
966<br />
584<br />
381<br />
471<br />
243<br />
784<br />
177<br />
606<br />
1,641<br />
FULL-BLOOD INDIANS: <strong>1910</strong>.<br />
Mixedtribal<br />
blood.<br />
145<br />
469<br />
94<br />
375<br />
197<br />
405<br />
43<br />
206<br />
26<br />
180<br />
87<br />
61<br />
13<br />
5<br />
2<br />
317<br />
58<br />
116<br />
143<br />
371<br />
179<br />
190<br />
59<br />
13<br />
12<br />
Tribal<br />
blood<br />
of one<br />
parent<br />
unknown.<br />
Per cent of total.<br />
FuU.<br />
,tribal<br />
blood.<br />
74.4<br />
47.6<br />
21.0<br />
51.3<br />
40.2<br />
89.8<br />
32.8<br />
36.6<br />
48.0<br />
34.4<br />
38.5<br />
98.4<br />
99.2<br />
99.4<br />
99.7<br />
76.1<br />
78.9<br />
25.6<br />
83.8<br />
67.1<br />
61.9<br />
71.0<br />
96.2<br />
83.8<br />
99.5<br />
93.7<br />
99.2<br />
76.4<br />
96.4<br />
91.7<br />
99.0<br />
89.3<br />
94.5<br />
97.1<br />
92.4<br />
93.1<br />
89.7<br />
99.0<br />
97.1<br />
94.9<br />
96.1<br />
94.7<br />
96. S<br />
97.3<br />
Mixed'<br />
tribal<br />
blood.<br />
24.5<br />
49.2<br />
79.0<br />
44.9<br />
65.8<br />
9.7<br />
67.2<br />
61.9<br />
52.0<br />
63.8<br />
60.8<br />
1.6<br />
0.8<br />
0.6<br />
0.3<br />
23.5<br />
20.8<br />
74.4<br />
15.7<br />
32.4<br />
37.8<br />
28.4<br />
4.8<br />
16.2<br />
0.5<br />
6.3<br />
0.8<br />
23.2<br />
73.7 25.7<br />
3.6<br />
8.3<br />
1.0<br />
10.7<br />
4.7<br />
0.4<br />
2.4<br />
7.4<br />
6.9<br />
10.3<br />
1.0<br />
2.9<br />
6.1<br />
3.6<br />
5.3<br />
3.0<br />
2.7<br />
Tribal<br />
blood<br />
of one<br />
parent<br />
unknown.<br />
1.2<br />
3.4<br />
3.8<br />
4.0<br />
0.6<br />
1.5<br />
1.8<br />
0.7<br />
W<br />
0.4<br />
0.4<br />
0.4<br />
0.4<br />
0.2<br />
0.6<br />
0.4<br />
0.6<br />
0.8<br />
0.5<br />
0.3<br />
0.4<br />
'b'.s<br />
Per<br />
cent<br />
fuU<br />
tribal<br />
OfaU<br />
<strong>Indian</strong>s.<br />
54.7<br />
42.3<br />
17.6<br />
46.0<br />
35.8<br />
61.9<br />
9.5<br />
25.2<br />
17.5<br />
28.0<br />
18.8<br />
79.1<br />
84.1<br />
85.4<br />
85.4<br />
49.1<br />
59.1<br />
25.2<br />
49.7<br />
56.6<br />
53.2<br />
69.0<br />
89.0<br />
83.8<br />
90.6<br />
97.7<br />
65.1<br />
70.0<br />
75.7<br />
76.6<br />
76.6<br />
27.1<br />
79.8<br />
98.8<br />
75.1<br />
87.8<br />
91.3<br />
87.8<br />
97.9<br />
94.0<br />
84.1<br />
94.0<br />
92.7<br />
94.4<br />
76.9
In consider<strong>in</strong>g <strong>the</strong> classification of <strong>the</strong> <strong>Indian</strong> popu-<br />
lation accord<strong>in</strong>g to sex, it should be noted that <strong>the</strong>re<br />
is possibly a material marg<strong>in</strong> of error. It may be that<br />
omissions of persons of <strong>the</strong> one sex have been more<br />
frequent than of persons of <strong>the</strong> o<strong>the</strong>r sex. Moreover,<br />
<strong>in</strong> <strong>the</strong> case of persons of mixed blood it is possible that<br />
more of one sex than of <strong>the</strong> o<strong>the</strong>r were reported as<br />
whites or Negroes <strong>in</strong>stead of as <strong>Indian</strong>s. F<strong>in</strong>ally,<br />
<strong>the</strong>re may be less accuracy <strong>in</strong> <strong>the</strong> case of one sex than<br />
of <strong>the</strong> o<strong>the</strong>r with respect to <strong>the</strong> reports as to <strong>the</strong> mix-<br />
ture of <strong>Indian</strong> blood with white or Negro blood, or as<br />
to <strong>the</strong> mixture of tribes <strong>in</strong> <strong>the</strong> case of full-blood <strong>Indian</strong>s.<br />
The possibility of such errors should be borne<br />
<strong>in</strong> m<strong>in</strong>d <strong>in</strong> compar<strong>in</strong>g <strong>the</strong> sex ratios.<br />
Comparative statistics.— ^Table 23 presents a com-<br />
parison of <strong>the</strong> sex distribution of <strong>the</strong> <strong>Indian</strong>s <strong>in</strong> <strong>the</strong><br />
<strong>United</strong> <strong>States</strong> <strong>and</strong> <strong>Alaska</strong> <strong>in</strong> <strong>1910</strong>, 1900, <strong>and</strong> 1890.<br />
Table 23<br />
SEX DISTRIBUTION.
44 INDIANS IN THE UNITED STATES.<br />
Table 24<br />
STATE.
SEX DISTRIBUTION. 45<br />
INDIANS IN THE UNITED STATES, BY DIVISIONS AND STATES, AND IN ALASKA, CLASSIFIED ACCORDING TO<br />
SEX AND PUEITY OF BLOOD: <strong>1910</strong>.<br />
TaMe 26
46 INDIANS IN THE UNITED STATES.<br />
bloods. As <strong>the</strong> number of mixed-bloods <strong>in</strong> <strong>Alaska</strong><br />
was comparatively small, however, no reliable conclusions<br />
can be based on <strong>the</strong> sex distribution among <strong>the</strong>m.<br />
EXCESS OF MALES OR FEMALES AMONG 1NDLA.NS OF FULL<br />
BLOOD: <strong>1910</strong>.<br />
EWa Excess of males. ^^ Excess of females.<br />
I I Less tlian 100 full-blood <strong>Indian</strong>s In state.<br />
EXCESS OF MALES OE FEMALES AMONG INDIANS OF MIXED<br />
BLOOD: <strong>1910</strong>.<br />
sss<br />
Tables 7<br />
ggB3 Excess of males. g^j Excess of females.<br />
I I Less than 100 <strong>Indian</strong>s of mixed blood <strong>in</strong> state.
Table 30<br />
SEX DISTRIBUTION. 47<br />
MALES TO 100 FEMALES, BY PURITY OF BLOOD, FOR EACH PRINCIPAL STOCK, TRIBE, AND STATE: <strong>1910</strong>.<br />
[This table shows eaoli stock <strong>and</strong> tribe hav<strong>in</strong>g 100 or more females <strong>in</strong> <strong>1910</strong>. Ratio not shown where number of females is less than 100.]
48 INDIANS IN THE UNITED STATES.<br />
MALES TO 100 FEMALES, BY PUEITY OF BLOOD, FOR EACH PBINCIPAL STOCK, TBIBE, AND STATE: <strong>1910</strong>—Cont<strong>in</strong>ued.<br />
Table 30—Con.<br />
[This table shows each stock <strong>and</strong> tribe hay<strong>in</strong>g 100 or more females <strong>in</strong> <strong>1910</strong>. Ratio not shown where number of females is less than 100.]
SEX DISTRIBUTION. 49<br />
MALES TO 100 FEMALES, BY PURITY OF BLOOD, FOR EACH PRINCIPAL STOCK, TRIBE, AND STATE: <strong>1910</strong>—Contmued.<br />
TaUe 30—Con.<br />
[This table shows each stock <strong>and</strong> tribe hay<strong>in</strong>g 100 or more lemales In <strong>1910</strong>. Ratio not shown where number of females is less than 100.1
50 INDIANS IN THE UNITED STATES.<br />
blood than among those of full-tribal blood. Of those<br />
of mixed-tribal blood, however, <strong>the</strong> <strong>Indian</strong>s repre-<br />
sent<strong>in</strong>g a mixture of only two tribes show a con-<br />
siderably greater preponderance of males than those<br />
represent<strong>in</strong>g a mixture of more than two tribes.<br />
These differences may be <strong>in</strong> part due to errors <strong>in</strong><br />
classification.<br />
Table 33 gives, for <strong>the</strong> 22 selected states, <strong>the</strong><br />
number of males to 100 females for <strong>Indian</strong>s of fulltribal<br />
<strong>and</strong> mixed-tribal blood. The excess of males<br />
or females among <strong>Indian</strong>s of fuU-tribal <strong>and</strong> mixed-<br />
tribal blood is also shown graphically, by states, <strong>in</strong><br />
<strong>the</strong> maps on this page.<br />
Table 33<br />
<strong>United</strong> <strong>States</strong>....<br />
Arizona<br />
California<br />
Colorado<br />
Idaho<br />
Kansasi<br />
Uichigan<br />
U<strong>in</strong>nesota<br />
Mississippi<br />
Montana<br />
Nebraska<br />
Nevada<br />
New Mexico<br />
New York<br />
North Carol<strong>in</strong>a<br />
North Dakota<br />
Oklahoma<br />
Oregon<br />
South Dakota<br />
Utah<br />
Wash<strong>in</strong>^n<br />
Wisconsm<br />
Wyom<strong>in</strong>g<br />
Total for 22 states.<br />
All o<strong>the</strong>r states<br />
INDIANS OP FUIJ/.TEIBAL<br />
BLOOD.<br />
Uale.<br />
70,068<br />
13, 627<br />
4,841<br />
361<br />
1,321<br />
256<br />
1,648<br />
1,899<br />
577<br />
2,740<br />
1,139<br />
2,084<br />
9,996<br />
1,059<br />
710<br />
764<br />
12,318<br />
1,042<br />
5,300<br />
1,500<br />
2,635<br />
2,494<br />
592<br />
68,903<br />
1,165<br />
Female.<br />
69,221<br />
12,892<br />
4,792<br />
342<br />
1,355<br />
155<br />
1,525<br />
1,933<br />
500<br />
2,990<br />
1,121<br />
2,099<br />
9,730<br />
1,052<br />
669<br />
790<br />
12,293<br />
1,177<br />
5,734<br />
1,300<br />
2,809<br />
2,506<br />
563<br />
68,327<br />
894<br />
Males<br />
to 100<br />
females.<br />
101.2<br />
105 7<br />
101.0<br />
105.6<br />
97.5<br />
165.2<br />
108.1<br />
98 2<br />
115.4<br />
91.6<br />
101.6<br />
99.3<br />
102.7<br />
100.7<br />
106.1<br />
96.7<br />
100.2<br />
88.5<br />
92.4<br />
115.4<br />
93.8<br />
99.5<br />
105.2<br />
100.8<br />
130.3<br />
INDIANS OF MIXED-TKIBAL<br />
BLOOD.<br />
Male.<br />
6,353<br />
290<br />
402<br />
65<br />
188<br />
10<br />
237<br />
17<br />
62<br />
183<br />
370<br />
8<br />
470<br />
608<br />
333<br />
1,152<br />
48<br />
608<br />
125<br />
13<br />
5,296<br />
57<br />
Female.<br />
273<br />
161<br />
12<br />
218<br />
16<br />
40<br />
169<br />
342<br />
7<br />
469<br />
585<br />
329<br />
956<br />
43<br />
619<br />
100<br />
6<br />
4,854<br />
44<br />
Males<br />
to 100<br />
females.<br />
109.3<br />
106.2<br />
103.3<br />
ms<br />
ioa7<br />
10&3<br />
108.2<br />
(V 100.2<br />
103.9<br />
101.2<br />
120.5<br />
m 98 2<br />
126.0<br />
109.1<br />
I Exclusive of <strong>Indian</strong>s <strong>in</strong> Haskell Institute, who are <strong>in</strong>cluded <strong>in</strong> <strong>the</strong> total for<br />
"All o<strong>the</strong>r states."<br />
< Ratio not shown, <strong>the</strong> number of females be<strong>in</strong>g less than 100.<br />
Table 34 (p. 51) shows <strong>the</strong> sex distribution of<br />
<strong>Indian</strong>s of full-tribal blood for each of <strong>the</strong> pr<strong>in</strong>cipal<br />
tribes <strong>in</strong> <strong>the</strong> <strong>United</strong> <strong>States</strong> <strong>in</strong> <strong>1910</strong> <strong>and</strong> for particular<br />
states under certa<strong>in</strong> tribes. A similar distribution of<br />
<strong>Indian</strong>s of mixed-tribal blood would have but little<br />
statistical significance for most of <strong>the</strong> tribes, s<strong>in</strong>ce <strong>the</strong><br />
numbers <strong>in</strong>volved are small.<br />
EXCESS OF MALES OR FEMALES AMONG INDIANS OF FULL-<br />
TRIBAL BLOOD: <strong>1910</strong>.<br />
JJSB Excess of males. KSSSl Excess of females.<br />
I I Less than 100 <strong>Indian</strong>s of full-tribal blood reported In state.<br />
EXCESS OF MALES OR FEMALES AMONG INDIANS OF MIXED-<br />
TRIBAL BLOOD: <strong>1910</strong>.<br />
B29<br />
Excess of males. EBSH Excess of females.<br />
3 Less than 100 <strong>Indian</strong>s of mixed-tribal blood reported In state.
SEX DISTRIBUTION. 51<br />
MALES TO 100 FEMALES FOR INDIANS OF FULL-TRIBAL BLOOD, FOR EACH PRINCIPAL TRIBE AND STATE: <strong>1910</strong>.<br />
Table 34<br />
—<br />
, .<br />
Arapaho<br />
Oklahoma<br />
Wyom<strong>in</strong>g<br />
Cheyenne<br />
Montana<br />
Oklahoma<br />
Chippewa<br />
Michigan<br />
M<strong>in</strong>nesota<br />
Wiscons<strong>in</strong><br />
Delaware..<br />
Gros Ventres<br />
Kickapoo<br />
Menom<strong>in</strong>ee<br />
Ottawa<br />
Michigan<br />
Fassamaquoddy.<br />
Flegan<br />
Fotawatomi<br />
Kansas<br />
Michi^<br />
Sauk <strong>and</strong> Fox...<br />
Oklahoma. .<br />
Shawnee<br />
Apache<br />
Arizona<br />
Oklahoma<br />
Hupa<br />
JicaiUla Apache . .<br />
Mescalero Apache..<br />
Navi^o<br />
Axizona<br />
New Mexico...<br />
Utah<br />
Arlkara..<br />
Caddo...<br />
Pawnee..<br />
Wichita.<br />
Qulleute..<br />
Croatan..<br />
Cherokee<br />
North Carol<strong>in</strong>a.<br />
Oklahoma<br />
Oneida<br />
Wiscons<strong>in</strong><br />
New York.<br />
Tuscarora<br />
Orleans..<br />
.<br />
TKIBG AND STATE.<br />
Algonquian stock.<br />
Athapaskan stock.<br />
Caddoan stock.<br />
Chimakuan stock.<br />
CnOATAN GBOUP.<br />
IBOQUOUN stock.<br />
Kabok stock.<br />
Kebesan stock.<br />
Acoma<br />
Cochiti<br />
Laguna....<br />
San Felipe<br />
Santo Dom<strong>in</strong>go..<br />
Kiowa<br />
Kutenai..<br />
Klamath.<br />
Maidu....<br />
Mlwok....<br />
KiowAN stock.<br />
Kutenaian stock.<br />
LUTUAMIAN stock.<br />
Maidu stock.<br />
MrWOK STOCK.<br />
[This table shows each tribe hav<strong>in</strong>g 100 or more lemales of Jull-tribal blood.]<br />
<strong>in</strong>dians of pdlii-tbibal<br />
blood: <strong>1910</strong>.<br />
Male. Female.<br />
641<br />
303<br />
327<br />
1,220<br />
607<br />
679<br />
3,387<br />
751<br />
1,780<br />
751<br />
97<br />
177<br />
100<br />
349<br />
803<br />
776<br />
149<br />
S69<br />
441<br />
160<br />
112<br />
261<br />
124<br />
213<br />
1,892<br />
1,734<br />
129<br />
149<br />
3S4<br />
174<br />
11,227<br />
5,561<br />
5,086<br />
544<br />
151<br />
150<br />
256<br />
131<br />
98<br />
221<br />
3,487<br />
489<br />
2,970<br />
986<br />
918<br />
892<br />
810<br />
110<br />
345<br />
129<br />
722<br />
269<br />
431<br />
353<br />
122<br />
170<br />
254<br />
142<br />
628<br />
298<br />
327<br />
1,287<br />
596<br />
667<br />
3,397<br />
682<br />
1,795<br />
823<br />
116<br />
180<br />
100<br />
316<br />
732<br />
720<br />
140<br />
637<br />
'<br />
364<br />
109<br />
114<br />
229<br />
111<br />
254<br />
1,857<br />
1,735<br />
116<br />
176<br />
338<br />
218<br />
11,014<br />
5,327<br />
5,205<br />
479<br />
168<br />
149<br />
274<br />
143<br />
108<br />
236<br />
3,298<br />
431<br />
2,857<br />
918<br />
842<br />
846<br />
772<br />
108<br />
182<br />
340<br />
106<br />
674<br />
218<br />
380<br />
413<br />
124<br />
210<br />
259<br />
166<br />
Males<br />
to 100<br />
females.<br />
102.1<br />
101.7<br />
100.0<br />
94.8<br />
86.1<br />
101.8<br />
99.7<br />
110.1<br />
99.2<br />
91.3<br />
83.6<br />
98.3<br />
100.0<br />
110.4<br />
109.7<br />
107.8<br />
106.4<br />
89.3<br />
124.6<br />
,146.8<br />
98.2<br />
114.0<br />
111.7<br />
83.9<br />
101.9<br />
99.9<br />
111.2<br />
84.7<br />
104.7<br />
79.8<br />
101.9<br />
104.4<br />
97.7<br />
113.6<br />
100.7<br />
93.4<br />
91.6<br />
90.7<br />
105.7<br />
113.5<br />
104.0<br />
107.4<br />
109.0<br />
105.4<br />
104.9<br />
101.9<br />
83.5<br />
101.5<br />
121.7<br />
107.1<br />
123.4<br />
113.4<br />
85.5<br />
98.4<br />
81.0<br />
98.1<br />
85. S<br />
.<br />
. .<br />
TBIBE AND STATE.<br />
MUSKHOGEAN STOCK.<br />
Alibamu<br />
Texas<br />
Chickasaw<br />
Choctaw<br />
Mississippi..<br />
Oklahomii.<br />
Creek<br />
Oklahoma.<br />
Sem<strong>in</strong>ole<br />
Oklfthoma.<br />
Papago.<br />
Pima<br />
Yaqui..<br />
Clallam<br />
Columbia<br />
Colville<br />
Kalispel<br />
Qu<strong>in</strong>aielt<br />
Snohomish<br />
Spokan<br />
Wash<strong>in</strong>gton.<br />
Sw<strong>in</strong>omish<br />
Klikitat<br />
Nes Perces<br />
Idaho<br />
Warm Spr<strong>in</strong>gs.<br />
Yakima<br />
Pit River..<br />
Bannock<br />
—<br />
—<br />
Chemehuevi. .<br />
California..<br />
Comanche<br />
Hopi<br />
Kawia<br />
Mono<br />
Faiute<br />
Nevada<br />
Paviotso<br />
Nevada. .<br />
Oregon<br />
SanLuiseno...<br />
Shoshoni<br />
Idaho<br />
Nevada<br />
Utah<br />
Wyom<strong>in</strong>g.<br />
Ute<br />
Colorado.<br />
Utah<br />
Asslnlbo<strong>in</strong>..<br />
Crow<br />
Hidatsa<br />
Omaha<br />
Ponea<br />
Oklahoma<br />
Santee Sioux<br />
Nebraska<br />
Sioux<br />
Sisseton Sioux<br />
North Dakota<br />
South Dakota<br />
Teton Sioux.<br />
South Dakota..<br />
Brule Sioux<br />
Hunkpapa Sioux. .<br />
.<br />
PiMAN STOCK.<br />
POMO STOCK.<br />
SALISHAN STOCK.<br />
Shahaptian stock.<br />
Shastan stock.<br />
Shoshonean stock.<br />
South Dakota.<br />
M<strong>in</strong>niconjou Sioux.<br />
Oglala Sioux<br />
Sans Arc Sioux<br />
Siha^pa Sioux<br />
Two Kettle Sioux..<br />
O<strong>the</strong>r Teton Sioux.<br />
SlOUAN STOCK.<br />
<strong>in</strong>dians op fulubibal<br />
blood: <strong>1910</strong>.<br />
Male.<br />
137<br />
86<br />
475<br />
3,640<br />
575<br />
3,026<br />
1,731<br />
1,721<br />
567<br />
532<br />
1,873<br />
2,090<br />
222<br />
283<br />
110<br />
334<br />
158<br />
144<br />
116<br />
339<br />
1,053<br />
368<br />
631<br />
346<br />
119<br />
1,264<br />
1,004<br />
156<br />
171<br />
1,632<br />
552<br />
679<br />
112<br />
263<br />
1,132<br />
363<br />
757<br />
378<br />
581<br />
132<br />
443<br />
302<br />
222<br />
186.<br />
319<br />
194<br />
248<br />
665<br />
204<br />
372<br />
4,790<br />
4,695<br />
222<br />
204<br />
198<br />
55<br />
1,849<br />
8<br />
55<br />
34<br />
1,901<br />
Female.<br />
150<br />
100<br />
565<br />
3,335<br />
500<br />
2,791<br />
1,800<br />
1,795<br />
591<br />
666<br />
1,765<br />
1,949<br />
179<br />
285
52 INDIANS IN THE UNITED STATES.<br />
MALES TO 100 FEMALES FOR INDIANS OF FULL-TRIBAL BLOOD, FOR EACH PRINCIPAL TRIBE AND. STATE: <strong>1910</strong>—<br />
Cont<strong>in</strong>ued. ,<br />
Table 34—Cont<strong>in</strong>ued,<br />
[This table sho-ws each tribe hav<strong>in</strong>g 100 or more females of full-tribal blood.]
The <strong>Indian</strong> popula&n of <strong>the</strong> <strong>United</strong> <strong>States</strong> <strong>and</strong> of<br />
<strong>Alaska</strong> is shown by siligle years of age ia Table 38<br />
(p. 57). _ V . . .<br />
In discuss<strong>in</strong>g <strong>the</strong> ag6 distribution of <strong>Indian</strong>s it has<br />
been thought best, however, not to attempt a de-<br />
tailed analysis but to conf<strong>in</strong>e <strong>the</strong> discussion to three<br />
age groups, those compris<strong>in</strong>g persons under 20 years of<br />
age, 20 to 50 years, <strong>and</strong> 51 years <strong>and</strong> over, represent<strong>in</strong>g,<br />
respectively, <strong>the</strong> young, <strong>the</strong> <strong>in</strong>termediate, <strong>and</strong> <strong>the</strong><br />
oldest element of <strong>the</strong> <strong>Indian</strong> <strong>population</strong>. The ages of<br />
<strong>Indian</strong>s are doubtless reported somewhat less accurately<br />
than those of whites, <strong>and</strong> <strong>the</strong> ages of <strong>Indian</strong><br />
women may perhaps be less accurately given than<br />
those of <strong>the</strong> men, but for <strong>the</strong>se broad age groups <strong>the</strong><br />
numbers are approximately correct for <strong>Indian</strong>s of all<br />
classes comb<strong>in</strong>ed. The figures for <strong>the</strong> several classes<br />
of fuU-blood <strong>and</strong> mixed-blood <strong>Indian</strong>s may, however,<br />
be affected by errors <strong>in</strong> classification or by omissions.<br />
AU <strong>Indian</strong>s.—^A comparison of <strong>the</strong> ages of <strong>the</strong> <strong>Indian</strong><br />
<strong>population</strong> as returned at <strong>the</strong> censuses of <strong>1910</strong> <strong>and</strong><br />
1900 is given <strong>in</strong> Table 35.<br />
Table 35<br />
AGE DISTRIBUTION.
54 INDIANS IN THE UNITED STATES.<br />
PROPOKTION OF INDIANS 20 TO 50 YEARS OF AGE: <strong>1910</strong>.<br />
3 Under 10 per cent. XS^ ^0 to 40 per cent.<br />
^^ 10 to 20 per cent. ffigl iO to 50 per cent.<br />
g^ 20 to 30 per cent. ||^ 60 per cent <strong>and</strong> over.<br />
I I Less than 100 <strong>Indian</strong>s <strong>in</strong> state.<br />
PROPORTION OF INDIANS SI YEARS OF AGE AND OVER: <strong>1910</strong>.<br />
Under 10 per cent. K^q 30 to 40 per cent.<br />
10 to 20 per cent. Hgj] 40 to SO per cent.<br />
20 to 30 per cent. HB ^^ P^' cent <strong>and</strong> over.<br />
) I Less than 100 <strong>Indian</strong>s <strong>in</strong> state.<br />
Table 37 shows, for <strong>the</strong> <strong>United</strong> <strong>States</strong> <strong>and</strong> <strong>Alaska</strong>,<br />
<strong>the</strong> age distribution of each of <strong>the</strong> pr<strong>in</strong>cipal stocks <strong>and</strong><br />
tribes, as reported <strong>in</strong> <strong>1910</strong>. The age distribution is<br />
also shown, for each pr<strong>in</strong>cipal tribe <strong>in</strong> <strong>the</strong> <strong>United</strong><br />
<strong>States</strong> <strong>in</strong> <strong>1910</strong>, <strong>in</strong> <strong>the</strong> follow<strong>in</strong>g diagram:<br />
AGE DISTRIBUTION OF INDIANS IN EACH PRINCIPAL TRIBE: <strong>1910</strong>.<br />
CHICKASAW<br />
CHEROKEE<br />
CHOCTAW<br />
NAVAJO<br />
OSAQE<br />
KIOWA<br />
CROATAN<br />
SHAWNEE<br />
POTAWATOMI<br />
ST. REQI3<br />
CREEK<br />
OMAHA<br />
PAPAGO<br />
PIEOAN<br />
SEMINOLE<br />
MENOMINEE<br />
CHIPPEWA<br />
LAQUNA<br />
PIMA<br />
HOPI<br />
APACHE<br />
8ANTEE SIOUX<br />
ONEIDA<br />
HAIDU<br />
SENECA<br />
COMANCHE<br />
OTTAWA<br />
WINNEBAGO<br />
MONO<br />
UTE<br />
TETON SIOUX<br />
ZUNI<br />
8ISSET0N SIOUX<br />
A8SINIBOIN<br />
YANKTON SIOUX<br />
ARAPAHO<br />
CROW<br />
YAKiMA<br />
BH06H0NI<br />
YANATONAI SIOUX<br />
MOHAVE<br />
CHEYENNE<br />
HEZ PERCE8<br />
PAVIOTSO<br />
PER CENT<br />
»»K«K:K»»5«!KS!5S5»S5»«»aii!SS»S!SSSSSiiS5«liSKiXy''X.-:<br />
\//////)v//////^//y////>^//////^(///////h>/y//r^<br />
7jmryMrjyyjyy/'M'/'j'jm,yyjxrMYjia'My/^^^<br />
«»S«5««5554!55S55K!»iK55555Si»4SSSKIi«SS^//^^//.''/X-j««'y-'::::v::<br />
yayyMyMyYM'MY/MyMyy/yyy/yM^^^<br />
rjmYMy//MmyArjYMrMYMYM^^<br />
w/////yyMyMyyyyy/My/yyyMyyyy/y^^^^<br />
vyyyyMy/yMy/mrMmY/yyyyyyyM'yy///yyyy^yyyyyyy/-yyy-<br />
\///M/\///////}////////)v//////M/////^^^^^^j'jt)f^^^Jfimxtmm.<br />
yyy/yy/y/y/M!««iisiimiiryyyy/yy,y/jim'yyyyyyyy^/^xyyyyy9.<br />
^//yy/yyfyyy/^ w^//y^^^^^<br />
y////yy/yaxfy/yy.'/y/yyyy/yyM!iyyA''My/>.fyyyyj'.<br />
t^/////////>/^^^^^<br />
'y/Myy/iyyyyyyyyyyyyyyyyyj'yyyyyyy/yyyAfyyyyyyyyyyyyyyj'<br />
p/y/y///>/y///y4^^^^^^^^<br />
r/my/Am'yyyy^yyyyyyyA'yyyyyyy/yyyyyyyyyyyy/yyyyy.'-sai<br />
ixmmimm/yyyy/yyMiYyyyyyyyyy/yyyyyyyyyyyyyyyyix.v:<br />
y//////4y/////Jsf' /////)i'//^^^^<br />
yyyyyyyj!'yyyyyyyyiyyM'yyyyyyyyyyyA'yyyyyyyyyyyyyyyyyyyyy»»:<br />
YyyyyyyyyyyyjyjYy/yjmyyyyyyyyjiyj'X'yyyyyyyyyyyyyyyy.'&-A-m::i<br />
by//^4y.^j^4m^^^//^xx^<br />
vyyyymr/yyyyyA'yy/yyyyyvyyy/iyyiyyyyyyyyy<br />
y//////M///mM'//////)i////////^/mf'^^^^^<br />
yyyyyy/yy/jyyyyyyyyyyyyyy/yyyyyyyyje'yyyyyyyyyyyyyyyy><br />
/yyyyyyAmyyyyy/yyyyyyyyjyyyyyyyyj yyyyyyyyyyyyyyyyy<br />
vyyy/yyjyyyyy/yyyyyyyyyy/yyyyyyy/,>yyyyyyyyyyyyyyyiyi<br />
yy/yyyyA'yyyy//y/yyyyyyyy/yyyyyyyyyyyyyyyyyyyyyyyy.<br />
^2^2 UNDER 20<br />
BZ&B9> TO aa<br />
a
Table 37<br />
AGE DISTRIBUTION. 55<br />
AGE DISTRIBUTION OF INDIANS, FOR EACH PRINCIPAL STOCK AND TRIBE: <strong>1910</strong>.<br />
[This table shows each stock <strong>and</strong> tribe hav<strong>in</strong>g 200 or more <strong>Indian</strong>s <strong>in</strong> <strong>1910</strong>.]
56 INDIANS IN THE UNITED STATES.<br />
Table S7—Contd.<br />
AGE DISTRIBUTION OF INDIANS, FOR EACH PRINCIPAL STOCK AND TRIBE: <strong>1910</strong>—Contmued.<br />
[Tbls table shows each stock <strong>and</strong> tribe hav<strong>in</strong>g 200 or more <strong>Indian</strong>s <strong>in</strong> <strong>1910</strong>.]
AGE DISTRIBUTION. 57<br />
DISTRIBUTION BY SINGLE YEARS OP AGE OF THE INDIAN POPULATION OF THE UNITED STATES AND<br />
ALASKA.: <strong>1910</strong>.<br />
Table 38<br />
All ages<br />
Under 5 years.<br />
Under 1 year.<br />
1 year<br />
2years<br />
Syears<br />
4years<br />
5 to 9 years.<br />
Syears..<br />
6 years.<br />
7 years.<br />
Syears.<br />
9 years.<br />
10 to 14 years.<br />
10 years.<br />
11 years.<br />
12 years.<br />
13 years.<br />
U years.<br />
15tol9years 28,486<br />
15 years.<br />
16 years.<br />
17 years.<br />
18 years.<br />
19 years.<br />
20 to 24 years.<br />
20 years.<br />
21 years.<br />
22 years.<br />
24 years.<br />
25 to 29 years.<br />
25 years.<br />
26 years.<br />
27 years.<br />
28 years.<br />
30 to 34 years.<br />
30 years.<br />
31 years.<br />
32 years.<br />
33 years.<br />
34 years.<br />
35 to 39 years.<br />
35 years.<br />
36 years.<br />
37 years.<br />
38 years.<br />
39 years.<br />
40to44yeai3<br />
40 years.<br />
41 years.<br />
42 years.<br />
43 years.<br />
44 years.<br />
45 to 49 years.<br />
45 years.<br />
46 years.<br />
47 years.<br />
48 years.<br />
49 years.<br />
Both<br />
sexes.<br />
265,683<br />
40,384<br />
8,216<br />
7,618<br />
8,350<br />
8,232<br />
7,968<br />
36,541<br />
7,634<br />
7,814<br />
7,369<br />
7,265<br />
6,459<br />
31,393<br />
5,412<br />
6,815<br />
5,731<br />
6,452<br />
5,794<br />
6,093<br />
5,199<br />
6,242<br />
5,158<br />
21,844<br />
mnTED STATES.<br />
5,743<br />
4,046<br />
4,392<br />
3,861<br />
3,802<br />
18, 137<br />
4,746<br />
3,529<br />
3,066<br />
3,925<br />
2,871<br />
15,243<br />
5,543<br />
2,050<br />
2,818<br />
2,333<br />
2,499<br />
14,834<br />
4,258<br />
2,636<br />
2,341<br />
3,203<br />
2,396<br />
11,961<br />
5,010<br />
1,505<br />
2,086<br />
1,733<br />
1,627<br />
9,887<br />
3,329<br />
1,568<br />
1,404<br />
1,981<br />
1,605<br />
Male.<br />
135,133<br />
20,202<br />
4,127<br />
3,771<br />
4,225<br />
4,069<br />
4,010<br />
18,349<br />
3,847<br />
3,875<br />
3,727<br />
3,658<br />
3,242<br />
16,199<br />
3,562<br />
2,821<br />
3,486<br />
2,973<br />
3,357<br />
14,612<br />
2,990<br />
3,113<br />
2,652<br />
3,213<br />
2,644<br />
11,265<br />
2,804<br />
2,259<br />
2,286<br />
1,983<br />
1,933<br />
9,237<br />
2,388<br />
1,781<br />
1,619<br />
1,949<br />
1,500<br />
7,756<br />
2,701<br />
1,080<br />
1,469<br />
1,245<br />
1,261<br />
7,721<br />
2,154<br />
1,406<br />
1,227<br />
1,666<br />
1,268<br />
6,126<br />
2,468<br />
787<br />
1,113<br />
895<br />
5,103<br />
1,687<br />
Female.<br />
130,550<br />
20,182<br />
4,089<br />
3,847<br />
4,125<br />
4,163<br />
3,958<br />
18,192<br />
3,787<br />
3,939<br />
3,642<br />
3,607<br />
3,217<br />
15,194<br />
3,421<br />
2,591<br />
3,329<br />
2,758<br />
3,095<br />
13,874<br />
2,804<br />
2,980<br />
2,547<br />
3,029<br />
2,514<br />
10,579<br />
2,939<br />
1,787<br />
2,106<br />
1,878<br />
1,869<br />
8,900<br />
2,358<br />
1,748<br />
1,447<br />
1,976<br />
1,371<br />
7,487<br />
2,842<br />
970<br />
1,349<br />
1,088<br />
1,238<br />
7,113<br />
2,104<br />
1,230<br />
1,114<br />
1,537<br />
1,128<br />
5,835<br />
2,542<br />
718<br />
973<br />
838<br />
764<br />
4,784<br />
Both<br />
25,331<br />
4,127<br />
845<br />
787<br />
845<br />
3,160<br />
740<br />
664<br />
618<br />
629<br />
509<br />
2,250<br />
497<br />
379<br />
482<br />
437<br />
455<br />
2,497<br />
509<br />
492<br />
467<br />
548<br />
481<br />
2,325
68 INDIANS IN THE UNITED STATES.<br />
FvHrhlood <strong>and</strong> mixed-Uood <strong>Indian</strong>s.—T&hle 40 shows<br />
for <strong>the</strong> <strong>United</strong> <strong>States</strong> as a whole <strong>and</strong> for <strong>Alaska</strong> <strong>the</strong><br />
distribution by age groups of <strong>the</strong> <strong>Indian</strong> <strong>population</strong>,<br />
classified by sex <strong>and</strong> by <strong>the</strong> different mixtures of blood;<br />
<strong>and</strong> Table 41 shows for divisions <strong>and</strong> states a similar<br />
age distribution of <strong>the</strong> aggregate <strong>Indian</strong> <strong>population</strong><br />
<strong>and</strong> of <strong>the</strong> full-bloods <strong>and</strong> mixed-bloods separately.<br />
Table 39 shows, <strong>in</strong> percentages, <strong>the</strong> age distribution<br />
of <strong>Indian</strong>s classified accord<strong>in</strong>g to mixture of blood.<br />
The fact that st<strong>and</strong>s out most prom<strong>in</strong>ently is <strong>the</strong><br />
high proportion of young persons among <strong>the</strong> mixed-<br />
bloods as compared with <strong>the</strong> full-bloods. A similar<br />
difference is to be noted between <strong>the</strong> mixed-tribal<br />
bloods <strong>and</strong> <strong>the</strong> full-tribal bloods. In both cases <strong>the</strong><br />
difference may be accounted for <strong>in</strong> part by <strong>the</strong> fact<br />
that mixed marriages had not become common until<br />
with<strong>in</strong> comparatively recent years. Ano<strong>the</strong>r reason<br />
for <strong>the</strong> predom<strong>in</strong>ance of <strong>the</strong> young element among <strong>the</strong><br />
mixed-bloods is no doubt found <strong>in</strong> <strong>the</strong> greater fertility<br />
of mixed marriages, which is discussed later (p. 157).<br />
It is evident that differences noted among <strong>the</strong> several<br />
states with respect to <strong>the</strong> age distribution of <strong>Indian</strong>s<br />
may be due <strong>in</strong> part to differences <strong>in</strong> <strong>the</strong> extent to which<br />
mixed marriages have taken place.<br />
Table 39<br />
INDIANS IN THE UNITED STATES AND ALASKA, CLASSIFIED ACCORDING TO SEX AND AGE PERIODS,<br />
MIXTURE OF BLOOD: <strong>1910</strong>.
AGE DISTRIBUTION. 59<br />
INDIANS IN THE UNITED STATES, BY DIVISIONS AND STATES, AND IN ALASKA., CLASSIFIED ACCORDING TO<br />
PURITY OF BLOOD AND AGE PERIODS: <strong>1910</strong>.<br />
Table 41<br />
DIVISION AND STATE.<br />
Total.<br />
<strong>United</strong> <strong>States</strong> 266,<br />
Oeoobafhic divisions:<br />
New Engl<strong>and</strong><br />
U:iddle Atlantic<br />
East North Central.<br />
West North Central.<br />
South Atlantic<br />
East South Central .<br />
West South Central.<br />
Mounta<strong>in</strong>...'<br />
Pacific<br />
New Engl<strong>and</strong>:<br />
Ma<strong>in</strong>e<br />
New Hampshire.<br />
Vermont<br />
Massachusetts<br />
Bhode Isl<strong>and</strong><br />
Connecticut<br />
Middle Atlantic:<br />
New York<br />
New Jersey<br />
Pennsylvania...<br />
East Nobth Central:<br />
Ohio<br />
<strong>Indian</strong>a<br />
Ill<strong>in</strong>ois<br />
Michigan<br />
Wiscons<strong>in</strong><br />
West Nokth Central:<br />
M<strong>in</strong>nesota<br />
Iowa.<br />
Missouri<br />
North Dakota<br />
South DEikota<br />
Nebraska<br />
Soms Atlantic:<br />
Delaware<br />
Maryl<strong>and</strong><br />
. .<br />
District of Columbia.<br />
Virgmla<br />
West Virg<strong>in</strong>ia<br />
North Carol<strong>in</strong>a<br />
South Carol<strong>in</strong>a<br />
" Georgia<br />
Elorida<br />
East Sottth Central:<br />
Kentucky<br />
Alabama.<br />
West SotfiH Central:<br />
Arkansas<br />
Louisiana<br />
Oklahoma<br />
Texas<br />
Hoitnta<strong>in</strong>:<br />
Montana<br />
Idaho<br />
Wyom<strong>in</strong>g. .<br />
Colorado<br />
New Mexico.<br />
Arizona.<br />
Utah<br />
Nevada.<br />
Pacific:<br />
Wash<strong>in</strong>gton.<br />
Oregon<br />
Caluomia<br />
<strong>Alaska</strong>.<br />
.<br />
2,076<br />
7,717<br />
18,256<br />
41,406<br />
9,054<br />
2,612<br />
76,767<br />
75,338<br />
32,458<br />
34<br />
284<br />
152<br />
6,046<br />
Under<br />
20years<br />
oiage.<br />
ALL INDIANS.<br />
20 to 60<br />
years<br />
ol age.<br />
61 years<br />
of age<br />
ana<br />
over.<br />
Age<br />
unknown,<br />
Total.<br />
PULL-BLOOD INDIANS.<br />
Under 20 to 60<br />
20 years years<br />
of age of age.<br />
61 years<br />
ofage<br />
<strong>and</strong><br />
over.<br />
Age<br />
unknown.<br />
Total.<br />
MIXED-BLOOD INDIANS.<br />
Under<br />
20 years<br />
of age.<br />
20 to 50<br />
years<br />
of age.<br />
51 years<br />
ofage<br />
<strong>and</strong><br />
over.<br />
136,804 95,967 31,963 949 150,053 67,129 68,304 24,019 601 93,423 58,653 29,008 6,726<br />
836<br />
3,672<br />
8,765<br />
20,072<br />
4,946<br />
1,468<br />
44,703<br />
37,541<br />
14,802<br />
369<br />
13<br />
9<br />
280<br />
122<br />
62<br />
S72<br />
3,160<br />
6,775<br />
14,849<br />
3,164<br />
912<br />
25,924<br />
28,164<br />
12,157<br />
360<br />
869<br />
2,668<br />
6,400<br />
936<br />
231<br />
6,924<br />
9,262<br />
5,313<br />
26<br />
47<br />
85<br />
8<br />
1<br />
216<br />
371<br />
186<br />
448<br />
3,441<br />
8,838<br />
22,903<br />
1,440<br />
1,083<br />
26,417<br />
66,319<br />
20,164<br />
149<br />
1,662<br />
3,629<br />
9,173<br />
645<br />
577<br />
11,777<br />
31,947<br />
7,670<br />
194<br />
1,425<br />
3,446<br />
8,639<br />
669<br />
397<br />
11,280<br />
24,571<br />
7,783<br />
105<br />
444<br />
1,725<br />
5,040<br />
221<br />
109<br />
3,239<br />
8,568<br />
4,678<br />
121<br />
243<br />
872<br />
2,620<br />
7,631<br />
16,159<br />
6,344<br />
396<br />
44,552<br />
5,945<br />
8,904<br />
Age<br />
unknown.
60 INDIANS IN THE UNITED STATES.<br />
Table 42<br />
<strong>United</strong> <strong>States</strong>... 150,053<br />
Arizona<br />
California<br />
Colorado<br />
Idaho<br />
Kansas'<br />
Mlcliigan<br />
U<strong>in</strong>nesota<br />
Uississippi<br />
Montana<br />
Nebraslia<br />
Nevada<br />
New Mexico<br />
New York<br />
North Carol<strong>in</strong>a<br />
North Dakota<br />
Oklahoma<br />
Oregon<br />
South Dakota<br />
Utah<br />
Wash<strong>in</strong>gton<br />
Wiscons<strong>in</strong><br />
Wyom<strong>in</strong>g<br />
Total for 22 states-<br />
All o<strong>the</strong>r states<br />
AU<br />
ages:i<br />
<strong>1910</strong>.<br />
27,087<br />
10,493<br />
718<br />
2,864<br />
516<br />
3,528<br />
3,859<br />
1,077<br />
6,204<br />
2,294<br />
4,287<br />
20,085<br />
2,850<br />
1,394<br />
2,499<br />
25,887<br />
2,901<br />
13,247<br />
2,900<br />
6,770<br />
5,249<br />
1,174<br />
147,883<br />
2,170<br />
irNDEE 20 YEABS<br />
OF AGE.<br />
Number.<br />
67,129<br />
14,340<br />
4,007<br />
351<br />
1,021<br />
189<br />
1,338<br />
1,638<br />
576<br />
2,301<br />
996<br />
1,583<br />
10,561<br />
1,260<br />
635<br />
1,002<br />
11,501<br />
1,050<br />
5,085<br />
1,300<br />
2,613<br />
2,275<br />
490<br />
66, 112<br />
1,017<br />
Per<br />
cent.<br />
20 TO 50 TEAES<br />
OF AGE.<br />
Number.<br />
Per<br />
cent.<br />
INDIANS OF rULL BLOOD.<br />
44.7<br />
52.9<br />
38.2<br />
48.9<br />
35.6<br />
36.6<br />
37.9<br />
42.4<br />
53.5<br />
37.1<br />
43.4<br />
36.9<br />
52.6<br />
44.2<br />
45.6<br />
40.1<br />
44.4<br />
36.2<br />
38.4<br />
44.8<br />
38.6<br />
43.3<br />
41.7<br />
44.7<br />
46.9<br />
1 Totals <strong>in</strong>clude <strong>Indian</strong>s of unknown age.<br />
58,304<br />
9,634<br />
4,149<br />
254<br />
1,154<br />
224<br />
1,424<br />
1,455<br />
394<br />
2,508<br />
S81<br />
1,937<br />
7,421<br />
1,140<br />
541<br />
901<br />
11,069<br />
1,102<br />
4,987<br />
1,165<br />
2,532<br />
1,988<br />
498<br />
57,358<br />
946<br />
51 TEARS OF AGE<br />
AND OVEE.<br />
Number.<br />
38.9 24,019<br />
35.6<br />
39.5<br />
35.4<br />
40.3<br />
43.4<br />
40.4<br />
37.7<br />
36.6<br />
40.4<br />
38.4<br />
45.2<br />
36.9<br />
40.0<br />
38.8<br />
36.1<br />
42.8<br />
38.0<br />
37.6<br />
40.2<br />
37.4<br />
37.9<br />
42.4<br />
38.8<br />
43.6<br />
2,979<br />
2,266<br />
112<br />
655<br />
96<br />
757<br />
763<br />
107<br />
1,391<br />
413<br />
752<br />
2,078<br />
440<br />
213<br />
587<br />
3,198<br />
744<br />
3,149<br />
409<br />
1,568<br />
957<br />
182<br />
23,816<br />
203<br />
Per<br />
cent.<br />
16.0<br />
11.0<br />
21.6<br />
15.6<br />
22.9<br />
18.6<br />
21.5<br />
19.8<br />
9.9<br />
22.4<br />
18.0<br />
17.5<br />
10.3<br />
15.4<br />
15.3<br />
23.5<br />
12.4<br />
25.6<br />
23.8<br />
14.1<br />
23.2<br />
18.2<br />
15.5<br />
16.1<br />
9.4<br />
<strong>United</strong> <strong>States</strong>.<br />
Arizona<br />
Calilornia<br />
Colorado ,<br />
Idaho<br />
Kansas'<br />
Michigan<br />
M<strong>in</strong>nesota<br />
Mississippi<br />
Montana<br />
Nebraska<br />
Nevada<br />
New Mexico<br />
New York<br />
North Carol<strong>in</strong>a<br />
North Dakota<br />
Oklahoma<br />
Oregon<br />
South Dakota<br />
Utah<br />
Wash<strong>in</strong>gton<br />
Wiscons<strong>in</strong><br />
Wyom<strong>in</strong>g<br />
Total for 22 states.<br />
All o<strong>the</strong>r states<br />
'<br />
All<br />
ages:<br />
<strong>1910</strong>.<br />
93,423<br />
414<br />
4,217<br />
50<br />
S14<br />
889<br />
3,218<br />
4,886<br />
90<br />
3,895<br />
939<br />
508<br />
175<br />
2,028<br />
5,855<br />
3,561<br />
44,288<br />
1,668<br />
6,408<br />
105<br />
3,019<br />
4,330<br />
284<br />
90,341<br />
3,082<br />
UNDEK20YEABS<br />
or AGE.<br />
Number.<br />
58,553<br />
283<br />
2,641<br />
37<br />
308<br />
508<br />
1,717<br />
2,882<br />
55<br />
2,376<br />
629<br />
341<br />
120<br />
1,025<br />
3,325<br />
2,171<br />
29,385<br />
1,125<br />
3,241<br />
61<br />
1,875<br />
2,531<br />
171<br />
56,807<br />
1,746<br />
Per<br />
cent.<br />
20 TO 50 YEABS<br />
OF AGE.<br />
Number.<br />
Per<br />
cent.<br />
INDIANS OF MIXED BLOOD.<br />
62.7<br />
68.4<br />
62.6<br />
74.0<br />
69.9<br />
57.1<br />
53.4<br />
59.0<br />
61.1<br />
61.0<br />
67.0<br />
67.1<br />
68.6<br />
60.6<br />
56.8<br />
61.0<br />
66.3<br />
67.4<br />
59.9<br />
58.1<br />
62.1<br />
58.5<br />
60.2<br />
62.9<br />
56.7<br />
29,008<br />
114<br />
1,443<br />
7<br />
187<br />
317<br />
1,148<br />
1,627<br />
26<br />
1,317<br />
265<br />
164<br />
47<br />
758<br />
1,992<br />
1,086<br />
12,572<br />
475<br />
1,840<br />
36<br />
980<br />
1,418<br />
97<br />
27, 916<br />
1,092<br />
31.1<br />
27.5<br />
34.2<br />
14.0<br />
36.4<br />
35.7<br />
35.7<br />
33.3<br />
28.9<br />
33.8<br />
28.2<br />
32.3<br />
26.9<br />
37.4<br />
34.0<br />
30.5<br />
28.4<br />
28.6<br />
34.0<br />
34.3<br />
32.5<br />
32.7<br />
34.2<br />
30.9<br />
35.4<br />
51 TEABS OF AGE<br />
AND OVER.<br />
Number.<br />
5,726<br />
16<br />
123<br />
6<br />
17<br />
63<br />
351<br />
374<br />
9<br />
198<br />
45<br />
3<br />
8<br />
241<br />
536<br />
300<br />
2,275<br />
65<br />
317<br />
'4<br />
147<br />
376<br />
16<br />
2 Exclusive of <strong>Indian</strong>s <strong>in</strong> Haskell Institute, who are <strong>in</strong>cluded <strong>in</strong> <strong>the</strong> total for "All o<strong>the</strong>r states."<br />
AGE DISTRIBUTION OF INDIANS OF FULL BLOOD AND OP MIXED BLOOD, FOR EACH PRINCIPAL STOCK AND<br />
TRIBE: <strong>1910</strong>.<br />
Table 43<br />
[This table shows each stock <strong>and</strong> tribe hav<strong>in</strong>g 200 or more <strong>Indian</strong>s <strong>in</strong> <strong>1910</strong>. Per cent not shown where base is less than 50.]<br />
5,490<br />
Per<br />
cent.<br />
6.1<br />
3.9<br />
2.9<br />
12.0<br />
3.3<br />
7.1<br />
10.9<br />
7.7<br />
10.0<br />
5.1<br />
'4.S<br />
0.6<br />
4.6<br />
11.9<br />
9.2<br />
8.4<br />
5.1<br />
3.9<br />
r5.9<br />
3.8<br />
4.9<br />
8.7<br />
5.6<br />
6.1<br />
7.7
AGE DISTRIBUTION. 61<br />
AGE DISTKIBUTION OF INDIANS OF FULL BLOOD AND OF MIXED BLOOD, FOB EACH PRINCIPAL STOCK AND<br />
TEIBE: <strong>1910</strong>—Contmued.<br />
Table 43—Cont<strong>in</strong>ued.<br />
[This table shows each stock <strong>and</strong> tribe hav<strong>in</strong>g 200 or mpre <strong>Indian</strong>s <strong>in</strong> <strong>1910</strong>. Per cent not shown where base is less than 50.]
62 INDIANS IN THE UNITED STATES.<br />
AGE DISTRIBUTION OF INDIANS OF FULL BLOOD AND OF MIXED BLOOD, FOR EACH PRINCIPAL STOCK AND<br />
TRIBE: <strong>1910</strong>—Cont<strong>in</strong>ued.<br />
Table 43—Cont<strong>in</strong>ued.<br />
[Tbis table sbo'ws eacb stock <strong>and</strong> tribe hav<strong>in</strong>g 200 or more <strong>Indian</strong>s <strong>in</strong> <strong>1910</strong>. Per cent not shown where base Is less than 50.]
AGE DISTRIBUTION. 63<br />
AGE DISTRIBTTTION OF INDIANS OF FULL BLOOD AND OF MIXED BLOOD, FOR EACH PRINCIPAL STOCK AND<br />
TRIBE: <strong>1910</strong>—Cont<strong>in</strong>ued.<br />
Table 43—C!ontlnued.<br />
[ This table shows each stock <strong>and</strong> tribe hav<strong>in</strong>g 200 or more <strong>Indian</strong>s <strong>in</strong> <strong>1910</strong>. Per cent not shown where base is less than 50.]
64 INDIANS IN THE UNITED STATES.<br />
Sex ratios, iy age groups.—Table 44 shows' <strong>the</strong> number<br />
of <strong>Indian</strong> males to 100 <strong>Indian</strong> females, by age<br />
groups, <strong>in</strong> <strong>the</strong> <strong>United</strong> <strong>States</strong> <strong>and</strong> <strong>Alaska</strong> <strong>in</strong> <strong>1910</strong>.<br />
Table 44<br />
AH ages<br />
Under 20 years...<br />
20 to 50 years<br />
61 years <strong>and</strong> over<br />
AGE PERIOD.<br />
MALES TO 100 FEMALES<br />
IN THE INDIAN POPU-<br />
LATION: <strong>1910</strong>.<br />
<strong>United</strong><br />
<strong>States</strong>.<br />
103.5<br />
102.8<br />
106.4<br />
100.7<br />
<strong>Alaska</strong>.<br />
. 105.<br />
;<br />
105.8<br />
105.0<br />
105.6<br />
It appears that <strong>in</strong> <strong>the</strong> <strong>United</strong> <strong>States</strong> <strong>in</strong> <strong>1910</strong> <strong>the</strong><br />
reported excess of males was greatest <strong>in</strong> <strong>the</strong> group 20<br />
to 50 years of age. In <strong>Alaska</strong> <strong>the</strong> proportion of <strong>the</strong><br />
sexes varied little <strong>in</strong> <strong>the</strong> different age groups.<br />
Table 45 shows, for each of <strong>the</strong> 22 selected states,<br />
<strong>the</strong> number of males to 100 females <strong>in</strong> each age group,<br />
while similar statistics for each pr<strong>in</strong>cipal stock <strong>and</strong><br />
tribe <strong>in</strong> <strong>the</strong> <strong>United</strong> <strong>States</strong> <strong>and</strong> <strong>Alaska</strong> are presented<br />
<strong>in</strong> Table 46 (p. 65). The excess of males or females<br />
<strong>in</strong> each age group is also shown graphically, by states,<br />
<strong>in</strong> <strong>the</strong> maps on this page.<br />
Table 45<br />
<strong>United</strong> <strong>States</strong>...<br />
Arizona<br />
Calilbmia<br />
Colorado<br />
Idaho<br />
Kansas'<br />
Michigan<br />
M<strong>in</strong>nesota<br />
Mississippi<br />
Montana<br />
Kebraslca<br />
Nevada ,<br />
New Mexico<br />
New York<br />
North Carol<strong>in</strong>a<br />
North Dakota<br />
Oklahoma<br />
Oregon<br />
South Dakota<br />
Utah<br />
Wash<strong>in</strong>gton<br />
Wiscons<strong>in</strong><br />
Wyom<strong>in</strong>g<br />
Under 20 years of<br />
age.<br />
Male.<br />
Fe-<br />
Males<br />
to 100<br />
male. fe-<br />
INDIAN <strong>population</strong>: <strong>1910</strong>.<br />
20 to 50 years of<br />
age.<br />
Male.<br />
Fe-<br />
Males<br />
to 100<br />
male. le-<br />
51 years of age <strong>and</strong><br />
over.<br />
Male.<br />
Fe- to 100<br />
male.females. 67,442 102.8 49,254 46,713 105.4 16,036 15,927 100.7<br />
7,965<br />
3,702<br />
7,424<br />
3,618<br />
107.3<br />
102.3<br />
5,351<br />
3,293<br />
5,134<br />
3,059<br />
104.2<br />
107.6<br />
1,647<br />
1,319<br />
1,519<br />
i,r-<br />
10a4<br />
102.6<br />
466<br />
700<br />
372<br />
659<br />
125.0<br />
106.2<br />
253<br />
705<br />
221<br />
689<br />
114 5<br />
102.3<br />
89<br />
345<br />
77<br />
351<br />
l'><br />
98.3<br />
614<br />
1,765<br />
425<br />
1,659<br />
120.9<br />
ioa4<br />
432<br />
1,565<br />
272<br />
1,321<br />
150.8<br />
117.7<br />
117<br />
641<br />
82<br />
666<br />
(')<br />
113.3<br />
2,411 2,246 107.3 1,616 1,600 100.9 546 626 87.1<br />
356 317 112.0 235 217 108.3 79 49 (')<br />
2,525<br />
902<br />
2,469<br />
872<br />
102.3<br />
103.4<br />
2,123<br />
634<br />
1,940<br />
609<br />
109.4<br />
1041<br />
734<br />
240<br />
943<br />
240<br />
77.8<br />
100.0<br />
1,031 1,023 100. 1,14G 1,158 99.0 414 389 106.4<br />
5,386 5,448 98.9 3,911 3,673 106.5 1,109 1,015 109.3<br />
1,318 1,419 92.9 1,281 1,172 109.3 462 368 125.5<br />
2,181<br />
1,634<br />
2,136<br />
1,737<br />
102.2<br />
941<br />
1,336<br />
1,129<br />
1,377<br />
1,026<br />
97.0<br />
110.0<br />
443<br />
465<br />
372<br />
490<br />
119.1<br />
92.9<br />
22,107 21,669 102.5 12,625 12,671 98.8 2,949 2,797 105.4<br />
1,245 1,182 106.3 912 870 104.8 374 497 75.3<br />
4,336 4,227 102.6 3,541 3,459 102.4 1, 1,888 87.2<br />
747 660 113.2 668 682 114 8 234 191 122.5<br />
2,647<br />
2,642<br />
328<br />
2,508<br />
2,561<br />
101.6<br />
99.6<br />
96.8<br />
2,046<br />
1,--<br />
325<br />
1,977<br />
1,705<br />
285<br />
103.5<br />
113.1<br />
114.0<br />
862<br />
738<br />
105<br />
975<br />
643<br />
100<br />
88.4<br />
114 8<br />
106.0<br />
Total for 22 states. 66,706 64,869 102.8 46,944 45,017 104 3 15,547 15,464<br />
All o<strong>the</strong>r states<br />
2,656 2,583 102.8 2,310 1,"' 136.2<br />
100.6<br />
106.6<br />
1 Ratio not shown, <strong>the</strong> number of females be<strong>in</strong>g less than 100.<br />
' Exclusive of <strong>Indian</strong>s <strong>in</strong> Haskell Institute, who are <strong>in</strong>cluded <strong>in</strong> <strong>the</strong> total for<br />
"All o<strong>the</strong>r states."<br />
EXCESS OF MALES OR FEMALES AMONG INDIANS UNDER 20<br />
YEARS OF AGE: <strong>1910</strong>.<br />
mjlj Excess of males. BSSSSS Excess of females. gg^ Number Identical.<br />
[<br />
1<br />
Less than lOO <strong>Indian</strong>s under 20 years of age In state.<br />
EXCESS OF MALES OR FEMALES AMONG INDIANS 20 TO 60<br />
YEARS OF AGE: <strong>1910</strong>.<br />
^Mt Excess of males. ^^ Excess of females. fj^/y/A Number identical,<br />
t I Less than 100 <strong>Indian</strong>s 20 to 60 years of age <strong>in</strong> state*.<br />
EXCESS OF MALES OR FEMALES AMONG INDIANS 51 YEARS OF<br />
AGE AND OVER: <strong>1910</strong><br />
WM Excess of males. tSSSSi Excess of females. (PZ!^ Number IdentlcaL<br />
I 1 Less than 100 <strong>Indian</strong>s 51 years of age <strong>and</strong> over In state.
Table 46<br />
AGE DISTRIBUTION. 65<br />
MALES TO 100 FEMALES IN EACH AGE GROUP, FOR EACH PRINCIPAL STOCK AND TRIBE: <strong>1910</strong>.<br />
[This table shows each stock <strong>and</strong> tribe hay<strong>in</strong>g 200 or more <strong>Indian</strong>s <strong>in</strong> <strong>1910</strong>. Batio not shown where number of females is less than 100.]
66 INDIANS IN THE UNITED STATES.<br />
MALES TO 100 FEMALES IN EACH AGE GROUP, FOR EACH PRINCIPAL STOCK AND TRIBE: <strong>1910</strong>—Cont<strong>in</strong>ued.<br />
Table 46—Contd.<br />
[This table shows each stock <strong>and</strong> tribe hav<strong>in</strong>g 200 or more <strong>Indian</strong>s <strong>in</strong> <strong>1910</strong>. Ratio not shown where number ol females is less than 100.)
een more frequently exposed to <strong>the</strong> dangers of war<br />
tihan tlie mixed-bloods, <strong>and</strong> that this was more frequently<br />
<strong>the</strong> case <strong>in</strong> <strong>the</strong> period when <strong>the</strong> <strong>Indian</strong>s who<br />
are now <strong>in</strong> <strong>the</strong> older age group were young than dur<strong>in</strong>g<br />
<strong>the</strong> lifetime of those <strong>in</strong> <strong>the</strong> o<strong>the</strong>r age groups. Errors<br />
<strong>in</strong> classification of <strong>Indian</strong> women have probably also<br />
affected <strong>the</strong> statistics.<br />
Table 48<br />
.<br />
UNSEB 20 YEABS<br />
OF AQE.<br />
<strong>United</strong> <strong>States</strong> 34,200 32,929 103.9<br />
20 TO SO TEABS<br />
OF AGE.<br />
AGE DISTRIBUTION. 67<br />
51 YEASS OF AQE<br />
AND OVER.<br />
Male. Fe-<br />
Males<br />
to<br />
male. 100 fe-<br />
Male.<br />
males.Fe-<br />
Males<br />
to<br />
male. 100 fe-<br />
Male.<br />
males.Fe-<br />
Males<br />
to<br />
male. 100 females.<br />
INDIAKS OF FULL BLOOD.<br />
1,415 28,889 101.8 11,75712,262<br />
Arizona...<br />
7,401 6,939 106.7 4,i 4,738 103.3 1,546 1,433 107.9<br />
California.<br />
2,042 1,965 103.9 2,009 2,080 99.5 1,135 1,131 100.4<br />
Colorado..<br />
Idaho<br />
181<br />
524<br />
170<br />
497<br />
106.5<br />
105.4<br />
126<br />
570<br />
128<br />
584<br />
98.4<br />
97.6<br />
62<br />
319<br />
50<br />
336<br />
(})<br />
94.9<br />
Michigan<br />
108<br />
698<br />
81<br />
640 iS.i<br />
155<br />
749<br />
69<br />
675 111.0<br />
60<br />
386<br />
36<br />
371<br />
(')<br />
104.0<br />
If<strong>in</strong>nesota<br />
Mississippi<br />
Montana<br />
879<br />
306<br />
1,127<br />
759<br />
270<br />
1,174<br />
115.8<br />
113.3<br />
96.0<br />
702<br />
203<br />
1,274<br />
753<br />
191<br />
1,234<br />
93.2<br />
106.3<br />
103.2<br />
328<br />
68<br />
587<br />
435<br />
39<br />
804<br />
75.4<br />
n<br />
73.0<br />
Nebraska<br />
Nevada<br />
New Mexico<br />
'.<br />
New York<br />
North Carol<strong>in</strong>a.<br />
511<br />
812<br />
5,253<br />
608<br />
336<br />
485<br />
771<br />
5,308<br />
652<br />
299<br />
105.4<br />
105.3<br />
99.0<br />
93.3<br />
112.4<br />
440<br />
941<br />
3,829<br />
583<br />
441<br />
996<br />
3,592<br />
557<br />
272<br />
99.8<br />
94.5<br />
106.6<br />
104.7<br />
98.9<br />
204<br />
389<br />
1,087<br />
240<br />
110<br />
209<br />
363<br />
991<br />
200<br />
103<br />
97.6<br />
107.2<br />
109.7<br />
120.0<br />
106.8<br />
North Dakota..<br />
Oklahoma<br />
Oregon<br />
506<br />
5,<br />
540<br />
496<br />
5,635<br />
510<br />
102.0<br />
104.1<br />
105.9<br />
5,432<br />
540<br />
432<br />
5,637<br />
562<br />
108.6<br />
96.4<br />
96.1<br />
260<br />
1,597<br />
303<br />
327<br />
1,601<br />
441<br />
79.5<br />
99.8<br />
68.7<br />
South Da,kota..<br />
Utah<br />
Wash<strong>in</strong>gton<br />
Wiscons<strong>in</strong><br />
Wyom<strong>in</strong>g<br />
Total for 22 states.<br />
2,573 2,512<br />
701 599<br />
1,332 1,281<br />
1,115 1,160<br />
250 240<br />
33,669 32,443<br />
102.4 2,481 2,506<br />
117.0 612 553<br />
104.0 1,207 1,325<br />
96.1 1,017 971<br />
104.2 261 237<br />
103.8 28,825 28,533<br />
99.0 1,434 1,715<br />
110.7 223 186<br />
91.1 733 835<br />
104.7<br />
471<br />
110.1<br />
90<br />
101.0 11,649 12,167<br />
83.6<br />
119.9<br />
87.8<br />
103.2<br />
«<br />
95.7<br />
All o<strong>the</strong>r states<br />
531 486 109.3 590 356 165.7 108 95<br />
1 Ratio not shown, <strong>the</strong> number of females be<strong>in</strong>g less than 100.<br />
95.9<br />
.<br />
Table 48 shows, for each of <strong>the</strong> 22 selected states,<br />
<strong>the</strong> number of males to 100 females <strong>in</strong> each age<br />
group among <strong>the</strong> <strong>Indian</strong>s of full blood <strong>and</strong> of mixed<br />
blood, respectively, while similar statistics, for each<br />
stock <strong>and</strong> tribe ia <strong>the</strong> <strong>United</strong> <strong>States</strong> <strong>and</strong> <strong>Alaska</strong> hav-<br />
<strong>in</strong>g 200 or more <strong>Indian</strong>s <strong>in</strong> <strong>1910</strong>, are presented <strong>in</strong><br />
Table 49.<br />
Arizona<br />
California.<br />
Colorado...<br />
Idaho<br />
Michigan..<br />
M<strong>in</strong>nesota.<br />
<strong>United</strong> <strong>States</strong>...<br />
Montana..<br />
Nebraska<br />
Nevada<br />
New Mexico<br />
New York<br />
North Carol<strong>in</strong>a.<br />
North Dakota..<br />
Okl^oma<br />
Oregon<br />
South Dakota..<br />
Utah.:<br />
Wash<strong>in</strong>gton<br />
Wiscons<strong>in</strong><br />
Wyom<strong>in</strong>g<br />
T7NDEB 20 TEABS<br />
OF AGE.<br />
Male.<br />
Total for 22 states .. 28, 728 28,079<br />
All o<strong>the</strong>r states 884<br />
20 TO 50 YEABS<br />
OF AGE.<br />
51 TEAKS OP AGE<br />
AND OVEB.<br />
Males<br />
Fe- to<br />
male. 100 fe-<br />
Male.<br />
males.Fe-<br />
Males<br />
to<br />
male. 100 feFe-<br />
to<br />
Male.<br />
male. 100 females.males.<br />
INDIANS OF MIXED BLOOD.<br />
1,612 28,941 102.3 15,29513,713 111.5 3,176 2,650 124.5<br />
168<br />
1,343<br />
23<br />
158<br />
115<br />
S4<br />
150<br />
146.1<br />
103.5<br />
(')<br />
105.3<br />
281 227 123.8<br />
880 837 105.1<br />
1,467 1,415 103.7<br />
26 29 (')<br />
1,230 1,146 107.3<br />
314 315 99.7<br />
159 182 87.4<br />
63 57 {')<br />
509 516 98.<br />
1,665 1,660 100.3<br />
1,022 1,149 88.9<br />
14,875 14,510 102.5<br />
587 538 109.1<br />
1,637 1,604 102.1<br />
23 38 (>)<br />
934 941 99.3<br />
1,287 1,244 103.6<br />
77 94 (')<br />
102.3<br />
102.6<br />
67<br />
824<br />
2<br />
105<br />
187<br />
639<br />
847<br />
14<br />
713<br />
143<br />
92<br />
26<br />
404<br />
981<br />
569<br />
i,388<br />
261<br />
984<br />
26<br />
561<br />
782<br />
57<br />
47<br />
619<br />
5<br />
82<br />
130<br />
509<br />
780<br />
12<br />
604<br />
122<br />
72<br />
21<br />
354<br />
1,011<br />
517<br />
6,184<br />
214<br />
856<br />
10<br />
419<br />
636<br />
40<br />
14,672 13,244<br />
623<br />
1''<br />
133.1<br />
143.8<br />
125.5<br />
108.6<br />
(>)<br />
118.0<br />
117.2<br />
114.1<br />
97.0<br />
110.1<br />
103.3<br />
122.0<br />
116.0<br />
«<br />
133.9<br />
123.0<br />
110.8<br />
132.8<br />
11<br />
82<br />
4<br />
11<br />
37<br />
205<br />
198<br />
5<br />
105<br />
24<br />
1<br />
5<br />
136<br />
298<br />
166<br />
169<br />
2<br />
87<br />
227<br />
3,053<br />
123<br />
146<br />
176<br />
4<br />
93<br />
21<br />
2<br />
3<br />
105<br />
238<br />
134<br />
1,043<br />
26<br />
148<br />
2<br />
60<br />
149<br />
7<br />
2,437<br />
113<br />
^ Exclusive of <strong>Indian</strong>s <strong>in</strong> Haskell Institute, who are <strong>in</strong>cluded <strong>in</strong> <strong>the</strong> total for "All o<strong>the</strong>r states."<br />
MALES TO 100 FEMALES IN EACH AGE GROUP AMONG INDIANS OF FULL BLOOD AND OF MIXED BLOOD, FOR<br />
EACH PRINCIPAL STOCK AND TRIBE: <strong>1910</strong>.<br />
Table 49<br />
[This table shows each stock <strong>and</strong> tribe hav<strong>in</strong>g 200 or more <strong>Indian</strong>s <strong>in</strong> <strong>1910</strong>. Ratio not shown where number of females is less than 100.)<br />
126.3<br />
108.8
68 INDIANS IN THE UNITED STATES.<br />
MALES TO 100 FEMALES IN EACH AGE GROUP AMONG INDIANS OF FULL BLOOD AND OF MIXED BLOOD, FOR<br />
EACH PRINCIPAL STOCK AND TRIBE: <strong>1910</strong>—Cont<strong>in</strong>ued.<br />
Table 49—Cont<strong>in</strong>ued.<br />
[This table shows each stock <strong>and</strong> tribe haT<strong>in</strong>g 200 or more <strong>Indian</strong>s <strong>in</strong> <strong>1910</strong>. Ratio not stiown where number of females is less than 100.]
AGE DISTRIBUTION. 69<br />
MALES TO 100 FEMALES IN EACH AGE GROUP AMONG INDIANS OF FULL BLOOD AND OF MIXED BLOOD, FOR<br />
EACH PRINCIPAL STOCK AND TRIBE: <strong>1910</strong>-Cont<strong>in</strong>ued.<br />
Table 49—Cont<strong>in</strong>ued.<br />
[This table shows each stock <strong>and</strong> tribe hav<strong>in</strong>g 200 or more <strong>Indian</strong>s <strong>in</strong> <strong>1910</strong>. Ratio not shown where number of females is less than 100.]
70 INDIANS IN THE UNITED STATES.<br />
MALES TO 100 FEMALES IN EACH AGE GROUP AMONG INDIANS OF FULL BLOOD AND OP MIXED BLOOD, FOR<br />
EACH PRINCIPAL STOCK AND TRIBE: <strong>1910</strong>—Cont<strong>in</strong>ued.<br />
Table 49—Cont<strong>in</strong>ued.<br />
[This table shows each stock <strong>and</strong> tribe hav<strong>in</strong>g 200 or more <strong>Indian</strong>s <strong>in</strong> <strong>1910</strong>. Ratio not shown where number of females Is less than 100.]
STOCKS AND TRIBES, BY SEX, AGE. AND MIXTURE OF BLOOD.<br />
In <strong>the</strong> census of <strong>1910</strong> <strong>the</strong> attempt was made to<br />
enumerate <strong>Indian</strong>s by tribes, <strong>and</strong> to secure data as<br />
well <strong>in</strong> regard to <strong>the</strong> tribal affiliations of both parents.<br />
The rapid changes tak<strong>in</strong>g place ia <strong>the</strong> conditions of<br />
<strong>Indian</strong> life are break<strong>in</strong>g down <strong>the</strong> tribal organization,<br />
<strong>and</strong> it was felt that this was perhaps <strong>the</strong> last oppor-<br />
timity to secure <strong>in</strong>formation which should be reasona-<br />
bly rehable upon <strong>the</strong>se po<strong>in</strong>ts. Unfortunately, <strong>the</strong><br />
data desired were not secured for those <strong>Indian</strong>s who<br />
were li\Tng widely scattered among <strong>the</strong> general popu-<br />
lation, <strong>and</strong> who to <strong>the</strong> number of 18,546 were enumerated<br />
only on <strong>the</strong> general <strong>population</strong> schedule, no<br />
special schedules be<strong>in</strong>g obta<strong>in</strong>ed for <strong>the</strong>m. The num-<br />
bers enumerated of <strong>the</strong> different tribes are, <strong>the</strong>refore,<br />
too small <strong>in</strong> vary<strong>in</strong>g degree, as some persons who<br />
should have been coim.ted as members of particular<br />
tribes were <strong>in</strong>stead enumerated simply as "<strong>Indian</strong>s"<br />
on <strong>the</strong> general <strong>population</strong> schedule. The extent of<br />
this understatement varies considerably <strong>in</strong> different<br />
states, but <strong>the</strong> actual error is beheved to be compara-<br />
tively small <strong>in</strong> most cases.<br />
The determ<strong>in</strong>ation of tribal affLliation <strong>in</strong> <strong>the</strong> case of<br />
<strong>Indian</strong>s of mixed-tribal blood presented someth<strong>in</strong>g of<br />
a dilenuna, <strong>in</strong>asmuch as affiliation might be counted<br />
ei<strong>the</strong>r by <strong>in</strong>heritance or by blood. In <strong>the</strong> former<br />
case <strong>the</strong> tribe to which an <strong>in</strong>dividual belonged would<br />
depend on <strong>the</strong> particular system of <strong>in</strong>heritance (that<br />
is, maternal or paternal) which was followed. If <strong>the</strong><br />
tribe among which he hved followed <strong>the</strong> former sys-<br />
tem, he wotdd be affiihated with <strong>the</strong> mo<strong>the</strong>r's tribe; if<br />
<strong>the</strong> latter, with that of <strong>the</strong> fa<strong>the</strong>r. As different tribes<br />
employ different methods this threatened to <strong>in</strong>volve<br />
serious confusion. To take an extreme example:<br />
If <strong>the</strong> fa<strong>the</strong>r <strong>and</strong> mo<strong>the</strong>r of an <strong>Indian</strong> were each re-<br />
ported as of mixed-tribal blood, to which of <strong>the</strong> four<br />
tribes represented <strong>in</strong> <strong>the</strong> <strong>in</strong>dividual should he be at-<br />
tributed ? On <strong>the</strong> o<strong>the</strong>r h<strong>and</strong>, as <strong>the</strong> primary basis of<br />
classification of <strong>Indian</strong>s was purity of blood, it would<br />
be logical to make tribal affiliation also dependent<br />
on actual descent, although this might, <strong>in</strong> some cases,<br />
lead to <strong>the</strong> coimt<strong>in</strong>g of an <strong>in</strong>dividual as a member<br />
of a tribe o<strong>the</strong>r than that to which he claimed to<br />
belong. After careful consideration <strong>and</strong> trial it was<br />
determ<strong>in</strong>ed that <strong>the</strong> latter method presented fewer<br />
difficulties <strong>and</strong> chances of error, <strong>and</strong> consequently an<br />
arbitrary rule was adopted of count<strong>in</strong>g <strong>Indian</strong>s of<br />
mixed-tribal blood as members always of <strong>the</strong> fa<strong>the</strong>r's<br />
tribe. The only exceptions to this rule were <strong>in</strong> cases<br />
where, ow<strong>in</strong>g to complexity of blood <strong>in</strong> both parents,<br />
<strong>the</strong> rule would lead to obviously <strong>in</strong>correct results. In<br />
such cases tribal affiliation was held to follow <strong>the</strong> dom<strong>in</strong>ant<br />
blood, if any; o<strong>the</strong>rwise, that of <strong>the</strong> fa<strong>the</strong>r's<br />
fa<strong>the</strong>r. In short, actual blood relationship was fol-<br />
INTRODUCTION.<br />
lowed as far as possible <strong>in</strong> determ<strong>in</strong><strong>in</strong>g <strong>the</strong> tribe to<br />
which an <strong>in</strong>dividual belonged. The differences between<br />
<strong>the</strong> numbers obta<strong>in</strong>ed for <strong>in</strong>dividual tribes by<br />
<strong>the</strong> use of this method as opposed to that of customary<br />
<strong>in</strong>heritance are not beheved to be considerable. Close<br />
observation of several cases showed httle change, <strong>and</strong><br />
<strong>the</strong> certa<strong>in</strong>ty of this mode of treatment as opposed<br />
to <strong>the</strong> uncerta<strong>in</strong>ty <strong>and</strong> confusion which were found to<br />
arise <strong>in</strong> follow<strong>in</strong>g <strong>the</strong> o<strong>the</strong>r method is beheved to<br />
justify it.<br />
Table 50 (p. 116) gives <strong>in</strong> summarized form, for each<br />
stock <strong>and</strong> tribe <strong>in</strong> <strong>the</strong> <strong>United</strong> <strong>States</strong> <strong>and</strong> <strong>Alaska</strong>, a<br />
statement of <strong>the</strong> number of <strong>Indian</strong>s reported <strong>in</strong> <strong>1910</strong>,<br />
classified accord<strong>in</strong>g to purity of blood <strong>and</strong> sex. A<br />
detailed distribution accord<strong>in</strong>g to purity of blood, tribal<br />
mixture, sex, <strong>and</strong> age is given for each stock <strong>and</strong><br />
tribe <strong>in</strong> <strong>the</strong> <strong>United</strong> <strong>States</strong> <strong>in</strong> Table 51 (p. 123), while a<br />
similar distribution accord<strong>in</strong>g to purity of blood, sex,<br />
aijd age is given for each stock <strong>and</strong> tribe <strong>in</strong> <strong>Alaska</strong> <strong>in</strong><br />
Table' 52 (p. 154) . In <strong>the</strong>se tables, as well as <strong>in</strong> <strong>the</strong> fol-<br />
low<strong>in</strong>g textual statement as to <strong>the</strong> habitat of each<br />
stock <strong>and</strong> tribe, <strong>the</strong> various tribes are, for convenience,<br />
grouped alphabetically by hnguistic stocks, <strong>the</strong> location<br />
of which may be seen by reference to <strong>the</strong> map<br />
opposite page 9.^ Any particular tribe may be readily<br />
found by reference to <strong>the</strong> alphabetical list of tribes as<br />
given <strong>in</strong> Table 9 (p. 17).<br />
A separate presentation is given for each stock <strong>in</strong> <strong>the</strong><br />
<strong>United</strong> <strong>States</strong>, both <strong>in</strong> <strong>the</strong> textual statement <strong>and</strong> <strong>in</strong><br />
Table 51 (p. 123), as follows:<br />
Algonquian.
72 INDIANS IN THE UNITED STATES.<br />
ALGONQUIAN STOCK.<br />
Stock as a whole.—This, <strong>the</strong> largest numerically of<br />
<strong>the</strong> stocks ia <strong>the</strong> <strong>United</strong> <strong>States</strong>, is also one of <strong>the</strong> largest<br />
bx po<strong>in</strong>t of area covered. With <strong>the</strong> exception of<br />
western New York, parts of western New Jersey <strong>and</strong><br />
Pennsylvania, <strong>and</strong> <strong>the</strong> nor<strong>the</strong>rn Alleghenies, <strong>the</strong> entire<br />
area of <strong>the</strong> <strong>United</strong> <strong>States</strong> east of <strong>the</strong> Mississippi <strong>and</strong><br />
north of a l<strong>in</strong>e drawn from <strong>the</strong> mouth of <strong>the</strong> Ohio to<br />
<strong>the</strong> entrance to Chesapeake Bay was at <strong>the</strong> beg<strong>in</strong>n<strong>in</strong>g<br />
of <strong>the</strong> seventeenth century occupied by <strong>Indian</strong>s of this<br />
stock. Far<strong>the</strong>r west, also, <strong>the</strong>re were several tribes<br />
<strong>the</strong> Arapaho, Cheyenne, Gros Ventres, <strong>and</strong> Piegan<br />
—<br />
who w<strong>and</strong>ered over a considerable area on <strong>the</strong> pla<strong>in</strong>s.<br />
The stock also extend* over a large area <strong>in</strong> Canada.<br />
From a large portion, of this area <strong>the</strong> <strong>Indian</strong>s have long<br />
practically disappeared, but ia parts of Michigan, Wiscons<strong>in</strong>,<br />
<strong>and</strong> M<strong>in</strong>nesota, <strong>and</strong> to some extent <strong>in</strong> Ma<strong>in</strong>e,<br />
<strong>the</strong>y still form a considerable element <strong>in</strong> <strong>the</strong> <strong>population</strong>.<br />
The <strong>Indian</strong>s of <strong>the</strong> Algonquian stock <strong>in</strong> <strong>the</strong> <strong>United</strong><br />
<strong>States</strong>, as enumerated <strong>in</strong> <strong>1910</strong>, numbered 40,975. To<br />
this figure should be added probably about 1,200 for<br />
<strong>Indian</strong>s of this stock reported without dist<strong>in</strong>ction of<br />
tribe among <strong>the</strong> general <strong>population</strong> <strong>in</strong> Michigan, M<strong>in</strong>-<br />
nesota, <strong>and</strong> Wiscons<strong>in</strong>, mak<strong>in</strong>g a probable total of<br />
about 42,000 ia all. The tribes of this stock, for which<br />
members were reported, are as follows:<br />
Abnaki.<br />
INDIANS IN THE UNITED STATES.
STOCKS AND TRIBES, BY SEX, AGE, AND BLOOD. 7a<br />
Cheyenne.—One of <strong>the</strong> most important of <strong>the</strong> Algonquian<br />
tribes of <strong>the</strong> pla<strong>in</strong>s. Their earliest known habi-<br />
tat was <strong>in</strong> western M<strong>in</strong>nesota. From <strong>the</strong>re <strong>the</strong>y<br />
moved west to <strong>the</strong> Black Hills <strong>in</strong> South Dakota <strong>in</strong> <strong>the</strong><br />
eighteenth century or earher, <strong>and</strong> <strong>the</strong>nce gradually<br />
fartiher west <strong>and</strong> south. About 1835 <strong>the</strong> tribe divided<br />
<strong>in</strong>to two portions, <strong>the</strong> one rema<strong>in</strong><strong>in</strong>g <strong>in</strong> Wyom<strong>in</strong>g <strong>and</strong><br />
vic<strong>in</strong>ity, <strong>the</strong> o<strong>the</strong>r mov<strong>in</strong>g south to sou<strong>the</strong>rn Colorado<br />
<strong>and</strong> <strong>the</strong> adjacent portions of Kansas <strong>and</strong> Oklahoma.<br />
S<strong>in</strong>ce <strong>the</strong> early eighties <strong>the</strong> Nor<strong>the</strong>rn Cheyenne have<br />
been on <strong>the</strong> Tongue River Reservation <strong>in</strong> Montana.<br />
The Sou<strong>the</strong>rn Cheyenne have for 40 years or more been<br />
located on <strong>the</strong> Arapaho <strong>and</strong> Cheyenne Reservation <strong>in</strong><br />
Oklahoma.<br />
The number enumerated <strong>in</strong> <strong>1910</strong> was 3,055, of which<br />
1,522 were <strong>in</strong> Oklahoma <strong>and</strong> 1,346 <strong>in</strong> Montana. The<br />
reports of <strong>the</strong> Commissioner of <strong>Indian</strong> Affairs furnish<br />
comparative figures back to 1880. In 1875 <strong>the</strong> whole<br />
tribe was estimated at over 4,000.<br />
TEAK.
74 INDIANS IN THE UNITED STATES.<br />
The number enumerated <strong>in</strong> <strong>1910</strong> was 510, of which<br />
503 were <strong>in</strong> Montana. Comparative figiu-es which are<br />
available for this tribe <strong>in</strong> Montana show that <strong>the</strong>re has<br />
been a great decrease among <strong>the</strong> Gros Ventres <strong>in</strong> <strong>the</strong><br />
last 25 years. Estimated at about 1,500 <strong>in</strong> 1866, <strong>the</strong>y<br />
lost by smallpox <strong>in</strong> 1870, <strong>and</strong> by 1885 has dw<strong>in</strong>dled to<br />
852, s<strong>in</strong>ce which time <strong>the</strong> figures, taken from <strong>the</strong> re-<br />
ports of <strong>the</strong> Commissioner of <strong>Indian</strong> Affairs, are as<br />
follows<br />
:<br />
YEAS.
STOCKS AND TRIBES, BY SEX, AGE, AND BLOOD. 75<br />
cous<strong>in</strong>, whi<strong>the</strong>r <strong>the</strong>y seem to have gone with <strong>the</strong><br />
Bro<strong>the</strong>rton. The number enumerated <strong>in</strong> <strong>1910</strong> was 29,<br />
of which 21 were <strong>in</strong> Wiscons<strong>in</strong>.<br />
Munsee.— ^The name of a portion of <strong>the</strong> Delaware<br />
tribe occupy<strong>in</strong>g <strong>in</strong> <strong>the</strong> seventeenth century a consid-<br />
erable area <strong>in</strong> sou<strong>the</strong>rn New York <strong>and</strong> adjacent parts<br />
of Pennsylvania <strong>and</strong> New Jersey. By <strong>the</strong> end of <strong>the</strong><br />
eighteenth century <strong>the</strong>y had been ahnost completely<br />
dispersed or absorbed by o<strong>the</strong>r tribes, <strong>and</strong> at present<br />
<strong>the</strong> survivors are scattered among several tribes <strong>in</strong><br />
Oklahoma <strong>and</strong> <strong>in</strong> Kansas. The total reported <strong>in</strong> <strong>1910</strong><br />
was 71, of which Kansas <strong>and</strong> Oklahoma had 41 <strong>and</strong><br />
21, respectively.<br />
Narraganset.—Formerly one of <strong>the</strong> most important<br />
tribes of sou<strong>the</strong>rn New Engl<strong>and</strong>, occupy<strong>in</strong>g western<br />
Ehode Isl<strong>and</strong> <strong>and</strong> adjacent parts of Connecticut. The<br />
few survivors are now largely mixed with white <strong>and</strong><br />
Negro blood. The number enumerated <strong>in</strong> <strong>1910</strong> was<br />
16, of which one-half were <strong>in</strong> Wiscons<strong>in</strong>. It is probable<br />
that <strong>the</strong>re were o<strong>the</strong>rs of<br />
among ^e general <strong>population</strong>.<br />
this tribe enumerated<br />
Niantic.—^A small tribe formerly occupy<strong>in</strong>g <strong>the</strong> coast<br />
of Connecticut near Niantic Bay. One survivor of<br />
this tribe was enumerated <strong>in</strong> Connecticut <strong>in</strong> <strong>1910</strong>, a<br />
woman reported to be of full-tribal blood.<br />
Ottawa.—Orig<strong>in</strong>ally a Canadian tribe, <strong>the</strong> habitat of<br />
<strong>the</strong> Ottawa when first met by Europeans, <strong>in</strong> <strong>the</strong> early<br />
part of <strong>the</strong> seventeenth, century, was <strong>in</strong> <strong>the</strong> present<br />
Prov<strong>in</strong>ce of Ontario, on Manitoul<strong>in</strong> Isl<strong>and</strong>, <strong>the</strong> nor<strong>the</strong>rn<br />
shore of Georgian Bay, <strong>and</strong> parts of <strong>the</strong> sou<strong>the</strong>rn<br />
shore adjacent to <strong>the</strong> Hurons. After <strong>the</strong> destruction<br />
of <strong>the</strong> Hurons <strong>in</strong> 1648-49, <strong>the</strong> Ottawa fled at first to <strong>the</strong><br />
western shore of Lake Michigan <strong>and</strong> later far<strong>the</strong>r west,<br />
even to <strong>the</strong> Mississippi Eiver. By <strong>the</strong> end of <strong>the</strong> cen-<br />
tury <strong>the</strong> greater part, however, had returned <strong>and</strong> settled<br />
ma<strong>in</strong>ly <strong>in</strong> <strong>the</strong> Lower Pen<strong>in</strong>sula of Michigan where<br />
<strong>the</strong>y became much mixed with <strong>the</strong> Chippewa. A<br />
small number of Ottawa moved west beyond <strong>the</strong> Mississippi<br />
<strong>in</strong> <strong>the</strong> early part of <strong>the</strong> n<strong>in</strong>eteenth century <strong>and</strong><br />
s<strong>in</strong>ce 1870 have been liv<strong>in</strong>g with <strong>the</strong> Quapaw on <strong>the</strong>ir<br />
reservation <strong>in</strong> Oklahoma.<br />
. The total number enumerated <strong>in</strong> <strong>1910</strong> was 2,717, of<br />
which 2,454 were <strong>in</strong> Michigan <strong>and</strong> 170 <strong>in</strong> Oklahoma.<br />
Figures for <strong>the</strong> total Ottawa <strong>population</strong> <strong>in</strong> previous<br />
years are impossible to secure, as only <strong>the</strong> siliall por-<br />
tion resid<strong>in</strong>g <strong>in</strong> Oklahoma has been shown separately<br />
<strong>in</strong> <strong>the</strong> reports of <strong>the</strong> Commissioner of <strong>Indian</strong> Affairs.<br />
Pamunkey.—Once one of <strong>the</strong> most important tribes<br />
of Virg<strong>in</strong>ia, belong<strong>in</strong>g to <strong>the</strong> Powhatan Confederacy,<br />
<strong>and</strong> occupy<strong>in</strong>g <strong>the</strong> region about <strong>the</strong> Pamunkey <strong>and</strong><br />
Mattapony Rivers <strong>in</strong> that state. S<strong>in</strong>ce <strong>the</strong> end of <strong>the</strong><br />
eighteenth century <strong>the</strong> remnant, largely of mixed<br />
blood, have occupied a small reservation <strong>in</strong> K<strong>in</strong>g William<br />
County. The nimiber enumerated <strong>in</strong> <strong>1910</strong> was<br />
83, all <strong>in</strong> Virg<strong>in</strong>ia.<br />
Passamaqiioddy.—^A tribe very closely allied to <strong>the</strong><br />
Malecite <strong>and</strong> occupy<strong>in</strong>g s<strong>in</strong>ce <strong>the</strong> seventeenth century<br />
<strong>the</strong> region <strong>in</strong> <strong>the</strong> vic<strong>in</strong>ity of <strong>the</strong> eastern boundary of<br />
Ma<strong>in</strong>e. The number enumerated <strong>in</strong> <strong>1910</strong> was 386, of<br />
which 381 were <strong>in</strong> Ma<strong>in</strong>e.<br />
Penolscot.—A tribe once quite numerous <strong>and</strong> formerly<br />
occupy<strong>in</strong>g <strong>the</strong> region along <strong>the</strong> Penobscot River,<br />
Me. They are now for <strong>the</strong> most part located <strong>in</strong> <strong>the</strong><br />
vic<strong>in</strong>ity of Old Town, Me., 253 out of a total of 266 be<strong>in</strong>g<br />
reported <strong>in</strong> that state <strong>in</strong> <strong>1910</strong>.-<br />
Peoria.— ^A tribe belong<strong>in</strong>g to <strong>the</strong> loose group known<br />
as <strong>the</strong> Ill<strong>in</strong>ois Confederacy <strong>and</strong> liv<strong>in</strong>g, when first known<br />
to Europeans <strong>in</strong> <strong>the</strong> seventeenth century, on <strong>the</strong> west<br />
side of <strong>the</strong> Mississippi River <strong>in</strong> Iowa. Later <strong>the</strong>y<br />
moved to Ill<strong>in</strong>ois <strong>and</strong> <strong>in</strong> 1832 removed to Kansas,<br />
where <strong>the</strong>y were jo<strong>in</strong>ed by various o<strong>the</strong>r small tribes<br />
<strong>and</strong> ultimately settled <strong>in</strong> Oklahoma on <strong>the</strong> Peoria<br />
Reservation. The Peoria to-day are much mixed with<br />
Piankashaw, Wea, etc. The number enumerated <strong>in</strong><br />
<strong>1910</strong> was 128, of which 114 were reported <strong>in</strong> Oklahoma.<br />
Peguot.—^A tribe once practically identical with <strong>the</strong><br />
Mohegan <strong>and</strong> occupy<strong>in</strong>g <strong>in</strong> <strong>the</strong> seventeenth century<br />
<strong>the</strong> extreme eastern edge of Connecticut. The remnant<br />
is still Uvirg <strong>in</strong> this region, 66 be<strong>in</strong>g enumerated<br />
<strong>in</strong> <strong>1910</strong>, 49 <strong>in</strong> Connecticut <strong>and</strong> 17 <strong>in</strong> Massachusetts.<br />
Piankashaw.^A subdivision orig<strong>in</strong>ally of <strong>the</strong> Miami,<br />
formerly occup3dng a small area <strong>in</strong> nor<strong>the</strong>rn <strong>Indian</strong>a<br />
<strong>and</strong> lU<strong>in</strong>ois. Early <strong>in</strong> <strong>the</strong> n<strong>in</strong>eteenth century <strong>the</strong><br />
remnant had moved west across <strong>the</strong> Mississippi, <strong>and</strong><br />
later, unit<strong>in</strong>g with <strong>the</strong> Peoria, Kaskaskia, <strong>and</strong> Wea,<br />
removed to <strong>the</strong> Peoria Reservation, Okla. There were<br />
but 2 <strong>Indian</strong>s reported <strong>in</strong> <strong>1910</strong> as Piankashaw, from<br />
Oklahoma, a female of full-tribal blood <strong>and</strong> a halfbreed<br />
male.<br />
Piegan.— ^The largest of <strong>the</strong> three tribes of <strong>the</strong><br />
Blackfoot Confederacy. Their early habitat extended<br />
over a large area <strong>in</strong> Montana, Alberta, <strong>and</strong><br />
Saskatchewan, east of <strong>the</strong> Rocky Mounta<strong>in</strong>s. For 40<br />
years or more <strong>the</strong> portion of <strong>the</strong> tribe <strong>in</strong> <strong>the</strong> <strong>United</strong><br />
<strong>States</strong> has been located on <strong>the</strong> Blackfeet Reservation<br />
<strong>in</strong> Montana. They are sometimes referred to simply<br />
as Blackfeet.<br />
The number enumerated <strong>in</strong> <strong>1910</strong> was 2,268, of which<br />
2,221 were <strong>in</strong> Montana. Comparative figures for<br />
earlier years are almost useless as <strong>the</strong>y are, with very<br />
few exceptions, only estimates. Before 1885 <strong>the</strong> number<br />
returned varied very widely from year to year,<br />
<strong>the</strong> most conservative estimate be<strong>in</strong>g about 2,500 <strong>in</strong><br />
1861. In 1864 <strong>and</strong> <strong>in</strong> 1869 <strong>the</strong>y suffered by an epidemic<br />
of measles <strong>and</strong> smallpox, <strong>and</strong> <strong>in</strong> 1883 nearly 600<br />
died of starvation. S<strong>in</strong>ce 1885 <strong>the</strong>re has apparently<br />
been httle change <strong>in</strong> numbers, as shown by <strong>the</strong> follow<strong>in</strong>g<br />
figures from <strong>the</strong> reports of <strong>the</strong> Commissioner of<br />
<strong>Indian</strong> Affairs for this tribe <strong>in</strong> Montana:<br />
YEAE.
76 INDIANS IN THE UNITED STATES.<br />
probably still survives. A s<strong>in</strong>gle <strong>Indian</strong> was enumerated<br />
<strong>in</strong> <strong>1910</strong>, <strong>in</strong> New York, as belong<strong>in</strong>g to this<br />
tribe, a woman of half Negro blood. It is probable<br />
that some additional members of this tribe were scat-<br />
tered among <strong>the</strong> general <strong>population</strong>,<br />
Potawatomi.—The earliest assignable location for<br />
this tribe is <strong>in</strong> <strong>the</strong> Lower Pen<strong>in</strong>sula of Michigan. From<br />
here, early <strong>in</strong> <strong>the</strong> seventeenth century, <strong>the</strong>y moved to<br />
<strong>the</strong> vic<strong>in</strong>ity of Sault Ste. Marie <strong>and</strong> <strong>the</strong>nce, at a later<br />
date, southward to <strong>the</strong> lower end of Lake Michigan<br />
<strong>and</strong> adjacent portions of Wiscons<strong>in</strong>, Ill<strong>in</strong>ois, <strong>Indian</strong>a,<br />
<strong>and</strong> Michigan. By <strong>the</strong> middle' of <strong>the</strong> n<strong>in</strong>eteenth century<br />
<strong>the</strong> larger portion had moved west across <strong>the</strong><br />
Mississippi where, after several changes of location,<br />
<strong>the</strong>y were f<strong>in</strong>ally located on <strong>the</strong> Great Nemaha Eeservation<br />
<strong>in</strong> Kansas, <strong>and</strong> <strong>the</strong> Sauk <strong>and</strong> Fox Reservation<br />
<strong>in</strong> Oklahoma. A portion, however, rema<strong>in</strong>s <strong>in</strong> Wiscons<strong>in</strong><br />
<strong>and</strong> Michigan. The total number enumerated<br />
<strong>in</strong> <strong>1910</strong> was 2,440, of which 866 were <strong>in</strong> Oklahoma, 819<br />
<strong>in</strong> Kansas, 461 <strong>in</strong> Michigan, <strong>and</strong> 245 <strong>in</strong> Wiscons<strong>in</strong>.<br />
PowKatan.—A group or confederacy of several<br />
tribes liv<strong>in</strong>g <strong>in</strong> <strong>the</strong> seventeenth century along <strong>the</strong> Vir-<br />
g<strong>in</strong>ia coast, <strong>and</strong> <strong>in</strong>clud<strong>in</strong>g among o<strong>the</strong>rs <strong>the</strong> Chickahom<strong>in</strong>y,<br />
Mattapony, <strong>and</strong> Pamunkey. The remnants<br />
are now much mixed <strong>and</strong> widely scattered. The number<br />
reported <strong>in</strong> <strong>1910</strong> (dist<strong>in</strong>ct from <strong>the</strong> Chickahom<strong>in</strong>y,<br />
Mattapony, <strong>and</strong> Pamunkey) was 131, all <strong>in</strong> Virg<strong>in</strong>ia.<br />
Sauk <strong>and</strong> Fox.—Two tribes which have been so<br />
closely associated for over a century that <strong>the</strong>y have<br />
been enumerated as a unit. The earUest assignable<br />
habitat for both <strong>the</strong> Sauk <strong>and</strong> Fox was <strong>in</strong> <strong>the</strong> Lower<br />
Pen<strong>in</strong>sula of Michigan where <strong>the</strong>y were liv<strong>in</strong>g at <strong>the</strong><br />
very beg<strong>in</strong>n<strong>in</strong>g of <strong>the</strong> seventeenth century. Mov<strong>in</strong>g<br />
from <strong>the</strong>re by <strong>the</strong> end of <strong>the</strong> century to Wiscons<strong>in</strong>,<br />
<strong>the</strong>y rema<strong>in</strong>ed <strong>in</strong> <strong>the</strong> region of Green Bay for some<br />
time <strong>and</strong> toward <strong>the</strong> end of <strong>the</strong> eighteenth century<br />
moved far<strong>the</strong>r west beyond <strong>the</strong> Mississippi. They are<br />
now divided <strong>in</strong>to three groups, located respectively at<br />
Tama, Iowa; <strong>the</strong> Great Nemaha Reservation, Kans.;<br />
<strong>and</strong> <strong>the</strong> Sauk <strong>and</strong> Fox Reservation, Okla.<br />
The total number enumerated <strong>in</strong> <strong>1910</strong> was 724, of<br />
which 347 were <strong>in</strong> Oklahoma, 257 <strong>in</strong> Iowa, <strong>and</strong> 69 <strong>in</strong><br />
Kansas. Figures for earlier years are <strong>in</strong> <strong>the</strong> case of <strong>the</strong><br />
Sauk <strong>and</strong> Fox unusually complete <strong>in</strong> <strong>the</strong> reports of <strong>the</strong><br />
Commissioner of <strong>Indian</strong> Affairs for <strong>the</strong> number repre-<br />
sented <strong>in</strong> Iowa, Oklahoma, Kansas, <strong>and</strong> Nebraska, as<br />
follows<br />
:<br />
YEAR.
STOCKS AND TRIBES, BY SEX, AGE, AND BLOOD. 77<br />
ATHAPASKAN STOCK.<br />
Stock as a whole.—Of all <strong>the</strong> stocks <strong>in</strong> North. America<br />
<strong>the</strong> Athapaskan covers <strong>the</strong> largest area, <strong>and</strong>, with <strong>the</strong><br />
exception of <strong>the</strong> Eskimauan, has <strong>the</strong> greatest rai^e of<br />
distribution. The larger portion of <strong>the</strong> area, formerly<br />
<strong>and</strong> at present, occupied by this stock lies <strong>in</strong> <strong>Alaska</strong><br />
<strong>and</strong> <strong>the</strong> Canadian northwest. In cont<strong>in</strong>ental <strong>United</strong><br />
<strong>States</strong> its ma<strong>in</strong> territory lay <strong>in</strong> Arizona, New Mexico,<br />
<strong>and</strong> northwestern Texas, with an isolated area of very<br />
irregular shape on <strong>the</strong> Pacific coast <strong>in</strong> nor<strong>the</strong>rn Cali-<br />
fornia <strong>and</strong> southwestern Oregon. One small tribe<br />
belong<strong>in</strong>g to this stock, <strong>the</strong> Tlatskanai, was <strong>in</strong> sou<strong>the</strong>rn<br />
WasMiigton, <strong>and</strong> one, <strong>the</strong> so-called Kiowa Apache, <strong>in</strong><br />
<strong>the</strong> sou<strong>the</strong>rn pla<strong>in</strong>s.<br />
The <strong>Indian</strong>s of <strong>the</strong> Athapaskan stock <strong>in</strong> <strong>the</strong> <strong>United</strong><br />
<strong>States</strong>, as enumerated <strong>in</strong> <strong>1910</strong>, numbered 30,406. To<br />
this figure should be added perhaps 500 for <strong>Indian</strong>s of<br />
this stock reported without dist<strong>in</strong>ction of tribe among<br />
<strong>the</strong> general <strong>population</strong> <strong>in</strong> New Mexico <strong>and</strong> Arizona,<br />
mak<strong>in</strong>g a probable total of nearly 31,000 <strong>in</strong> all. The<br />
tribes of this stock, for which members were reported,<br />
are as follows:<br />
TEAK.
78 INDIANS IN THE UNITED STATES.<br />
The total reported <strong>in</strong> <strong>1910</strong> was 694, all <strong>in</strong> New<br />
Mexico. Figures for this tribe are given with considerable<br />
regularity <strong>in</strong> <strong>the</strong> reports of <strong>the</strong> Commissioner<br />
of <strong>Indian</strong> Affairs as far back as 1869.<br />
TEAK.
STOCKS AND TRIBES, BY SEX, AGE, AND BLOOD. 79<br />
enumeration of <strong>the</strong> census is too small seems probable.<br />
An exact enumeration, however, is, as already stated,<br />
practically impossible.<br />
Redwood (syn. Whilkut).—^A small group or tribe<br />
closely related to <strong>the</strong> Hupa. Their habitat was on<br />
Upper Redwood Creek, directly west of <strong>the</strong> Hupa <strong>in</strong><br />
Humboldt County, Cal. Located for several years<br />
previous to 1870 at Hupa Reservation, most have<br />
s<strong>in</strong>ce removed to <strong>the</strong>ir orig<strong>in</strong>al homes. The local<br />
name for <strong>the</strong>se <strong>Indian</strong>s is Redwood, a term also<br />
applied to <strong>the</strong>Huchnom, a branch of <strong>the</strong> Yukian stock<br />
<strong>in</strong> Mendoc<strong>in</strong>o County. The total number reported <strong>in</strong><br />
<strong>1910</strong> was 76, of which 74 were <strong>in</strong> California <strong>and</strong> 2 <strong>in</strong><br />
Wash<strong>in</strong>gton.<br />
Rogue River (syn. Tututni).—^A group of small<br />
tribes who <strong>in</strong> <strong>the</strong> early n<strong>in</strong>eteenth century were liv<strong>in</strong>g<br />
on <strong>the</strong> lower Rogue River <strong>and</strong> adjacent area <strong>in</strong> Curry<br />
County, Oreg. In 1856 <strong>the</strong>y were removed to Siletz<br />
Reservation <strong>and</strong> some time later were transferred to<br />
<strong>the</strong> Gr<strong>and</strong>e Ronde Reservation. The remnants are at<br />
present divided between <strong>the</strong>se two reservations. There<br />
is much confusion <strong>in</strong> <strong>the</strong> use of <strong>the</strong> term Tututni aiitl<br />
Rogue River, <strong>and</strong> among those returned as such, <strong>and</strong><br />
here tabulated, <strong>the</strong>re are probably some Chetco,<br />
Chastacosta <strong>and</strong> o<strong>the</strong>r Athapaskan tribes of this<br />
region.<br />
The number enumerated <strong>in</strong> <strong>1910</strong> was 383, of which<br />
368 were <strong>in</strong> Oregon. Strictly comparable figures for<br />
this tribe can not be obta<strong>in</strong>ed, but an approximation<br />
can be made as follows: In 1854, at <strong>the</strong> time of <strong>the</strong>ir<br />
transportation as prisoners of war to Siletz, <strong>the</strong> Rogue<br />
River were given as number<strong>in</strong>g 1,311. In 1867 <strong>the</strong>y<br />
seem still to have numbered over 1,300, but 10 years<br />
later, <strong>in</strong> 1877, were reduced to less than 700 <strong>and</strong> <strong>in</strong><br />
1881 to less than 500. S<strong>in</strong>ce that date no separate<br />
report has been made.<br />
Saiaz.—^A term of somewhat uncerta<strong>in</strong> application,<br />
applied to a portion of <strong>the</strong> Kuneste section of <strong>the</strong><br />
Pacific coast division of this stock. Their habitat<br />
s<strong>in</strong>ce earliest traditional times was <strong>in</strong> Humboldt <strong>and</strong><br />
Tr<strong>in</strong>ity Counties, Cal. They are practically one with<br />
<strong>the</strong>. Wailaki. Between 1862 <strong>and</strong> 1878 <strong>the</strong>y were<br />
ga<strong>the</strong>red first at <strong>the</strong> Smith River Reservation <strong>and</strong> also<br />
at <strong>the</strong> Hupa Reservation, but s<strong>in</strong>ce <strong>the</strong> latter date <strong>the</strong><br />
few survivors have been scattered over <strong>the</strong>ir orig<strong>in</strong>al<br />
territory. The number enumerated <strong>in</strong> <strong>1910</strong> was 6, all<br />
<strong>in</strong> California.<br />
TenanTcutch<strong>in</strong>.—One white half-breed male of this<br />
<strong>Alaska</strong>n tribe (see p. 112) was reported from Oregon<br />
<strong>in</strong> <strong>1910</strong>.<br />
TlatskanaL—K small tribe formerly liv<strong>in</strong>g on <strong>the</strong><br />
Chehalis River, Wash., <strong>and</strong> later <strong>in</strong> Columbia County,<br />
Oreg. They were supposed to be ext<strong>in</strong>ct several years<br />
ago. Three were reported from Wash<strong>in</strong>gton <strong>in</strong> <strong>1910</strong>.<br />
ToTxma (syn. Crescent City, Smith River <strong>Indian</strong>s.)—<br />
A small tribe or group belong<strong>in</strong>g to <strong>the</strong> Kuneste section<br />
of <strong>the</strong> Pacific coast division of this stock. Their<br />
habitat s<strong>in</strong>ce earhest traditional times has been <strong>in</strong> <strong>the</strong><br />
extreme northwestern corner of California, compris<strong>in</strong>g<br />
practically all of Del Norte County. Between 1862<br />
<strong>and</strong> 1868 <strong>the</strong>y were ga<strong>the</strong>red on a small reservation on<br />
Smith River which was later ab<strong>and</strong>oned, <strong>and</strong> s<strong>in</strong>ce <strong>the</strong><br />
latter date <strong>the</strong> Tolowa have not been located on a<br />
reservation. The number enumerated <strong>in</strong> <strong>1910</strong> was<br />
121, of which 118 were <strong>in</strong> California <strong>and</strong> 3 <strong>in</strong> Oregon.<br />
Vm'pqua.—^A tribal name of somewhat vague appli-<br />
cation, generally applied, however, to <strong>the</strong> <strong>Indian</strong>s of<br />
<strong>the</strong> upper Umpqua River, <strong>in</strong> Douglas County, Oreg.<br />
They were removed to <strong>the</strong> Alsea Reservation <strong>in</strong> <strong>the</strong><br />
middle of <strong>the</strong> n<strong>in</strong>eteenth century, <strong>and</strong> later divided<br />
between Siletz <strong>and</strong> Gr<strong>and</strong>e Ronde Reservation, Oreg.,<br />
*<br />
where <strong>the</strong>y still rema<strong>in</strong>.<br />
The number enumerated <strong>in</strong> <strong>1910</strong> was 109, of which<br />
90 were <strong>in</strong> Oregon <strong>and</strong> 17 <strong>in</strong> Wash<strong>in</strong>gton. Compara-<br />
tive figures from <strong>the</strong> reports of <strong>the</strong> Commissioner of<br />
<strong>Indian</strong> AflFairs are available s<strong>in</strong>ce 1860, as follows:<br />
TEAR.
80 INDIANS IN THE UNITED STATES.<br />
Ankara.—The nor<strong>the</strong>m<strong>in</strong>ost tribe of this stock.<br />
Although now isolated, <strong>the</strong>y were formerly part of<br />
<strong>the</strong> Pawnee. Their early traditional home was <strong>in</strong><br />
Kansas, or far<strong>the</strong>r south <strong>and</strong> southwest. From here<br />
<strong>the</strong>y moved up <strong>the</strong> Missouri River, <strong>and</strong> were found by<br />
Europeans <strong>in</strong> <strong>the</strong> early part of <strong>the</strong> eighteenth century<br />
<strong>in</strong> South Dakota. By <strong>the</strong> middle of <strong>the</strong> n<strong>in</strong>eteenth<br />
century <strong>the</strong>y had moved far<strong>the</strong>r up <strong>the</strong> river <strong>in</strong>to<br />
North Dakota, <strong>and</strong> for about 50 years <strong>the</strong>y have been<br />
at Fort Berthold Reservation, toge<strong>the</strong>r with <strong>the</strong> Hidatsa<br />
<strong>and</strong> M<strong>and</strong>an.<br />
The number enumerated <strong>in</strong> <strong>1910</strong> was 444, of which<br />
425 were <strong>in</strong> North Dakota. Comparative figures are<br />
of value as far back as 1875. Previous to that date<br />
<strong>the</strong> Ankara were estimated at from 1,000 to 1,600.<br />
The figures given <strong>in</strong> <strong>the</strong> reports of <strong>the</strong> Commissioner<br />
of <strong>Indian</strong> Affairs for this tribe <strong>in</strong> North Dakota s<strong>in</strong>ce<br />
1875 show a great decrease, <strong>and</strong> are as foUows<br />
TEAR.<br />
:
STOCKS AND TRIBES, BY SEX, AGE, AND BLOOD.<br />
CHIMAKTJAN STOCK.<br />
Stock as a whole.—One of <strong>the</strong> small stocks of <strong>the</strong><br />
Pacific coast, which occupied, at <strong>the</strong> time when first<br />
known to Europeans, two small areas <strong>in</strong> western Wash-<br />
<strong>in</strong>gton, one on <strong>the</strong> coast south of Cape Flattery <strong>and</strong> <strong>the</strong><br />
o<strong>the</strong>r on <strong>the</strong> northwestern shore of Puget Sound.<br />
The <strong>Indian</strong>s of <strong>the</strong> Chimakuan stock, as enumerated<br />
<strong>in</strong> <strong>1910</strong>, numbered 306. The surviv<strong>in</strong>g tribes of this<br />
stock, for which members were reported are as follows:<br />
Chimakum. Hot. QuUeute.<br />
Chimakum.—A small tribe occupy<strong>in</strong>g, when first<br />
known to Europeans, <strong>the</strong> pen<strong>in</strong>sula between Hoods<br />
Canal <strong>and</strong> Port Townsend, Wash. The tribe has been<br />
supposed to be ext<strong>in</strong>ct. Three males, however, were<br />
enumerated <strong>in</strong> Wash<strong>in</strong>gton <strong>in</strong> <strong>1910</strong>, one of full-tribal<br />
blood, one of mixed-tribal blood, <strong>and</strong> one white <strong>and</strong><br />
<strong>Indian</strong> half-breed.<br />
HoTi.—^A subdivision of <strong>the</strong> Quileute. Their habitat<br />
s<strong>in</strong>ce <strong>the</strong> beg<strong>in</strong>n<strong>in</strong>g of <strong>the</strong> n<strong>in</strong>eteenth century has been<br />
on <strong>the</strong> river of <strong>the</strong> same name, <strong>in</strong> <strong>the</strong> northwestern<br />
part of Jefferson County, Wash.<br />
The number enumerated <strong>in</strong> <strong>1910</strong> was 44, all ia<br />
Wash<strong>in</strong>gton. The follow<strong>in</strong>g figures for this tribe are<br />
given <strong>in</strong> <strong>the</strong> reports of <strong>the</strong> Commissioner of <strong>Indian</strong><br />
Affairs:<br />
TEAE.
82 INDIANS IN THE UNITED STATES.<br />
River near The Dalles, Wasco County, Oreg. For 40<br />
or 50 years <strong>the</strong>y have been located on <strong>the</strong> Warm<br />
Spr<strong>in</strong>gs Reservation <strong>in</strong> that state.<br />
The number enumerated <strong>in</strong> <strong>1910</strong> was 242, of which<br />
184 were <strong>in</strong> Oregon <strong>and</strong> 54 <strong>in</strong>'Wash<strong>in</strong>gton. Comparative<br />
figures for this tribe <strong>in</strong> Oregon are available from<br />
<strong>the</strong> reports of <strong>the</strong> Commissioner of <strong>Indian</strong> Afiairs<br />
from 1870 to 1890, as follows:<br />
YEAR.
STOCKS AND TRIBES, BY SEX, AGE, AND BLOOD. 83<br />
tion to <strong>the</strong>se areas <strong>in</strong> <strong>the</strong> <strong>United</strong> <strong>States</strong>, tribes of this<br />
stock occupied most of <strong>the</strong> pen<strong>in</strong>sula region of Ontario<br />
<strong>and</strong> <strong>the</strong> shores of <strong>the</strong> St. Lawrence as far down as<br />
Queibec or below.<br />
The <strong>Indian</strong>s of <strong>the</strong> Iroquoian stock <strong>in</strong> <strong>the</strong> <strong>United</strong><br />
<strong>States</strong>, as enumerated <strong>in</strong> <strong>1910</strong>, numbered 39,679. To<br />
this figure should be added probably about 1,500 to<br />
2,000 for <strong>Indian</strong>s of this stock reported without dist<strong>in</strong>ction<br />
of tribe, among <strong>the</strong> general <strong>population</strong> <strong>in</strong> New<br />
York, North CaroHna, Tennessee, South Carol<strong>in</strong>a, <strong>and</strong><br />
Oklahoma, mak<strong>in</strong>g a probable total of over 41,000 <strong>in</strong><br />
all. The tribes of this stock, for which members<br />
were reported, are as follows<br />
Cayuga. Oneida. Seneca.<br />
Cherokee. Onondaga. Tuecarora.<br />
Mohawk. St. Regis. Wy<strong>and</strong>ot.<br />
Cayuga.—One of <strong>the</strong> five tribes of <strong>the</strong> Well-known<br />
Iroquois Confederacy. Their habitat, when first<br />
known to Europeans <strong>in</strong> <strong>the</strong> seventeenth century, was<br />
<strong>in</strong> <strong>the</strong> vic<strong>in</strong>ity of Cayuga Lake, N. Y. At <strong>the</strong> close of<br />
<strong>the</strong> eighteenth century <strong>the</strong> majority emigrated to<br />
Canada, where <strong>the</strong>y are now liv<strong>in</strong>g on a reservation <strong>in</strong><br />
Ontario. Of <strong>the</strong> rema<strong>in</strong>der, part moved to Oklahoma<br />
<strong>and</strong> part to Wiscons<strong>in</strong>, where <strong>the</strong>y are liv<strong>in</strong>g with <strong>the</strong><br />
Oneida, but were not returned as Cayuga <strong>in</strong> <strong>the</strong> present<br />
census. Those rema<strong>in</strong><strong>in</strong>g <strong>in</strong> New York are located<br />
ma<strong>in</strong>ly on <strong>the</strong> Cattaraugus <strong>and</strong> Tonaw<strong>and</strong>a Reserva-<br />
tions.<br />
The number enumerated <strong>in</strong> <strong>1910</strong> was 81, of which 53<br />
were <strong>in</strong> New York <strong>and</strong> 17 <strong>in</strong> Oklahoma. The Commis-<br />
sioner of <strong>Indian</strong> Affairs reported 182 for this tribe <strong>in</strong><br />
New York <strong>in</strong> <strong>1910</strong>, <strong>and</strong> a practically stationary popular-<br />
tion for <strong>the</strong> past 35 years. The great difference between<br />
this figure <strong>and</strong> <strong>the</strong> census report is due probably<br />
to <strong>the</strong> enumeration by <strong>the</strong> census of many <strong>Indian</strong>s<br />
without dist<strong>in</strong>ction of tribe among <strong>the</strong> general popula-<br />
tion. The figures for this tribe <strong>in</strong> New York s<strong>in</strong>ce<br />
1875, as given <strong>in</strong> <strong>the</strong> <strong>Indian</strong> reports, are as follows:<br />
YEAB.<br />
:
84 INDIANS IN THE UNITED STATES.<br />
New York are given <strong>in</strong> <strong>the</strong> reports of <strong>the</strong> Commis-<br />
sioner of <strong>Indian</strong> Affairs s<strong>in</strong>ce 1875, as follows:<br />
TEAK.
STOCKS AND TRIBES, BY SEX, AGE, AND BLOOD. 85<br />
Tuscarora had changed but little <strong>in</strong> numbers <strong>in</strong> <strong>the</strong><br />
last 40 years.<br />
Wy<strong>and</strong>ot (syn. Huron).—^A tribe better known perhaps<br />
as <strong>the</strong> Huron. When first known to Europeans<br />
early <strong>in</strong> <strong>the</strong> seventeenth century, <strong>the</strong>y occupied a small<br />
area south <strong>and</strong> east of Georgian Bay <strong>in</strong> Ontario, Can-<br />
ada. Their history dur<strong>in</strong>g <strong>the</strong> next 200 years is full<br />
of vicissitudes <strong>and</strong> w<strong>and</strong>er<strong>in</strong>g. In <strong>the</strong> early n<strong>in</strong>eteenth<br />
century a portion of <strong>the</strong> tribe was located <strong>in</strong> Ohio, but<br />
<strong>in</strong> 1842 moved west to Kansas <strong>and</strong> later to a reserva-<br />
tion <strong>in</strong> nor<strong>the</strong>astern Oklahoma, where <strong>the</strong>y now reside.<br />
The rema<strong>in</strong>der of <strong>the</strong> tribe is located near Quebec,<br />
Canada.<br />
The number enumerated <strong>in</strong> <strong>1910</strong> was 353, of which<br />
320 were <strong>in</strong> Oklahoma. Comparison with previous<br />
years for that portion of <strong>the</strong> tribe <strong>in</strong> Oklahoma may<br />
be made from <strong>the</strong> reports of <strong>the</strong> Commissioner of <strong>Indian</strong><br />
Affairs, as follows:<br />
TEAK.
86 INDIANS IN THE UNITED STATES.<br />
siderably <strong>in</strong> <strong>the</strong> last 50 years. The figures are as<br />
follows<br />
:<br />
YEAK.
STOCKS AND TRIBES, BY SEX, AGE, AND BLOOD. 87<br />
KUTENAiAN STOCK (Kutenay, Kootenai).<br />
A tribe which by itself apparently constitutes an en-<br />
tire l<strong>in</strong>guistic stock. Their traditional home was <strong>in</strong><br />
nor<strong>the</strong>rn Montana <strong>and</strong> sou<strong>the</strong>rn Alberta, east of <strong>the</strong><br />
Rocky Mounta<strong>in</strong>s. From here <strong>the</strong>y moved west across<br />
<strong>the</strong> mounta<strong>in</strong>s, <strong>and</strong> s<strong>in</strong>ce <strong>the</strong> beg<strong>in</strong>n<strong>in</strong>g of <strong>the</strong> n<strong>in</strong>e-<br />
teenth century, when first known to Europeans, <strong>the</strong>y<br />
have occupied a portion of sou<strong>the</strong>astern British Columbia<br />
<strong>and</strong> <strong>the</strong> adjacent parts of northwestern Idaho <strong>and</strong><br />
Montana. Most of <strong>the</strong> Kutenai <strong>in</strong> <strong>the</strong> <strong>United</strong> <strong>States</strong><br />
are located on <strong>the</strong> Fla<strong>the</strong>ad Reservation <strong>in</strong> Montana.<br />
The number enumerated <strong>in</strong> <strong>1910</strong> was 538, of which<br />
424 were <strong>in</strong> Montana <strong>and</strong> 107 ui Idaho. Comparisons<br />
with previous years are of little value, ow<strong>in</strong>g to <strong>the</strong><br />
irregular character of <strong>the</strong> returns for this tribe <strong>in</strong> <strong>the</strong><br />
reports of <strong>the</strong> Commissioner of <strong>Indian</strong> Affairs. So<br />
far as can be judged from <strong>the</strong> figures, however, <strong>the</strong><br />
number of <strong>the</strong> Kutenai <strong>in</strong> <strong>the</strong> <strong>United</strong> <strong>States</strong> has stood<br />
almost stationary s<strong>in</strong>ce 1875.<br />
LUTUAMIAN STOCK.<br />
Stoc^ as a whole.—One of <strong>the</strong> smaller of <strong>the</strong> Pacific<br />
Coast stocks. It occupied a compact area <strong>in</strong> sou<strong>the</strong>rn<br />
Oregon <strong>and</strong> extreme nor<strong>the</strong>rn Cahfornia just east of<br />
<strong>the</strong> Cascades.<br />
The <strong>Indian</strong>s of <strong>the</strong> Lutuamian stock, as enumerated<br />
<strong>in</strong> <strong>1910</strong>, numbered 978. The tribes of this stock, for<br />
which members were reported, are as follows:<br />
Klamath. Modoc.<br />
Klamath.—The most nor<strong>the</strong>rly of <strong>the</strong> two tribes com-<br />
pos<strong>in</strong>g this stock. Their habitat, s<strong>in</strong>ce known to<br />
Europeans <strong>in</strong> <strong>the</strong> early part of <strong>the</strong> n<strong>in</strong>eteenth century,<br />
has been <strong>in</strong> Klamath County, Oreg., aa<strong>in</strong>ly about <strong>and</strong><br />
to <strong>the</strong> east of Klamath Lake. S<strong>in</strong>ce 1864 <strong>the</strong>y have<br />
been located on <strong>the</strong> IQamath Reservation <strong>in</strong> that<br />
state. f<br />
The number enumerated <strong>in</strong> <strong>1910</strong> was 696, of which<br />
646 were <strong>in</strong> Oregon. Comparable figures for that por-<br />
tion of <strong>the</strong> tribe <strong>in</strong> Oregon, as shown by <strong>the</strong> reports of<br />
<strong>the</strong> Commissioner of <strong>Indian</strong> Affairs, are as follows<br />
YEAE.<br />
:
88 INDIANS IN THE UNITED STATES.<br />
MiwoTc.—The ma<strong>in</strong> <strong>and</strong> largest subdivision of this<br />
stock. They have no dist<strong>in</strong>ctive popular name, be<strong>in</strong>g<br />
usually known only by <strong>the</strong> mean<strong>in</strong>gless term of" Digger<br />
<strong>Indian</strong>s." Their habitat, s<strong>in</strong>ce known to Europeans<br />
<strong>in</strong> <strong>the</strong> eighteenth century, has been <strong>in</strong> central California,<br />
<strong>and</strong> may be roughly described as extend<strong>in</strong>g north<br />
<strong>and</strong> south from <strong>the</strong> Cosumnes River to Fresno Creek,<br />
<strong>and</strong> east <strong>and</strong> west from <strong>the</strong> crest of <strong>the</strong> Sierras to <strong>the</strong><br />
San Joaqu<strong>in</strong> River. The Miwok, as enumerated <strong>in</strong><br />
<strong>1910</strong>, numbered 670, of which" 669 were <strong>in</strong> CaUfornia<br />
<strong>and</strong> 1 <strong>in</strong> Nevada.<br />
MUSKHOGEAN STOCK.<br />
Stock as a whole.—One of <strong>the</strong> five largest stocks <strong>in</strong><br />
<strong>the</strong> <strong>United</strong> <strong>States</strong>. At <strong>the</strong> time first known to Euro-peans,<br />
<strong>in</strong> <strong>the</strong> sixteenth century, it occupied a compact<br />
s<strong>in</strong>gle area compris<strong>in</strong>g <strong>the</strong> largest part of Mississippi,<br />
Alabama, <strong>and</strong> western <strong>and</strong> sou<strong>the</strong>rn Georgia, toge<strong>the</strong>r<br />
with <strong>the</strong> nor<strong>the</strong>rn half of Florida.<br />
The <strong>Indian</strong>s of <strong>the</strong> Muskhogean stock, as enumerated<br />
<strong>in</strong> <strong>1910</strong>, numbered 29,191. To this figure should be<br />
added perhaps 1,500 for <strong>Indian</strong>s of this stock reported<br />
without dist<strong>in</strong>ction of tribe among <strong>the</strong> general <strong>population</strong><br />
<strong>in</strong> Alabama, Mississippi, Georgia, Florida, <strong>and</strong><br />
Oklahoma, mak<strong>in</strong>g a probable total of between 30,000<br />
<strong>and</strong> 31,000. The tribes of this stock, for which mem-<br />
bers were reported, are as follows:<br />
Alibamu. Choctaw. Koasati.<br />
CMckasaw. Creek. Sem<strong>in</strong>ole.<br />
AWbamu.—^A tribe closely related to <strong>the</strong> Koasati <strong>and</strong><br />
formerly belong<strong>in</strong>g to <strong>the</strong> Creek Confederacy. Their<br />
earliest known habitat was on <strong>the</strong> lower Alabama<br />
River <strong>in</strong> Alabama. At <strong>the</strong> end of <strong>the</strong> eighteenth century<br />
<strong>and</strong> <strong>in</strong> <strong>the</strong> early portion of <strong>the</strong> n<strong>in</strong>eteenth century<br />
part of <strong>the</strong> tribe removed to Louisiana, part to Polk<br />
County, Tex., <strong>and</strong> part followed <strong>the</strong> Creeks to <strong>Indian</strong><br />
Territory. The renmants are now found <strong>in</strong> all three<br />
of <strong>the</strong>se localities, only those <strong>in</strong> Oklahoma be<strong>in</strong>g located<br />
on any reservation. These latter were not enumerated<br />
as Alibamu by <strong>the</strong> census. The number reported <strong>in</strong><br />
<strong>1910</strong> was 298, of which 187 were <strong>in</strong> Texas <strong>and</strong> 111 <strong>in</strong><br />
Louisiana.<br />
CMckasaw.—One of <strong>the</strong> larger tribes of this stock<br />
whose early habitat was <strong>in</strong> nor<strong>the</strong>rn Mississippi. By<br />
<strong>the</strong> b^<strong>in</strong>n<strong>in</strong>g of <strong>the</strong> n<strong>in</strong>eteenth century <strong>the</strong>y began to<br />
move westward to what is now Oklahoma, <strong>and</strong> <strong>in</strong> 1855<br />
were given a separate reservation <strong>the</strong>re.<br />
The number enumerated <strong>in</strong> <strong>1910</strong> was 4,2p4, of which<br />
4,191 were <strong>in</strong> Oklahoma. Comparison with earher<br />
years is made difficult by <strong>the</strong> fact that' until 1898 <strong>the</strong><br />
Chickasaw were not returned <strong>in</strong> <strong>the</strong> reports of <strong>the</strong><br />
Commissioner of <strong>Indian</strong> Affairs separate from freedmen<br />
(Negroes) <strong>and</strong> <strong>in</strong>termarried whites.* S<strong>in</strong>ce 1898<br />
<strong>the</strong> figures for this tribe <strong>in</strong> Oklahoma are as follows<br />
TEAK.<br />
:
STOCKS AND TRIBES, BY SEX, AGE, AND BLOOD. 89<br />
Florida <strong>and</strong> a small b<strong>and</strong>, ma<strong>in</strong>ly of Negro blood, are<br />
located <strong>in</strong> southwestern Texas.<br />
The number enumerated <strong>in</strong> <strong>1910</strong> was 1,729, dis-<br />
tributed as follows: Oklahoma, 1,503; Texas, 200;<br />
Florida, 16; <strong>and</strong> scatter<strong>in</strong>g, 10. The number <strong>in</strong><br />
Florida is much too small. The majority of <strong>the</strong> tribe<br />
are located <strong>in</strong> <strong>in</strong>accessible portions of <strong>the</strong> ETerglades<br />
<strong>and</strong> are very hostile stiE toward <strong>the</strong> whites, allow<strong>in</strong>g<br />
no persons <strong>in</strong> <strong>the</strong>ir territory. The number of Sem<strong>in</strong>oles<br />
thus unenumerated is estimated by a competent<br />
observer, who has been one of <strong>the</strong> few whites to be<br />
allowed to pass through <strong>the</strong> region, at about 200 to<br />
250. This would br<strong>in</strong>g <strong>the</strong> tribal number <strong>in</strong> <strong>the</strong> <strong>United</strong><br />
<strong>States</strong> to nearly 2,000.<br />
This is <strong>the</strong> only one of <strong>the</strong> Five Civilized Tribes<br />
which, accord<strong>in</strong>g to <strong>the</strong> figures <strong>in</strong> <strong>the</strong> reports of <strong>the</strong><br />
Commissioner of <strong>Indian</strong> Affairs, shows a decrease <strong>in</strong><br />
<strong>population</strong>. These figures, like those of <strong>the</strong> o<strong>the</strong>r Five<br />
Civilized Tribes, are based upon <strong>the</strong> enrollment under<br />
<strong>the</strong> Dawes Commission, <strong>and</strong> are much larger than<br />
those reported by <strong>the</strong> census, <strong>the</strong> figures for <strong>the</strong> tribe<br />
<strong>in</strong> Oklahoma <strong>in</strong> <strong>1910</strong> beiag 2,137 from <strong>the</strong> <strong>Indian</strong><br />
reports <strong>and</strong> 1,503 from <strong>the</strong> census.<br />
PIMAN STOCK.<br />
Stock as a whole.— ^The area occupied by this stock<br />
<strong>in</strong> <strong>the</strong> <strong>United</strong> <strong>States</strong> lies wholly <strong>in</strong> southwestern<br />
Arizona. The number enumerated <strong>in</strong> <strong>1910</strong> was .8,607.<br />
The tribes of this stock, for which members were<br />
reported, are as follows:<br />
Mayo. Papago. Yaqui.<br />
Opata. Pima.<br />
Mayo.—A tribe whose habitat is on <strong>the</strong> Mayo Eiver,<br />
m S<strong>in</strong>aloa, Mexico. A small niunber have <strong>in</strong> recent<br />
years emigrated to Arizona where <strong>the</strong>y are now liv<strong>in</strong>g,<br />
ma<strong>in</strong>ly with <strong>the</strong> Pima <strong>and</strong> Papago. The Mayo <strong>in</strong> <strong>the</strong><br />
<strong>United</strong> <strong>States</strong>, as enumerated <strong>in</strong> <strong>1910</strong>, numbered 40,<br />
aU <strong>in</strong> Arizona.<br />
Opata.—A tribe whose habitat comprises <strong>the</strong> region<br />
of <strong>the</strong> upper Yaqui <strong>and</strong> Sonora Rivers, <strong>in</strong> Sonora <strong>and</strong><br />
western Chihuahua, Mexico. A small number have<br />
emisrated to <strong>the</strong> <strong>United</strong> <strong>States</strong>, where <strong>the</strong> number<br />
enumerated <strong>in</strong> <strong>1910</strong> was 5, all <strong>in</strong> Arizona.<br />
Papago.—^A tribe which has long been closely asso-<br />
ciated with <strong>the</strong> Pima. Their habitat, s<strong>in</strong>ce <strong>the</strong> sixteenth<br />
century, has been <strong>the</strong> region south of Tucson,<br />
Ariz., extend<strong>in</strong>g southward <strong>in</strong>to Mexico. For many<br />
years <strong>the</strong>y have been <strong>in</strong> part ga<strong>the</strong>red on <strong>the</strong> Gila<br />
Bend <strong>and</strong> Papago Reservations.<br />
The number enumerated <strong>in</strong> <strong>1910</strong> was 3,798, of which<br />
3,785 were <strong>in</strong> Arizona. Figures for comparison are<br />
uncerta<strong>in</strong> back of 1900. Between 1870 <strong>and</strong> 1890 <strong>the</strong><br />
Papago were estimated variously at from 5,000 to<br />
7,000. In 1900 <strong>the</strong>re were 1,789 actually enumerated<br />
on <strong>the</strong> reservation, <strong>and</strong> an estimated 2,100 o<strong>the</strong>rs who<br />
were nomadic. In 1909 <strong>the</strong>re were 1 ,755 on <strong>the</strong> reserve<br />
<strong>and</strong> 2,225 returned as nomadic. In <strong>the</strong> last 10 years,<br />
<strong>the</strong>refore, <strong>the</strong> Papago have apparently rema<strong>in</strong>ed nearly<br />
stationary <strong>in</strong> nimiber, but have probably decreased<br />
somewhat s<strong>in</strong>ce 1870.<br />
Pima.—One of <strong>the</strong> largest tribes of this stock <strong>in</strong> <strong>the</strong><br />
<strong>United</strong> <strong>States</strong>. Their habitat, s<strong>in</strong>ce <strong>the</strong>y first became<br />
Imown to Europeans <strong>in</strong> <strong>the</strong> sixteenth century, has been<br />
<strong>in</strong> <strong>the</strong> valleys of <strong>the</strong> Salt <strong>and</strong> GUa Rivers <strong>in</strong> sou<strong>the</strong>rn<br />
Arizona. For many years <strong>the</strong>y have been located on<br />
<strong>the</strong> Gila <strong>and</strong> Salt River Reservations.<br />
The number enumerated <strong>in</strong> <strong>1910</strong> was 4,236, of which<br />
4,167 were <strong>in</strong> Arizona. The follow<strong>in</strong>g table, compiled<br />
from <strong>the</strong> reports of <strong>the</strong> Commissioner of <strong>Indian</strong> Affairs,<br />
gives comparative figures for this tribe <strong>in</strong> Arizona<br />
back to 1890, all figures prior to that year be<strong>in</strong>g merely<br />
estimates<br />
:<br />
TEAR.
90 INDIANS IN THE UNITED STATES<br />
sou<strong>the</strong>rn Mendoc<strong>in</strong>o, western Lake, <strong>and</strong> nor<strong>the</strong>rn<br />
Sonoma Counties, Cal. In <strong>the</strong> present census <strong>the</strong><br />
subdivisions of <strong>the</strong> stock were enumerated under <strong>the</strong>ir<br />
respective names as Clear Lake, Little Lake, etc.,<br />
but it is probable that a small proportion of <strong>the</strong>se<br />
were enumerated simply as Pomo <strong>and</strong>, if so, <strong>the</strong> totals<br />
for <strong>the</strong> subdivisions are <strong>in</strong>complete to that extent.<br />
The number emmierated <strong>in</strong> <strong>1910</strong> as Pomo were 777,<br />
of ^hich 776 were <strong>in</strong> California <strong>and</strong> 1 <strong>in</strong> Arizona.<br />
SALINAX STOCK.<br />
A name apphed for convenience to <strong>the</strong> remnants of<br />
<strong>the</strong> <strong>Indian</strong>s of this stock formerly connected with <strong>the</strong><br />
Mission of San Antonio, Monterey County, Cal., <strong>and</strong><br />
known as San Antonio. The niunber enumerated <strong>in</strong><br />
<strong>1910</strong> was only 16, all <strong>in</strong> California.<br />
SALISHAN STOCK.<br />
Stock as a whole.—The tribes of this stock extended<br />
over a large area cover<strong>in</strong>g most of nor<strong>the</strong>rn <strong>and</strong> western<br />
Wash<strong>in</strong>gton, nor<strong>the</strong>rn Idaho, <strong>and</strong> <strong>the</strong> northwestern<br />
corner of Oregon, <strong>and</strong> extend<strong>in</strong>g a considerable distance<br />
north of <strong>the</strong> <strong>in</strong>ternational boundary <strong>in</strong> British<br />
Columbia.<br />
The <strong>Indian</strong>s of <strong>the</strong> Salishan stock <strong>in</strong> <strong>the</strong> <strong>United</strong><br />
<strong>States</strong>, as enumerated <strong>in</strong> <strong>1910</strong>, numbered 7,833. To<br />
this figm-e should be added probably nearly 1,000 for<br />
<strong>Indian</strong>s of this stock reported without dist<strong>in</strong>ction of<br />
tribe among <strong>the</strong> general <strong>population</strong> ia Washiugton <strong>and</strong><br />
Idaho. The tribes of this stock, for which members<br />
were reported, are as follows:<br />
Bellacoola.
STOCKS AND TRIBES, BY SEX, AGE, AND BLOOD. 91<br />
Columbia (syn. S<strong>in</strong>kiuse).—^A name of somewhat<br />
uncerta<strong>in</strong> application, generally used, however, to<br />
apply to <strong>the</strong> <strong>Indian</strong>s of this stock occupy<strong>in</strong>g, at <strong>the</strong><br />
time when first known to Europeans, <strong>the</strong> area <strong>in</strong><br />
Wash<strong>in</strong>gton east of <strong>the</strong> Columbia River from <strong>the</strong><br />
mouth of <strong>the</strong> Okanogan to below Priests Rapids <strong>and</strong><br />
compris<strong>in</strong>g <strong>the</strong> greater part of Douglas County <strong>and</strong><br />
portions of L<strong>in</strong>coln <strong>and</strong> Adams Counties. For many<br />
years <strong>the</strong>y have been located ma<strong>in</strong>ly on <strong>the</strong> Colville<br />
Reservation.<br />
The number enumerated <strong>in</strong> <strong>1910</strong> was 385, of which<br />
333 were <strong>in</strong> Wash<strong>in</strong>gton <strong>and</strong> 52 <strong>in</strong> Oregon. Comparison<br />
with earlier years is of Httle value prior to 1890.<br />
The figures given <strong>in</strong> <strong>the</strong> reports of <strong>the</strong> Commissioner<br />
of <strong>Indian</strong> Affairs for this tribe <strong>in</strong> Wash<strong>in</strong>gton are as<br />
follows<br />
:<br />
YEAR.
92 INDIANS IN THE UNITED STATES.<br />
1875 tlie numbers as given <strong>in</strong> <strong>the</strong> reports of <strong>the</strong> Commissioner<br />
of <strong>Indian</strong> Affairs for this tribe ia Montana<br />
<strong>and</strong> Wash<strong>in</strong>gton are as follows<br />
YSAS.<br />
:
STOCKS AND TRIBES, BY SEX, AGE, AND BLOOD. 93<br />
located on <strong>the</strong> Yakima Reservation. The number<br />
enumerated <strong>in</strong> <strong>1910</strong> was 52, all <strong>in</strong> Wash<strong>in</strong>gton.<br />
PuyaUup.—A tribe belong<strong>in</strong>g to <strong>the</strong> Nisqualli<br />
group of this stock. Their habitat <strong>in</strong> <strong>the</strong> early part<br />
of <strong>the</strong> n<strong>in</strong>eteenth century was <strong>in</strong> <strong>the</strong> vic<strong>in</strong>ity of <strong>the</strong><br />
present city of Tacoma, Wash. For about 50 years<br />
<strong>the</strong>y have been ma<strong>in</strong>ly located on <strong>the</strong> Puyallup<br />
Reservation.<br />
The number enximerated <strong>in</strong> <strong>1910</strong> was 303, of which<br />
278 were <strong>in</strong> Wash<strong>in</strong>gton. The follow<strong>in</strong>g table shows<br />
figures for this tribe <strong>in</strong> Wash<strong>in</strong>gton, as given <strong>in</strong> <strong>the</strong><br />
reports of <strong>the</strong> Commissioner of <strong>Indian</strong> Affairs, as<br />
far back as 1870:<br />
YPIAB.
94 INDIANS IN THE UNITED STATES.<br />
Clallam <strong>and</strong> Lummi of Wash<strong>in</strong>gton. The number<br />
enumerated <strong>in</strong> <strong>1910</strong> was 23, all <strong>in</strong> Wash<strong>in</strong>gton.<br />
Spokan.—A small tribe occupy<strong>in</strong>g, when first known<br />
to Europeans <strong>in</strong> <strong>the</strong> beg<strong>in</strong>n<strong>in</strong>g of <strong>the</strong> n<strong>in</strong>eteenth cen-<br />
tury, a portion of eastern Wash<strong>in</strong>gton <strong>in</strong> <strong>the</strong> vic<strong>in</strong>ity<br />
of <strong>the</strong> present city of Spokane. For <strong>the</strong> last 30 or 40<br />
years <strong>the</strong>y have been located <strong>in</strong> small b<strong>and</strong>s at several<br />
different reservations, namely, <strong>the</strong> Fla<strong>the</strong>ad Reserva-<br />
tion <strong>in</strong> Montana, <strong>the</strong> Coeur d'Alene Eeservation <strong>in</strong><br />
Idaho, <strong>and</strong> <strong>the</strong> ColviUe <strong>and</strong> Spokan Reservations <strong>in</strong><br />
Wash<strong>in</strong>gton.<br />
The number enumerated <strong>in</strong> <strong>1910</strong> was 643, of which<br />
379 were <strong>in</strong> Wash<strong>in</strong>gton, 134 <strong>in</strong> Montana, <strong>and</strong> 96 <strong>in</strong><br />
Idaho. The number <strong>in</strong> <strong>the</strong>se three states, as reported<br />
by <strong>the</strong> Commissioner of <strong>Indian</strong> Affairs, is shown ia -<strong>the</strong><br />
follow<strong>in</strong>g table:<br />
TEAK.
STOCKS AND TRIBES, BY SEX, AGE, AND BLOOD. 95<br />
<strong>in</strong> <strong>1910</strong> was 405, of which 370 were <strong>in</strong> Wash<strong>in</strong>gton<br />
<strong>and</strong> 35 ia Oregon.<br />
Nez Perces.— ^The most important tribe of <strong>the</strong> Shahaptian<br />
stock. Their habitat at <strong>the</strong> begimnng of <strong>the</strong><br />
n<strong>in</strong>eteenth century, when first met by Europeans,<br />
<strong>in</strong>cluded a large area <strong>in</strong> sou<strong>the</strong>astern Wash<strong>in</strong>gton,<br />
nor<strong>the</strong>astern Oregon, <strong>and</strong> <strong>the</strong> adjacent portion of<br />
Idaho. With <strong>the</strong> <strong>in</strong>creased settlement of <strong>the</strong> region<br />
<strong>the</strong>ir territory was gradually reduced, <strong>and</strong> <strong>the</strong> major<br />
part of <strong>the</strong> tribe are now liv<strong>in</strong>g on <strong>the</strong> Nez Perces<br />
Reservation, Idaho. In consequence of <strong>the</strong> Nez<br />
Perces War of 1877 some hundreds, known as Chief<br />
Joseph's B<strong>and</strong>, were sent to <strong>the</strong> <strong>Indian</strong> Territory, <strong>and</strong><br />
later (<strong>in</strong> 1885) <strong>the</strong> remnant of this b<strong>and</strong> was removed<br />
to <strong>the</strong> ColviUe Reservation <strong>in</strong> Wash<strong>in</strong>gton, where <strong>the</strong>y<br />
now are.<br />
The number enumerated <strong>in</strong> <strong>1910</strong> was 1,259, distrib-<br />
uted as follows: Idaho, 1,035; Wash<strong>in</strong>gton, 79;<br />
Oregon, 58; Montana, 54; scatter<strong>in</strong>g, 33. Fairly ac-<br />
curate comparative figures are available for this tribe<br />
<strong>in</strong> Idaho as far back as 1890. These figures, taken<br />
from <strong>the</strong> reports of <strong>the</strong> Commissioner of <strong>Indian</strong> Affairs,<br />
are as follows:<br />
YEAE.
96<br />
<strong>in</strong> Washiagton, but no <strong>in</strong>formation was given as to<br />
particular tribes.<br />
SHASTAN STOCK.<br />
Stock as a whole.—The area occupied by "this stock<br />
comprises portions of Siskiyou, Shasta, Lassen, <strong>and</strong><br />
Modoc Coimties <strong>in</strong> nor<strong>the</strong>rn California.<br />
The <strong>Indian</strong>s of <strong>the</strong> Shastan stock, as enumerated <strong>in</strong><br />
<strong>1910</strong>, numbered 1,578. The tribes of this stock, for<br />
which members were reported, are as follows<br />
Hat Creek. Pit River. Shasta.<br />
Hat Greek.—One of <strong>the</strong> three ma<strong>in</strong> subdivisions of<br />
this stock <strong>and</strong> as a tribe closely affiliated with <strong>the</strong> Pit<br />
Eiver. Siace earhest traditional times <strong>the</strong>y have<br />
occupied a small area ia nor<strong>the</strong>astern California,<br />
compris<strong>in</strong>g Dixie Valley <strong>and</strong> <strong>the</strong> region along Hat<br />
Creek <strong>in</strong> eastern Shasta <strong>and</strong> western Lassen Coun-<br />
ties. The Hat Creek <strong>Indian</strong>s have never had any reser-<br />
vation <strong>and</strong> are liv<strong>in</strong>g scattered over <strong>the</strong>ir orig<strong>in</strong>al<br />
territory. The number enumerated ia <strong>1910</strong> was 240,<br />
all ia California.<br />
Pit River.—One of <strong>the</strong> three ma<strong>in</strong> subdivisions of<br />
this stock, <strong>and</strong> as a tribe most closely affiliated with<br />
<strong>the</strong> Hat Creek. S<strong>in</strong>ce earliest traditional times <strong>the</strong>y<br />
have occupied a smaJl area <strong>in</strong> nor<strong>the</strong>astern California,<br />
comprisiag <strong>in</strong> general <strong>the</strong> greater part of <strong>the</strong> dra<strong>in</strong>age<br />
bas<strong>in</strong> of Pit River except<strong>in</strong>g, however, Dixie Valley<br />
<strong>and</strong> <strong>the</strong> valley of Hat Creek. The majority of <strong>the</strong><br />
tribe now rema<strong>in</strong><strong>in</strong>g are scattered over <strong>the</strong>ir orig<strong>in</strong>al<br />
territory <strong>and</strong> are not located on any reservation. A<br />
small number were taken to Round Valley Reservation<br />
soon after its establishment, some of whom stiU rema<strong>in</strong><br />
<strong>the</strong>re, <strong>and</strong> a few are on <strong>the</strong> Klamath Reservation,<br />
Oreg. The number enumerated <strong>in</strong> <strong>1910</strong> was<br />
985, of which 888 were <strong>in</strong> California.<br />
Shasta.—One of <strong>the</strong> three ma<strong>in</strong> subdivisions of this<br />
stock <strong>and</strong> that from which <strong>the</strong> stock "has taken its<br />
name. S<strong>in</strong>ce earhest traditional times <strong>the</strong>y have occupied<br />
an area <strong>in</strong> nor<strong>the</strong>rn California <strong>and</strong> sou<strong>the</strong>rn<br />
Oregon, compris<strong>in</strong>g <strong>the</strong> central portion of Siskiyou<br />
Coimty, Cal., <strong>and</strong> part of <strong>the</strong> sou<strong>the</strong>rn portion of Jackson<br />
Coimty, Oreg. The majority of <strong>the</strong> tribe now rema<strong>in</strong><strong>in</strong>g<br />
are scattered over <strong>the</strong>ir orig<strong>in</strong>al territory <strong>and</strong><br />
are not on reservations. A few, however, rema<strong>in</strong> at<br />
Gr<strong>and</strong>e Ronde <strong>and</strong> Siletz Reservations, <strong>in</strong> Oregon,<br />
where a considerable portion of <strong>the</strong> tribe was kept for<br />
several years as <strong>the</strong> result of <strong>the</strong> Rogue River War.<br />
A portion of <strong>the</strong> Shasta is sometimes known as Scott<br />
Valley <strong>Indian</strong>s <strong>and</strong> <strong>the</strong> rema<strong>in</strong>der has at times been<br />
called Klamaths. The Shasta, as enumerated <strong>in</strong> <strong>1910</strong>,<br />
niunbered 353, distributed as follows: California, 255;<br />
Oregon, 96; Wash<strong>in</strong>gton, 2.<br />
SHOSHONEAN STOCK.<br />
Stock as a whole.—One of <strong>the</strong> largest stocks <strong>in</strong> <strong>the</strong><br />
<strong>United</strong> <strong>States</strong>. The ma<strong>in</strong> area occupied by this stock<br />
Ues <strong>in</strong> <strong>the</strong> <strong>in</strong>terior plateau <strong>and</strong> <strong>in</strong>cludes practically <strong>the</strong><br />
whole of Nevada <strong>and</strong> Utah <strong>and</strong> part of eastern Ore-<br />
:<br />
INDIANS IN THE UNITED STATES.<br />
:<br />
gon, sou<strong>the</strong>rn Idaho, southwestern Wyom<strong>in</strong>g, western<br />
Colorado, <strong>and</strong> sou<strong>the</strong>rn California. In addition, <strong>the</strong><br />
Comanche occupied at times a portion of <strong>the</strong> pla<strong>in</strong>s <strong>in</strong><br />
Texas <strong>and</strong> eastern New Mexico. Small areas <strong>in</strong> north-<br />
ern Arizona were alao occupied by tribes belong<strong>in</strong>g to<br />
this stock.<br />
The <strong>Indian</strong>s of <strong>the</strong> Shoshonean stock, as enumer-<br />
ated <strong>in</strong> <strong>1910</strong>, niunbered 16,842. To this figure should<br />
be added probably about 1,000 for <strong>Indian</strong>s of this<br />
stock reported without dist<strong>in</strong>ction of tribe among <strong>the</strong><br />
general <strong>population</strong> <strong>in</strong> Nevada, Utah, Colorado, Idaho,<br />
<strong>and</strong> California, mak<strong>in</strong>g a probable total of about 18,000<br />
<strong>in</strong> all. The tribes of this stock, for which members<br />
were reported, are as follows:<br />
Bannock. Kawia. San Ltuseno.<br />
Chemeliuevi. Kern River. Serrano.<br />
Comanclie. Mono. Shoshoni.<br />
Gabrieleno. Pahvant. Tehachapi.<br />
Hopi. Paiute. Ute.<br />
Juaneno. Panam<strong>in</strong>t.<br />
Kawaiisu. Paviotso.<br />
Bannock.—The tribal name is of somewhat uncer-<br />
ta<strong>in</strong> extension <strong>and</strong> has been applied <strong>in</strong> <strong>the</strong> past with<br />
considerable laxity. The early habitat of this tribe<br />
seems to have been <strong>in</strong> sou<strong>the</strong>astern Idaho <strong>and</strong> <strong>the</strong> ad-<br />
jacent portions of northwestern Wyom<strong>in</strong>g <strong>and</strong> southwestern<br />
Montana, with a probable extension westward<br />
<strong>in</strong>to southwestern Idaho nearly to <strong>the</strong> Oregon l<strong>in</strong>e.<br />
For at least 50 years <strong>the</strong>y have been closely associated<br />
with <strong>the</strong> Shoshoni. S<strong>in</strong>ce 1869 <strong>the</strong>y have been located<br />
pr<strong>in</strong>cipally on <strong>the</strong> Fort HaU Reservation <strong>in</strong> Idaho,<br />
with a smaller b<strong>and</strong> at Lemhi <strong>in</strong> <strong>the</strong> same state.<br />
The number enumerated <strong>in</strong> <strong>1910</strong> was 413, of which<br />
363 were <strong>in</strong> Idaho. Early estimates of <strong>the</strong> <strong>population</strong><br />
of <strong>the</strong> Bannock would seem almost certa<strong>in</strong> to have been<br />
exaggerated <strong>and</strong> to have <strong>in</strong>cluded under this name portions<br />
of o<strong>the</strong>r tribes. In 1829, for example, <strong>the</strong> Bannock<br />
were said to number approximately 8,000, a fig-<br />
urfe which had decreased to less than 1,000 <strong>in</strong> 1870.<br />
Between 1875 <strong>and</strong> 1899 <strong>the</strong> Bannock were retutned<br />
separately <strong>in</strong> <strong>the</strong> reports of <strong>the</strong> Commissioner of In-<br />
dian Affairs, <strong>the</strong> figures for this tribe <strong>in</strong> Idaho be<strong>in</strong>g as<br />
foUows<br />
YEAB.
STOCKS AND TRIBES, BY SEX, AGE, AND BLOOD. 97<br />
ures for earlier years are very limited. In 1866 <strong>the</strong>y<br />
were estimated at 750. S<strong>in</strong>ce <strong>the</strong>n no estimate or<br />
count has been made until <strong>the</strong> present census except<br />
for those <strong>in</strong> Arizona, whose numbers have decreased,<br />
accord<strong>in</strong>g to <strong>the</strong> reports of <strong>the</strong> Commissioner of In-<br />
dian Affairs, from 350 <strong>in</strong> 1875 to 153 <strong>in</strong> 1909.<br />
Comanche.—In recent times <strong>the</strong> most sou<strong>the</strong>rn <strong>and</strong><br />
eastern of <strong>the</strong> tribes of this stock <strong>and</strong> <strong>the</strong> only one<br />
Uv<strong>in</strong>g entirely on <strong>the</strong> pla<strong>in</strong>s. Their earhest traditional<br />
home was <strong>in</strong> Wyom<strong>in</strong>g with <strong>the</strong> Shoshohi. At<br />
an early period, however, <strong>the</strong>y were forced south <strong>and</strong><br />
<strong>in</strong> <strong>the</strong> early eighteenth century were Hv<strong>in</strong>g <strong>in</strong> Kansas<br />
<strong>and</strong> southward. Dur<strong>in</strong>g <strong>the</strong> first half of <strong>the</strong> n<strong>in</strong>e-<br />
teenth century <strong>the</strong>y roamed over a very large area<br />
extend<strong>in</strong>g southward <strong>in</strong>to Mexico. For about 50<br />
years <strong>the</strong>y Ifeve been located with <strong>the</strong> Ejowa on <strong>the</strong><br />
Kiowa <strong>and</strong> Comanche Reservations <strong>in</strong> Oklahoma.<br />
The number enumerated <strong>in</strong> <strong>1910</strong> was 1,171, of which<br />
1,160 were <strong>in</strong> Oklahoma. Comparison with figures for<br />
previous years shows a great decrease <strong>in</strong> numbers, ac-<br />
cord<strong>in</strong>g to <strong>the</strong> follow<strong>in</strong>g table, compiled from <strong>the</strong> re-<br />
ports of <strong>the</strong> Commissioner of <strong>Indian</strong> Affairs, for <strong>the</strong><br />
tribe <strong>in</strong> Oklahoma:<br />
TEAB.
98 INDIANS IN THE UNITED STATES.<br />
Paiute (see also Paviotso.)—^A tribal name which has<br />
been very loosely applied <strong>and</strong> <strong>in</strong> consequence is of<br />
uncerta<strong>in</strong> application. Used at different times for sev-<br />
eral of <strong>the</strong> Shoshonean tribes of <strong>the</strong> <strong>in</strong>terior plateau,<br />
it is properly restricted to <strong>the</strong> <strong>Indian</strong>s of southwestern<br />
Utah <strong>and</strong> <strong>the</strong> adjacent portions of sou<strong>the</strong>rn Nevada,<br />
California, <strong>and</strong> northwestern Arizona. The Paiute, as<br />
so def<strong>in</strong>ed, have occupied this same area s<strong>in</strong>ce known<br />
to Europeans.<br />
The number enumerated <strong>in</strong> <strong>1910</strong> was 780, of which<br />
247 were <strong>in</strong> Nevada, 238 <strong>in</strong> Utah, <strong>and</strong> 210 <strong>in</strong> California.<br />
No comparison can well be made with earlier years, as<br />
<strong>the</strong> use of <strong>the</strong> name Paiute has been so variable. In<br />
1873 what are above def<strong>in</strong>ed as Paiute were estimated<br />
at 2,027. The report of <strong>the</strong> Commissioner of <strong>Indian</strong><br />
Affairs gives <strong>the</strong> total <strong>in</strong> <strong>1910</strong> as 819, of whom only 449<br />
were under <strong>the</strong> control of <strong>the</strong> <strong>Indian</strong> Office.<br />
Panam<strong>in</strong>t.—A group or b<strong>and</strong> occupy<strong>in</strong>g, s<strong>in</strong>ce known<br />
to EuropeaJQs, <strong>the</strong> region of Panam<strong>in</strong>t Valley, Inyo<br />
County, Cal. The number enumerated <strong>in</strong> <strong>1910</strong> was 10,<br />
of which 9 were <strong>in</strong> California <strong>and</strong> 1 <strong>in</strong> Nevada.<br />
Paviotso (syn. Snake).—Probably <strong>the</strong> most conven-<br />
ient term under which to group <strong>the</strong> Snakes <strong>and</strong> socalled<br />
Paiutes of sou<strong>the</strong>astern Oregon, western Nevada<br />
<strong>and</strong> <strong>the</strong> eastern edge of California as far south as Lake<br />
Tahoe. They are very closely allied to <strong>the</strong> Mono <strong>and</strong><br />
can be separated from <strong>the</strong>m <strong>in</strong> <strong>the</strong> present enumera-<br />
tion only somewhat arbitrarily, as <strong>the</strong> latter are also<br />
sometimes locally known as Paiutes. As enumerators<br />
failed to distiaguish between <strong>the</strong> true Paiute <strong>and</strong> <strong>the</strong><br />
Paviotso, an arbitrary but approximately correct divi-<br />
sion was made by tabulat<strong>in</strong>g as Paiute only those enumerated<br />
with<strong>in</strong> <strong>the</strong> area known to have been occupied<br />
by <strong>the</strong>m <strong>and</strong> class<strong>in</strong>g as Paviotso all Paiute enumerated<br />
<strong>in</strong> <strong>the</strong> area above def<strong>in</strong>ed as <strong>the</strong> Paviotso habitat.<br />
Ow<strong>in</strong>g to <strong>the</strong> impossibility of separat<strong>in</strong>g <strong>the</strong> Paviotso<br />
with certa<strong>in</strong>ty from <strong>the</strong> Paiute <strong>and</strong> <strong>the</strong> Mono, <strong>the</strong> fig-<br />
ures must be regarded as approximate only.<br />
So far as known, <strong>the</strong> Paviotso have always occupied<br />
<strong>the</strong> area above outl<strong>in</strong>ed. At present <strong>the</strong>y are to be<br />
found widely scattered throughout this area, a m<strong>in</strong>ority<br />
beiag located on <strong>the</strong> follow<strong>in</strong>g reservations: Pyramid<br />
Lake, Walker River, <strong>and</strong> Duck Valley (Western<br />
Shoshoni) Reservations, Nev.; Fort Bidwell School,<br />
Cal. ; Klamath Reservation, Oreg. (known here as Walpapi<br />
<strong>and</strong> Yahusk<strong>in</strong> Snakes); <strong>and</strong> Warm Spr<strong>in</strong>gs Res-<br />
ervation, Oreg.<br />
The number enumerated <strong>in</strong> <strong>1910</strong> was 3,038, distributed<br />
as follows: Nevada, 2,414; Oregon, 341; Idaho,<br />
152; California, 101; <strong>and</strong> scatter<strong>in</strong>g, 30. No comparison<br />
which is of value can be made with earlier years.<br />
San Luiseno (syn. Luiseno).—A subdivision of <strong>the</strong><br />
California Shoshonean, occupy<strong>in</strong>g <strong>in</strong> <strong>the</strong> eighteenth<br />
century an area ia western Riverside <strong>and</strong> northwestern<br />
San Diego Counties, tributary to <strong>the</strong> Mission of San<br />
Luis Rey. They are now located ma<strong>in</strong>ly on several<br />
small reservations ia this area.<br />
The number enumerated <strong>in</strong> <strong>1910</strong> was 467, all <strong>in</strong> Cali-<br />
fornia. Comparison with earlier years is difficult, as<br />
<strong>the</strong> use of <strong>the</strong> term has not always been uniform, <strong>and</strong><br />
<strong>the</strong> figures given <strong>in</strong> <strong>the</strong> reports of <strong>the</strong> Commissioner of<br />
<strong>Indian</strong> Affairs probably <strong>in</strong>clude persons belong<strong>in</strong>g to<br />
o<strong>the</strong>r tribes. The figures back to 1870, however, are<br />
as follows:<br />
.<br />
TEAR.
STOCKS AND TRIBES, BY SEX, AGE, AND. BLOOD. 99<br />
<strong>and</strong> Utah. At present <strong>the</strong> Ute are located as follows<br />
The Capote, Moache, <strong>and</strong> Wim<strong>in</strong>uchi at <strong>the</strong> Sou<strong>the</strong>rn<br />
Ute Reservation <strong>in</strong> Colorado ; <strong>the</strong> Uncompahgre, U<strong>in</strong>ta,<br />
<strong>and</strong> White River (made up of remnants of several<br />
b<strong>and</strong>s), at <strong>the</strong> U<strong>in</strong>ta <strong>and</strong> Uncompahgre Reservations<br />
<strong>in</strong> Utah.<br />
The number enumerated ia <strong>1910</strong>, combia<strong>in</strong>g all <strong>the</strong><br />
separate b<strong>and</strong>s <strong>and</strong> <strong>Indian</strong>s enumerated simply as Ute,<br />
was 2,244, of which 1,472 were <strong>in</strong> Utah <strong>and</strong> 725 ia<br />
Colorado. Comparative figures are of value only as<br />
far back as 1895, earlier figures be<strong>in</strong>g ra<strong>the</strong>r uncerta<strong>in</strong>.<br />
About 1870 <strong>the</strong> Ute were estimated at 4,000; <strong>in</strong> 1883,<br />
at about 3,000. From 1 895 on, <strong>the</strong> figures for <strong>the</strong> tribe<br />
<strong>in</strong> Utah <strong>and</strong> Colorado, as given <strong>in</strong> <strong>the</strong> reports of <strong>the</strong><br />
Commissioner of <strong>Indian</strong> Affairs, are as follows:<br />
TEAK.<br />
:
:<br />
100 INDIANS IN THE UNITED STATES.<br />
Ventres), <strong>the</strong>ir earliest known habitat was <strong>in</strong> eastern<br />
Montana <strong>and</strong> <strong>the</strong> Dakotas. From here <strong>the</strong>y moved<br />
westward to <strong>the</strong> base of <strong>the</strong> Rocky Mounta<strong>in</strong>s, previous<br />
to <strong>the</strong> beg<strong>in</strong>n<strong>in</strong>g of <strong>the</strong> n<strong>in</strong>eteenth century. They<br />
have been located for many years on <strong>the</strong> Crow Eeservation<br />
<strong>in</strong> Montana.<br />
The number enumerated <strong>in</strong> <strong>1910</strong> was 1,799, of which<br />
1,698 were <strong>in</strong> Montana. Comparative figures, taken<br />
from <strong>the</strong> reports of <strong>the</strong> Commissioner of <strong>Indian</strong><br />
Affairs, show that <strong>the</strong> Crow have suffered a great de-<br />
crease <strong>in</strong> <strong>the</strong> last 30 years. In 1867 <strong>the</strong>y were estimated<br />
at about 4,000. The figures for this tribe <strong>in</strong><br />
Montana are as follows<br />
TEAB.
STOCKS AND TRIBES, BY SEX, AGE, AND BLOOD. 101<br />
tional habitat was apparently <strong>in</strong> Wiscons<strong>in</strong> or, at<br />
least, east of <strong>the</strong> Mississippi. In <strong>the</strong> eighteenth cen-<br />
tury, however, <strong>the</strong>y were <strong>in</strong> Missouri, but had dw<strong>in</strong>-<br />
dled by <strong>the</strong> beg<strong>in</strong>n<strong>in</strong>g of <strong>the</strong> n<strong>in</strong>eteenth century to a<br />
mere h<strong>and</strong>ful. They alhed <strong>the</strong>mselves later with <strong>the</strong><br />
Oto, <strong>and</strong> <strong>in</strong> 1882 moved with <strong>the</strong>m to Oklahoma where<br />
<strong>the</strong> few survivors are located on <strong>the</strong> Oto Reservation.<br />
The Missouri, as enumerated <strong>in</strong> <strong>1910</strong>, numbered 13,<br />
of which 12 were <strong>in</strong> Oklahoma <strong>and</strong> 1 <strong>in</strong> Wash<strong>in</strong>gton.<br />
Omaha.—One of <strong>the</strong> five tribes form<strong>in</strong>g <strong>the</strong> Dhegiha<br />
group of this stock. Their earhest traditional home<br />
was <strong>in</strong> sou<strong>the</strong>rn Ill<strong>in</strong>ois, whence <strong>the</strong>y moved west up<br />
<strong>the</strong> Missouri, <strong>and</strong>, when first known to Europeans,<br />
were located <strong>in</strong> eastern Nebraska <strong>and</strong> sou<strong>the</strong>rn South<br />
Dakota. For about 50 years <strong>the</strong>y have been located<br />
on <strong>the</strong> Omaha Reservation, Nebr.<br />
The number enumerated <strong>in</strong> <strong>1910</strong> was 1,105, of which<br />
1,075 were <strong>in</strong> Nebraska. The reports of <strong>the</strong> Commis-<br />
sioner of <strong>Indian</strong> Affairs show comparative figures for<br />
this tribe <strong>in</strong> Nebraska, as foUows:<br />
TEAK.
102 INDIANS IN THE UNITED STATES.<br />
Santee Sioux (syn. Wahpekute Sioux, Mdewakanton<br />
Sioux).—^A tribal name of somewhat uncerta<strong>in</strong> ex-<br />
tension. It has been used generally as apply<strong>in</strong>g to<br />
<strong>the</strong> Sioux (ma<strong>in</strong>ly mixed Wahpekute <strong>and</strong> Mdewakanton<br />
Sioux), now at <strong>the</strong> Santee Reservation <strong>in</strong> Nebraska<br />
<strong>and</strong> at Fl<strong>and</strong>reau, S. Dak., toge<strong>the</strong>r with <strong>the</strong> scattered<br />
Mdewakanton <strong>in</strong> M<strong>in</strong>nesota. The earliest assignable<br />
habitat of <strong>the</strong>se two subdivisions of <strong>the</strong> Dakota or<br />
Sioux was <strong>in</strong> <strong>the</strong> Lake district of nor<strong>the</strong>rn M<strong>in</strong>nesota.<br />
After <strong>the</strong> <strong>Indian</strong> outbreak of 1862 <strong>the</strong> majority were<br />
removed to Crow Creek, S. Dak., <strong>and</strong> later (1866) to<br />
<strong>the</strong> Santee Reservation <strong>in</strong> Nebraska, whence a portion<br />
aga<strong>in</strong> removed to Fl<strong>and</strong>reau, S. Dak., <strong>in</strong> 1876.<br />
The number enumerated <strong>in</strong> <strong>1910</strong> was 1,539, distributed<br />
as follows: Nebraska, 708; South Dakota, 378;<br />
M<strong>in</strong>nesota, 232; Montana, 107; North Dakota, 100;<br />
scatter<strong>in</strong>g, 14. Figures for <strong>the</strong> portions of this tribe<br />
<strong>in</strong> Nebraska, South Dakota, <strong>and</strong> M<strong>in</strong>nesota are avail-<br />
able back to 1875, from <strong>the</strong> reports of <strong>the</strong> Conunis-<br />
sioner of <strong>Indian</strong> Affairs, as follows:<br />
TEAE.
STOCKS AND TRIBES, BY SEX, AGE, AND BLOOD. 103<br />
At present <strong>the</strong> tribe is located ma<strong>in</strong>ly on <strong>the</strong> Rosebud,<br />
Crow Creek, <strong>and</strong> Lower Brule Reserrations, S. Dak.<br />
The number enumerated <strong>in</strong> <strong>1910</strong> was 806, of which<br />
795 were <strong>in</strong> South Dakota.<br />
Eunkpapa Sioux.—A tribe or subdivision of <strong>the</strong><br />
Teton group of <strong>the</strong> Sioux. In <strong>the</strong> early part of <strong>the</strong><br />
n<strong>in</strong>eteenth century, <strong>the</strong>y occupied a considerable area<br />
<strong>in</strong> North Dakota, chiefly west of <strong>the</strong> Missouri. They<br />
are now located ma<strong>in</strong>ly on <strong>the</strong> St<strong>and</strong><strong>in</strong>g Rock Reservation<br />
<strong>in</strong> North <strong>and</strong> South Dakota. The nxomber<br />
enimierated <strong>in</strong>«<strong>1910</strong> was 1,072, of which 930 were <strong>in</strong><br />
South Dakota <strong>and</strong> 142 <strong>in</strong> North Dakota. Accord<strong>in</strong>g<br />
to <strong>the</strong> reports of <strong>the</strong> Commissioner of <strong>Indian</strong> Affairs,<br />
<strong>the</strong> number of this tribe <strong>in</strong> previous years was as fol-<br />
lows: 1875, 2,100; 1885, 1,805; 1890, 1,734.<br />
M<strong>in</strong>niconjou Sioux.—A tribe or subdivision of <strong>the</strong><br />
Teton group of <strong>the</strong> Sioux. In <strong>the</strong> beg<strong>in</strong>n<strong>in</strong>g of <strong>the</strong><br />
n<strong>in</strong>eteenth century <strong>the</strong>y occupied a considerable area<br />
along <strong>and</strong> west of <strong>the</strong> Missouri River, <strong>in</strong> South Dakota.<br />
They are now located on <strong>the</strong> Cheyenne River Reservation,<br />
S. Dak. The number enumerated <strong>in</strong> <strong>1910</strong> was<br />
397, of which 387 were <strong>in</strong> South Dakota <strong>and</strong> 10 <strong>in</strong><br />
North Dakota. Accord<strong>in</strong>g to <strong>the</strong> reports of <strong>the</strong> Com-<br />
missioner of <strong>Indian</strong> Affairs, this tribe was estimated at<br />
about 4,000 <strong>in</strong> 1875, had decreased to 1,221 <strong>in</strong> 1885,<br />
<strong>and</strong> risen to 1,268 <strong>in</strong> 1888, s<strong>in</strong>ce which date no separate<br />
figures are available.<br />
Oglala Sioux (syn. Loafer Sioux).—The largest tribe<br />
or subdivision of <strong>the</strong> Teton group of <strong>the</strong> Sioux. When<br />
first known to Europeans <strong>the</strong>y were liv<strong>in</strong>g along <strong>the</strong><br />
Missouri River <strong>in</strong> South Dakota. The majority of <strong>the</strong><br />
Oglala are now located on <strong>the</strong> P<strong>in</strong>e Ridge Reservation,<br />
S. Dak. The number enumerated <strong>in</strong> <strong>1910</strong> was<br />
6,045, of which 5,998 were <strong>in</strong> South Dakota. Accord<strong>in</strong>g<br />
to <strong>the</strong> reports of <strong>the</strong> Commissioner of <strong>Indian</strong> Af-<br />
fairs, <strong>the</strong> number of this tribe <strong>in</strong> earlier years was as<br />
follows: 18S1, 10,286; 1886, 7,417; 1891, 6,356.<br />
Sans Arc Sioux.—^A tribe or subdivision of <strong>the</strong><br />
Teton group of <strong>the</strong> Sioux. They are not mentioned<br />
much before <strong>the</strong> middle of <strong>the</strong> n<strong>in</strong>eteenth century, <strong>and</strong><br />
were <strong>the</strong>n liv<strong>in</strong>g mostly west of <strong>the</strong> Missouri River, <strong>in</strong><br />
North <strong>and</strong> South Dakota. For many years <strong>the</strong>y have<br />
been ma<strong>in</strong>ly located on <strong>the</strong> Cheyenne River Reservation,<br />
S. Dak., <strong>in</strong> which state 213 were enumerated<br />
<strong>in</strong> <strong>1910</strong> out of a total of 222.<br />
SiJiasapa (syn. Blackfoot Sioux) .-^A tribe or subdivision<br />
of <strong>the</strong> Teton group of <strong>the</strong> Sioux. About <strong>the</strong><br />
middle of <strong>the</strong> n<strong>in</strong>eteenth century, when first known to<br />
Europeans, '<strong>the</strong>y were liv<strong>in</strong>g west of <strong>the</strong> Missouri <strong>in</strong><br />
North <strong>and</strong> South Dakota. They are now located on<br />
<strong>the</strong> Cheyenne River <strong>and</strong> St<strong>and</strong><strong>in</strong>g Rock Reservations,<br />
N. <strong>and</strong> S. Dak. The number enumerated <strong>in</strong> <strong>1910</strong> was<br />
485 of which 346 were <strong>in</strong> South Dakota <strong>and</strong> 137 <strong>in</strong><br />
North Dakota.<br />
Two Kettle Sioux.—A tribe or subdivision of <strong>the</strong><br />
Teton group of <strong>the</strong> Sioux. They are not mentioned<br />
much before <strong>the</strong> middle of <strong>the</strong> n<strong>in</strong>eteenth century,<br />
when <strong>the</strong>y occupied <strong>the</strong> region along <strong>the</strong> Missouri<br />
River <strong>and</strong> its western tributaries <strong>in</strong> South Dakota.<br />
For 40 years or more <strong>the</strong>y have been located ma<strong>in</strong>ly<br />
on <strong>the</strong> Cheyenne River Reservation, S. Dak. The<br />
number enumerated <strong>in</strong> <strong>1910</strong> was 293, of which 288<br />
were <strong>in</strong> South Dakota <strong>and</strong> 5 <strong>in</strong> North Dakota.<br />
W<strong>in</strong>nebago.—In <strong>the</strong> early part of <strong>the</strong> seventeenth<br />
century, when first known to Europeans, this tribe<br />
was located <strong>in</strong> <strong>the</strong> vic<strong>in</strong>ity of Green Bay, Wis. Mov-<br />
<strong>in</strong>g west <strong>in</strong> <strong>the</strong> first part of <strong>the</strong> n<strong>in</strong>eteenth century,<br />
a portion of <strong>the</strong> tribe was located successively <strong>in</strong><br />
Iowa, M<strong>in</strong>nesota, <strong>and</strong> South Dakota, until <strong>in</strong> 1864<br />
<strong>the</strong>y were f<strong>in</strong>ally assigned to a reservation <strong>in</strong> Nebraska,<br />
where <strong>the</strong>y haye s<strong>in</strong>ce rema<strong>in</strong>ed. More than half<br />
<strong>the</strong>ir number, however, are still found <strong>in</strong> Wiscons<strong>in</strong>.<br />
The number enumerated <strong>in</strong> <strong>1910</strong> was 1,820, of<br />
which 1,007 were <strong>in</strong> Nebraska <strong>and</strong> 735 <strong>in</strong> Wiscons<strong>in</strong>.<br />
Comparative figures are available for <strong>the</strong> tribe <strong>in</strong><br />
<strong>the</strong>se two states, from <strong>the</strong> reports of <strong>the</strong> Commis-<br />
sioner of <strong>Indian</strong> Affairs, as far back as 1865, but,<br />
prior to 1900, <strong>the</strong>y <strong>in</strong>clude estimates only for that<br />
portion <strong>in</strong> Wiscons<strong>in</strong>. The figures are as follows:<br />
TEAB.
104 INDIANS IN THE UNITED STATES.<br />
reports of <strong>the</strong> Commissioner of <strong>Indian</strong> Affairs, are as<br />
follows<br />
:<br />
TEAR.
STOCKS AND TRIBES, BY SEX, AGE, AND BLOOD.<br />
The number enumerated <strong>in</strong> <strong>1910</strong> was 88, all <strong>in</strong> New<br />
Mexico. The follow<strong>in</strong>g figures, conta<strong>in</strong>ed <strong>in</strong> <strong>the</strong><br />
reports of <strong>the</strong> Commissioner of <strong>Indian</strong> Affairs, show<br />
tiip,t, compared with 50 years ago, <strong>the</strong> <strong>population</strong> of<br />
this pueblo has decreased:<br />
YEAB.
106 INDIANS IN THE UNITED STATES.<br />
The number enumerated <strong>in</strong> <strong>1910</strong> was 77, all <strong>in</strong> New<br />
Mexico. The follow<strong>in</strong>g figures, taken from <strong>the</strong> reports<br />
of <strong>the</strong> Commissioner of <strong>Indian</strong> Affairs, show that <strong>the</strong><br />
<strong>population</strong> of this pueblo has decl<strong>in</strong>ed somewhat <strong>in</strong> <strong>the</strong><br />
last 50 years:<br />
TEAR.
STOCKS AND TRIBES, BY SEX, AGE, AND BLOOD. 107<br />
WAKASHAN STOCK.<br />
Stock as a whole.—^A stock whose ma<strong>in</strong> area of dis-<br />
tribution lies outside <strong>the</strong> <strong>United</strong> <strong>States</strong>, <strong>in</strong> British<br />
Columbia, ma<strong>in</strong>ly <strong>in</strong> Vancouver Isl<strong>and</strong> <strong>and</strong> <strong>the</strong> adjacent<br />
ma<strong>in</strong>l<strong>and</strong> coast as far north &i 54 degrees north<br />
latitude.<br />
The <strong>Indian</strong>s of <strong>the</strong> Wakashan stock <strong>in</strong> <strong>the</strong> <strong>United</strong><br />
<strong>States</strong>, as enumerated <strong>in</strong> <strong>1910</strong>, numbered 388. The<br />
tribes of this stock, for which members were reported,<br />
are as follows<br />
:<br />
Kitamat. Makah.<br />
•<br />
KwaMutl.<br />
Nootka.<br />
Kitamat—A tribe closely related to <strong>the</strong> Kwakiutl,<br />
liv<strong>in</strong>g on Douglas Channel, British Columbia. One<br />
white haK-breed woman, belong<strong>in</strong>g to this tribe, was<br />
enumerated <strong>in</strong> Wash<strong>in</strong>gton <strong>in</strong> <strong>1910</strong>.<br />
Kwakiutl.—A tribe occupy<strong>in</strong>g <strong>the</strong> ^<br />
nor<strong>the</strong>astern portion<br />
of Vancouver Isl<strong>and</strong>. One male, a mixed<br />
Kwakiutl-Lummi, was reported from Wash<strong>in</strong>gton <strong>in</strong><br />
<strong>1910</strong>.<br />
Makah.—The only tribe of this stock liv<strong>in</strong>g with<strong>in</strong><br />
<strong>the</strong> <strong>United</strong> <strong>States</strong>, <strong>the</strong> o<strong>the</strong>r members occupy<strong>in</strong>g parts<br />
of Vancouver Isl<strong>and</strong> <strong>and</strong> <strong>the</strong> adjacent coast of British<br />
Columbia.<br />
The Makah have lived, s<strong>in</strong>ce known to Europeans<br />
at <strong>the</strong> end of <strong>the</strong> eighteenth century, <strong>in</strong> <strong>the</strong> vic<strong>in</strong>ity of<br />
Cape Flattery, Wash., where a reservation was estab-<br />
lished for <strong>the</strong>m <strong>in</strong> 1855.<br />
The number enumerated <strong>in</strong> <strong>1910</strong> was 360, of which<br />
354 were <strong>in</strong> Wash<strong>in</strong>gton <strong>and</strong> 6 <strong>in</strong> Oregon. From <strong>the</strong><br />
follow<strong>in</strong>g figures, taken from <strong>the</strong> reports of <strong>the</strong> Commissioner<br />
of <strong>Indian</strong> Affairs, it. is seen that <strong>the</strong> general<br />
course of <strong>the</strong> <strong>population</strong> of this tribe <strong>in</strong> Wash<strong>in</strong>gton<br />
was slightly downward from 1870 to 1900, after which<br />
<strong>the</strong>re was an <strong>in</strong>crease. The high figures for 1865 <strong>and</strong><br />
1880 must have been due to errors of some sort.<br />
TEAR.
108 INDIANS IN THE UNITED STATES.<br />
vnYAT STOCK (syn. Wishoskan).<br />
A small group constitut<strong>in</strong>g by itself a dist<strong>in</strong>ct l<strong>in</strong>-<br />
guistic stock <strong>and</strong> destitute of any real tribal subdivisions<br />
or popular name o<strong>the</strong>r than Hiunboldt Bay.<br />
Their habitat s<strong>in</strong>ce earliest traditional times has been<br />
on <strong>the</strong> nor<strong>the</strong>rn California coast <strong>in</strong> <strong>the</strong> vic<strong>in</strong>ity of<br />
Humboldt Bay, Humboldt County. They have not<br />
been located on any reservation <strong>and</strong> are to-day scat-<br />
tered throughout <strong>the</strong>ir orig<strong>in</strong>al territory. The num-.<br />
ber enumerated <strong>in</strong> <strong>1910</strong> was 152, all <strong>in</strong> California.<br />
TAKONAN STOCK.<br />
Stock as a whole.—A small Oregon stock, formerly<br />
occupy<strong>in</strong>g an area along <strong>the</strong> coast <strong>in</strong> L<strong>in</strong>coln, Lane,<br />
<strong>and</strong> Douglas Counties.<br />
The Lidians of <strong>the</strong> Yakonan stock, as enumerated<br />
ia <strong>1910</strong>, numbered 55. The tribes of this stock, for<br />
which members were reported, are as follows<br />
Alsea. Siuslaw. Yaqu<strong>in</strong>a.<br />
Alsea.—The habitat of <strong>the</strong> Alsea, when first known<br />
to Europeans <strong>in</strong> <strong>the</strong> beg<strong>in</strong>n<strong>in</strong>g of <strong>the</strong> n<strong>in</strong>eteenth century,<br />
was on Alsea Bay <strong>and</strong> River <strong>in</strong> sou<strong>the</strong>rn L<strong>in</strong>coln<br />
<strong>and</strong> Benton Counties, Oreg. A reservation was estab-<br />
lished for <strong>the</strong>m <strong>in</strong> this vic<strong>in</strong>ity at first, but about 1870<br />
<strong>the</strong>y were moved to <strong>the</strong> Siletz Eeservation, <strong>and</strong> a few<br />
were later placed at Gr<strong>and</strong>e Ronde. The remnant are<br />
now ma<strong>in</strong>ly located at Siletz. The number enumerated<br />
<strong>in</strong> <strong>1910</strong> was 29, of which 27 were <strong>in</strong> Oregon.<br />
Siuslaw.—The sou<strong>the</strong>rnmost of <strong>the</strong> tribes compos-<br />
<strong>in</strong>g this stock. Their habitat, when first known to<br />
Europeans at <strong>the</strong> beg<strong>in</strong>n<strong>in</strong>g of <strong>the</strong> n<strong>in</strong>eteenth century,<br />
was on <strong>the</strong> Siuslaw River <strong>and</strong> <strong>the</strong> adjacent coast <strong>in</strong><br />
western Lane County, Oreg. They were ga<strong>the</strong>red at<br />
an early date on <strong>the</strong> Alsea Reservation <strong>and</strong> transferred<br />
later to <strong>the</strong> Siletz Reservation where <strong>the</strong> remnant still<br />
resides. The Siuslaw, as enumerated <strong>in</strong> <strong>1910</strong>, numbered<br />
7, all <strong>in</strong> Oregon.<br />
Yaqu<strong>in</strong>a.—^A small tribe liv<strong>in</strong>g <strong>in</strong> <strong>the</strong> early n<strong>in</strong>eteenth<br />
century about Yaqu<strong>in</strong>a Bay, L<strong>in</strong>coln County,<br />
Oreg. The remnant is now ma<strong>in</strong>ly located on <strong>the</strong><br />
SUetz Reservation. The number enumerated <strong>in</strong> <strong>1910</strong><br />
was 19, of which 13 were <strong>in</strong> Oregon *<strong>and</strong> 6 <strong>in</strong> Wash-<br />
<strong>in</strong>gton.<br />
TANAN STOCK (syn. Nozi).<br />
The only surviv<strong>in</strong>g subdivision of this small stock,<br />
which occupied a small area <strong>in</strong> nor<strong>the</strong>rn California, <strong>in</strong><br />
nor<strong>the</strong>astern Tehama, <strong>and</strong> <strong>the</strong> adjacent parts of Shasta<br />
County as far north as Round Mounta<strong>in</strong>. In 1864<br />
nearly <strong>the</strong> entire tribe, <strong>the</strong>n number<strong>in</strong>g about 3,000,<br />
was massacred by m<strong>in</strong>ers. The whole stock is to-day<br />
practically ext<strong>in</strong>ct, only 39 hav<strong>in</strong>g been enumerated<br />
<strong>in</strong> <strong>1910</strong>, all <strong>in</strong> California.<br />
:<br />
TOKUTS STOCK (syn. Mariposan).<br />
Stock as a wTiole.—This is a Cahfornian stock, occupy<strong>in</strong>g<br />
an area <strong>in</strong> <strong>the</strong> sou<strong>the</strong>astern part of <strong>the</strong> Sacramento<br />
Valley <strong>and</strong> <strong>the</strong> adjacent foothills of <strong>the</strong> Sierra<br />
Nevada.<br />
The <strong>Indian</strong>s of <strong>the</strong> Yokuts stock, as enumerated <strong>in</strong><br />
<strong>1910</strong>, numbered 533. The tribes of this stock, for<br />
which members were reported, are as follows<br />
Cho<strong>in</strong>imni. Kashowoo. Wikchamni.<br />
Chooldm<strong>in</strong>ali. TacM. Yokuts.<br />
Chukchansi. Wechikhit. Yowdanchi.<br />
Cho<strong>in</strong>imni.—^A small group of <strong>Indian</strong>s whose habitat<br />
was formerly on K<strong>in</strong>gs River, near <strong>the</strong> mouth of Mill<br />
Creek, <strong>in</strong> Fresno County, Cal. The number enumerated<br />
<strong>in</strong> <strong>1910</strong> was 18, aU <strong>in</strong> Cahfomia.<br />
Chookim<strong>in</strong>ah.—^A small group of <strong>Indian</strong>s liv<strong>in</strong>g <strong>in</strong><br />
Fresno County, Cal. The number enumerated <strong>in</strong> <strong>1910</strong><br />
was 4, aU <strong>in</strong> California.<br />
OhukchanM.—One of <strong>the</strong> nor<strong>the</strong>rn tribes of this<br />
stock occupy<strong>in</strong>g <strong>the</strong> foothills <strong>in</strong> <strong>the</strong> sou<strong>the</strong>rn part of<br />
Madera County, Cal. The number enumerated <strong>in</strong> 1 9 10<br />
was 144, of which 142 were <strong>in</strong> California <strong>and</strong> 2 <strong>in</strong><br />
Arizona.<br />
Kashowoo.— ^A small group belong<strong>in</strong>g to this stock<br />
<strong>and</strong> liv<strong>in</strong>g <strong>in</strong> Fresno County, Cal. The number enumerated<br />
<strong>in</strong> <strong>1910</strong> was 4, all <strong>in</strong> California.<br />
TacM.— ^A tribe formerly liv<strong>in</strong>g <strong>in</strong> <strong>the</strong> sou<strong>the</strong>rn end<br />
of <strong>the</strong> San Joaqu<strong>in</strong> Valley, Cal. The sm-vivors are<br />
now ma<strong>in</strong>ly located <strong>in</strong> K<strong>in</strong>gs County. The number<br />
enumerated <strong>in</strong> <strong>1910</strong> was 27, aU <strong>in</strong> California.<br />
Wechikhit.—^A small tribe liv<strong>in</strong>g formerly on lower<br />
Kjngs River, Fresno Cotmty, Cal. The number enumerated<br />
<strong>in</strong> <strong>1910</strong> was 6, all <strong>in</strong> California.<br />
Wikchamni.—^A small tribe liv<strong>in</strong>g on <strong>the</strong> Kaweah<br />
River <strong>in</strong> Tulare County, Cal. The number enumerated<br />
<strong>in</strong> <strong>1910</strong> was 25, of which 24 were <strong>in</strong> California <strong>and</strong> 1 <strong>in</strong><br />
Wash<strong>in</strong>gton.<br />
Yokuts.— ^A tribe formerly compris<strong>in</strong>g a number of<br />
separate subdivisions <strong>and</strong> occupy<strong>in</strong>g a considerable<br />
area <strong>in</strong> <strong>the</strong> sou<strong>the</strong>rn San Joaqu<strong>in</strong> Valley (chiefly <strong>in</strong><br />
Madera, Fresno, <strong>and</strong> Tulare Coimties), Cal. A portion<br />
of <strong>the</strong> survivors are now located on <strong>the</strong> Tule<br />
River Reservation, <strong>the</strong> rema<strong>in</strong>der be<strong>in</strong>g scattered<br />
throughout <strong>the</strong> area of <strong>the</strong>ir former habitat. Of <strong>the</strong><br />
many subdivisions formerly exist<strong>in</strong>g, representatives<br />
of <strong>the</strong> Cho<strong>in</strong>imni, Chookim<strong>in</strong>ah, Chukchansi, Kashowoo,<br />
Tachi, Wechikhit, Wikchamni, <strong>and</strong> Yowdanchi<br />
were enumerated by <strong>the</strong> present census. The fragments<br />
of <strong>the</strong> many o<strong>the</strong>r tribes, toge<strong>the</strong>r perhaps with<br />
a few o<strong>the</strong>r <strong>in</strong>dividuals of <strong>the</strong> above tribes, are here<br />
grouped shnply as Yokuts—a portion now be<strong>in</strong>g lo-<br />
cated on <strong>the</strong> Tule River Reservation <strong>and</strong> <strong>the</strong> o<strong>the</strong>rs<br />
scatter<strong>in</strong>g. The Yokuts so def<strong>in</strong>ed, as enumerated<br />
<strong>in</strong> <strong>1910</strong>, numbered 302, all <strong>in</strong> California.<br />
:
STOCKS AND TRIBES, BY SEX, AGE, AND BLOOD. 109<br />
Yowdanchi.—A tribe Ev<strong>in</strong>g formerly on <strong>the</strong> Tule<br />
Kiver <strong>in</strong> Tulare County, Cal. The remnant is now located<br />
on <strong>the</strong> Tule Rirer Reservation. The number<br />
enumerated <strong>in</strong> <strong>1910</strong> was 3, all <strong>in</strong> California.<br />
YUCHEAN STOCK.<br />
A tribe form<strong>in</strong>g by itself an <strong>in</strong>dependent l<strong>in</strong>guistic<br />
stock. Their habitat <strong>in</strong> <strong>the</strong> eighteenth century was<br />
on <strong>the</strong> middle Savannah River, Ga. In 1836 <strong>the</strong>y<br />
removed to Oklahoma where <strong>the</strong> majority live among<br />
<strong>the</strong> Creeks, a portion be<strong>in</strong>g settled among <strong>the</strong> Shaw-<br />
nee. The Yuchi, as enumerated <strong>in</strong> <strong>1910</strong>, numbered 78,<br />
of which 74 were <strong>in</strong> Oklahoma <strong>and</strong> 4 <strong>in</strong> <strong>the</strong> District of<br />
Columbia.<br />
YUKIAN STOCK.<br />
StocTc as a whole.—^A Californian stock occupyiag<br />
three small separate areas <strong>in</strong> Mendoc<strong>in</strong>o, Sonoma,<br />
Lake, <strong>and</strong> Napa Counties.<br />
The <strong>Indian</strong>s of <strong>the</strong> Yukian stock, as entmierated<br />
<strong>in</strong> <strong>1910</strong>, numbered 198. The tribes of this stock, for<br />
which members were reported, are as follows*<br />
Coast Yuki.<br />
Redwood.<br />
Wappo.<br />
Yuki.<br />
Coast Yuki.— ^The nor<strong>the</strong>rnmost of <strong>the</strong> three smaller<br />
subdivisions of this stock. They occupied orig<strong>in</strong>ally<br />
<strong>the</strong> nor<strong>the</strong>rn portion of <strong>the</strong> coast of Mendoc<strong>in</strong>o County,<br />
Cal., <strong>and</strong> <strong>the</strong> few survivors are ma<strong>in</strong>ly to be found <strong>in</strong><br />
<strong>the</strong> same region still. They are not reservation<br />
<strong>Indian</strong>s. The number enumerated <strong>in</strong> <strong>1910</strong> was 15, aU<br />
<strong>in</strong> California.<br />
Redwood (syn. Huchnom).—^A small subdivision of<br />
<strong>the</strong> Yuki <strong>in</strong> Mendoc<strong>in</strong>o County, Cal., now located on<br />
<strong>the</strong> Roimd Valley Reservation. They are commonly<br />
known by <strong>the</strong> name of Redwood. The number enumerated<br />
<strong>in</strong> <strong>1910</strong> was 15, all <strong>in</strong> California.<br />
Wappo.— ^The sou<strong>the</strong>rnmost of <strong>the</strong> three smaller<br />
subdivisions of this stock. Their habitat was <strong>in</strong><br />
nor<strong>the</strong>rn California <strong>in</strong> <strong>the</strong> vic<strong>in</strong>ity of <strong>the</strong> po<strong>in</strong>t where<br />
Lake, Sonoma, <strong>and</strong> Napa Counties jo<strong>in</strong>. The number<br />
enumerated <strong>in</strong> <strong>1910</strong> was 73, all <strong>in</strong> California.<br />
Yuki.—The largest group or tribe of this stock.<br />
Their habitat, s<strong>in</strong>ce earliest traditional times, has been<br />
<strong>in</strong> nor<strong>the</strong>rn Mendoc<strong>in</strong>o County, Cal., chiefly <strong>in</strong> <strong>and</strong><br />
about Round Valley. Skice <strong>the</strong> establishment of <strong>the</strong><br />
Round Valley Reservation <strong>in</strong> 1856, <strong>the</strong> majority of<br />
<strong>the</strong> Yuki have been located <strong>the</strong>re, although some few<br />
are scattered over <strong>the</strong> rema<strong>in</strong>der of <strong>the</strong>ir former habi-<br />
tat. The number enumerated <strong>in</strong> <strong>1910</strong> was 95, of<br />
which 91 were <strong>in</strong> California.<br />
YUMAN STOCK.<br />
Stock as a wlwle.— ^The area occupied by this stock <strong>in</strong><br />
<strong>the</strong> <strong>United</strong> <strong>States</strong> lies wholly <strong>in</strong> sou<strong>the</strong>astern Arizona<br />
<strong>and</strong> sou<strong>the</strong>rn California. It also extends over <strong>the</strong><br />
larger portion of Lower California.<br />
The <strong>Indian</strong>s of <strong>the</strong>Yuman stock <strong>in</strong> <strong>the</strong> <strong>United</strong> <strong>States</strong>,<br />
as enumerated <strong>in</strong> <strong>1910</strong>, numbered 4,279. The tribes<br />
of this stock, for which members were reported, are as<br />
follows:<br />
Cocopa.
110 INDIANS IN THE UNITED STATES.<br />
<strong>the</strong>y have been ma<strong>in</strong>ly located on <strong>the</strong> Colorado River<br />
Reservation <strong>and</strong> <strong>in</strong> <strong>the</strong> vic<strong>in</strong>ity of Fort Mohave <strong>in</strong><br />
Arizona. The Mohave, or Mohave-Apache so called,<br />
who for some years have been located at Camp Mc-<br />
Dowell <strong>and</strong> on <strong>the</strong> San Carlos Reservation <strong>in</strong> Arizona,<br />
are not true Mohave but Yavapai.<br />
The number enumerated <strong>in</strong> <strong>1910</strong> was 1,058, of which<br />
667 were <strong>in</strong> Arizona <strong>and</strong> 389 <strong>in</strong> California. Comparative<br />
figures for <strong>the</strong> whole tribe are ma<strong>in</strong>ly estimates<br />
previous to 1904, although for those on <strong>the</strong> Colorado<br />
River Reservation <strong>the</strong> figures may be used with care<br />
as far back as 1880. Estimated at <strong>the</strong> end of <strong>the</strong><br />
eighteenth century at about 3,000, <strong>the</strong>y probably<br />
mmibered nearly 2,000 <strong>in</strong> 1880. By 1890 <strong>the</strong>y had<br />
decreased to 1,717, <strong>and</strong> 15 years later to 1,364. It is<br />
clear, <strong>the</strong>refore, that <strong>the</strong> Mohave have been decreas<strong>in</strong>g<br />
steadily <strong>in</strong> numbers, <strong>and</strong> <strong>in</strong> <strong>the</strong> last 30 years have been<br />
reduced nearly one-half.<br />
Walapai (syn. Hualapai).—This tribe formerly occupied<br />
a large area <strong>in</strong> northwestern Arizona, extend<strong>in</strong>g<br />
from <strong>the</strong> great bend of <strong>the</strong> Colorado River eastward.<br />
The Walapai Reservation was set apart for <strong>the</strong>m <strong>in</strong><br />
1880, but comparatively few of <strong>the</strong> tribe live upon it.<br />
The number enumerated <strong>in</strong> <strong>1910</strong> was 501, of which<br />
496 were <strong>in</strong> Arizona. Figures for comparison are of<br />
little value back of 1890, at which time <strong>the</strong> tribe <strong>in</strong><br />
Arizona was estimated at 700. S<strong>in</strong>ce <strong>the</strong>n <strong>the</strong>re has<br />
been a marked decrease, as shown by <strong>the</strong> follow<strong>in</strong>g<br />
figures, taken from <strong>the</strong> reports of <strong>the</strong> Commissioner<br />
of <strong>Indian</strong> Affairs<br />
YEAE.
STOCKS AND TRIBES, BY SEX, AGE, AND BLOOD. Ill<br />
MISCELLANEOUS<br />
There were 1,644 persons returned on <strong>the</strong> special<br />
<strong>Indian</strong>, schedule for whom <strong>the</strong> stock or tribe was not<br />
reported, or for whom <strong>the</strong> return was too <strong>in</strong>def<strong>in</strong>ite to<br />
admit of classifi.cation. These returns were as follows:<br />
Sixteen were reported as hav<strong>in</strong>g come from <strong>Alaska</strong>,<br />
<strong>and</strong> were distributed among <strong>the</strong> states, as follows:<br />
Oregon, 7; Pennsylvania, 6; Wash<strong>in</strong>gton, 2; North<br />
Dakota, 1.<br />
One hundred <strong>and</strong> twenty-two were reported as<br />
hav<strong>in</strong>g come from California.<br />
Two hundred <strong>and</strong> twenty-eight were returned as<br />
"Cupeno," a name given to <strong>the</strong> former occupants of<br />
<strong>the</strong> village of Cupa or Gupa, now located ma<strong>in</strong>ly at<br />
Pala, San Diego County, Cal. They were <strong>in</strong> all<br />
probability Shoshonean (Luiseno), but ow<strong>in</strong>g to <strong>the</strong><br />
iaclusion of some Diegueno <strong>the</strong>y are not here <strong>in</strong>cluded<br />
under any stock.<br />
Fifteen were reported as "Digger," a name long<br />
used popularly for a large number of different <strong>Indian</strong><br />
tribes of California, Oregon, Nevada, <strong>and</strong> <strong>the</strong> whole<br />
of <strong>the</strong> <strong>in</strong>terior plateau region. The name has no<br />
value <strong>and</strong> is very confus<strong>in</strong>g. Special <strong>in</strong>structions<br />
were given to enumerators not to use <strong>the</strong> name,<br />
never<strong>the</strong>less 12 were reported from Pennsylvania,<br />
2 from Nevada, <strong>and</strong> 1 from Utah. It was not pos-<br />
sible to assign <strong>the</strong>m to any def<strong>in</strong>ite tribe or stock.<br />
Twenty-seven were returned simply as "Mission<br />
<strong>Indian</strong>s," a general term applied to all <strong>the</strong> coastal<br />
<strong>Indian</strong>s of sou<strong>the</strong>rn California <strong>and</strong> which gives no<br />
<strong>in</strong>dication of tribal or stock affiHation. They were<br />
ALGONQULAN STOCK.<br />
Three members of this stock (see p. 72) belong<strong>in</strong>g to<br />
<strong>the</strong> Delaware tribe were enumerated <strong>in</strong> <strong>Alaska</strong> <strong>in</strong><br />
<strong>1910</strong>—2 males, 1 of fuU blood <strong>and</strong> 1 of mixed blood,<br />
<strong>and</strong> 1 mixed-blood female.<br />
ATHAPASKAN STOCK.<br />
Stock as a whole.—One of <strong>the</strong> largest of <strong>the</strong> stocks<br />
<strong>in</strong> North America, tribes belong<strong>in</strong>g to it be<strong>in</strong>g found<br />
from near <strong>the</strong> Arctic coast to <strong>the</strong> Mexican boundary<br />
(see also p. 77). The area occupied by <strong>the</strong> nor<strong>the</strong>rn<br />
<strong>and</strong> territorially largest portion of <strong>the</strong> stock may be<br />
described <strong>in</strong> general as <strong>in</strong>clud<strong>in</strong>g <strong>the</strong> whole <strong>in</strong>terior of<br />
<strong>Alaska</strong> <strong>and</strong> nor<strong>the</strong>rn British Columbia, <strong>and</strong> <strong>the</strong> whole<br />
of <strong>the</strong> Canadian territories of Yukon, Mackenzie, <strong>and</strong><br />
Athabasca. The tribal divisions are somewhat un-<br />
certa<strong>in</strong>. The <strong>Indian</strong>s of <strong>the</strong> Athapaskan stock <strong>in</strong><br />
<strong>Alaska</strong>, as enumerated <strong>in</strong> <strong>1910</strong>, numbered 3,916.<br />
.<br />
INDIANS IN ALASKA.<br />
The<br />
tribes of this stock, for which members were reported<br />
<strong>in</strong> <strong>Alaska</strong>, are as follows:<br />
Ahtena. Kutch<strong>in</strong>. Tukkuthkutch<strong>in</strong>.<br />
Hankutch<strong>in</strong>. Nahane. Unakhotana.<br />
Kaiyuhkhotana. Nataitkutch<strong>in</strong>. Vuntakutcliiii.<br />
Knaiakhotana. Tenankutch<strong>in</strong>.<br />
probably Shoshonean or Yuman. They were mostly<br />
<strong>Indian</strong> children at school <strong>and</strong> were distributed among<br />
<strong>the</strong> states, as follows: Arizona, 10; Pennsylvania, 7;<br />
Kansas, 5; California, 3; Oregon, 2.<br />
Four <strong>Indian</strong>s were returned as "Oswego." It ia<br />
uncerta<strong>in</strong> what was meant by this name, but it is<br />
probable that <strong>the</strong>se were Osw<strong>in</strong>go or Chenango, <strong>the</strong><br />
name by which a portion of <strong>the</strong> Nanticoke of Maryl<strong>and</strong><br />
were known from <strong>the</strong>ir settl<strong>in</strong>g at Chenango,<br />
N. Y., <strong>in</strong> <strong>the</strong> middle of <strong>the</strong> eighteenth century. They<br />
later joiaed <strong>the</strong> Delaware <strong>and</strong> probably moved West<br />
with <strong>the</strong>m.<br />
One hundred <strong>and</strong> eighteen <strong>Indian</strong>s were returned<br />
as "Pueblo" without dist<strong>in</strong>ction as to <strong>the</strong> particular<br />
pueblo to which <strong>the</strong>y belonged, <strong>and</strong> it was <strong>the</strong>refore<br />
impossible to aflSliate <strong>the</strong>m with <strong>the</strong>ir proper stock.<br />
The majority were ei<strong>the</strong>r Tanoan or Keresan, <strong>and</strong> a<br />
few probably Hopi. Most of <strong>the</strong>m were pupils at<br />
<strong>Indian</strong> schools <strong>and</strong> were distributed among <strong>the</strong> states,<br />
as follows: 36 <strong>in</strong> Kansas, 29 <strong>in</strong> Pennsylvania, 20 <strong>in</strong><br />
Arizona, 17 <strong>in</strong> California, 7 <strong>in</strong> Oklahoma, 5 <strong>in</strong> New<br />
Mexico, <strong>and</strong> 1 each <strong>in</strong> Colorado, North Carol<strong>in</strong>a,<br />
Oregon, <strong>and</strong> South Dakota.<br />
Twelve <strong>Indian</strong>s were returned as "Redwood," a<br />
name used locally <strong>in</strong> California for two different<br />
tribes—<strong>the</strong> Huchnom, a YuMan tribe, <strong>and</strong> <strong>the</strong><br />
Whilkut, an Athapaskan tribe. They could not,<br />
<strong>the</strong>refore, be counted with ei<strong>the</strong>r. Of <strong>the</strong>m, 11 were<br />
<strong>in</strong> California <strong>and</strong> 1 <strong>in</strong> Kansas.<br />
In addition to <strong>the</strong> above, 1,102 <strong>Indian</strong>s were reported<br />
on <strong>the</strong> schedule with <strong>the</strong> stock <strong>and</strong> tribe<br />
simply as "unknown."<br />
Comparison with census figures for previous years is<br />
of doubtful value, as <strong>the</strong>se were, ow<strong>in</strong>g to <strong>the</strong> unex-<br />
plored character of <strong>the</strong> country, to a considerable<br />
extent estimates. The number reported at <strong>the</strong> census<br />
of 1890 was 3,520 <strong>and</strong> that of 1880 was 4,057.<br />
Ahtena.—^A tribe occupy<strong>in</strong>g <strong>the</strong> bas<strong>in</strong> of <strong>the</strong> Copper<br />
River. The number enumerated <strong>in</strong> <strong>1910</strong> was 297.<br />
The census of 1890 gave <strong>the</strong> number of this tribe as<br />
150, but at <strong>the</strong> census of 1880 it was reported as 250.<br />
HanTcutch<strong>in</strong>.—A tribe belong<strong>in</strong>g to <strong>the</strong> Kutch<strong>in</strong><br />
division of this stock, <strong>and</strong> occupy<strong>in</strong>g <strong>the</strong> region along<br />
<strong>the</strong> Yukon River for 50 or 75 nules above <strong>and</strong> below<br />
<strong>the</strong> <strong>in</strong>ternational boundary. The number enumerated<br />
<strong>in</strong> <strong>1910</strong> was 127. The census of 1880 reported 106,<br />
but it is probable that <strong>the</strong> returns were <strong>in</strong>complete.<br />
KaiyuhJchotana.—^A tribe occupy<strong>in</strong>g <strong>the</strong> region along<br />
<strong>the</strong> Yukon River between <strong>the</strong> Anvik <strong>and</strong> Koyukuk<br />
Rivers, <strong>and</strong> for some distance east <strong>and</strong> south toward<br />
<strong>the</strong> Kuskokwim River. The number enumerated <strong>in</strong><br />
<strong>1910</strong> was 160. Ow<strong>in</strong>g to some uncerta<strong>in</strong>ty <strong>in</strong> <strong>the</strong><br />
application of <strong>the</strong> name, comparison with <strong>the</strong> census<br />
figures of earlier years is of Uttle value. In 1890 <strong>the</strong><br />
number reported was 1,140. In 1880 <strong>the</strong> census figure<br />
was 1,222 <strong>and</strong> that of <strong>the</strong> Bureau of American Ethnology<br />
953.
112 INDIANS IN THE UNITED STATES.<br />
EnaialchotaTM.—A tribe occupy<strong>in</strong>g <strong>the</strong> whole of <strong>the</strong><br />
Kenai Pen<strong>in</strong>sula <strong>and</strong> <strong>the</strong> region around Cook Inlet<br />
from <strong>the</strong> head of <strong>the</strong> Knik <strong>and</strong> Shushitna Rivers southwest<br />
as far as Ihamna Lake. The number enumerated<br />
<strong>in</strong> <strong>1910</strong> was 697. In <strong>the</strong> early part of <strong>the</strong> n<strong>in</strong>eteenth<br />
centmy this tribe was estimated at 1,300 to 1,500.<br />
In 1880 <strong>the</strong> census showed 614 <strong>and</strong> <strong>in</strong> 1890, 839. For<br />
<strong>the</strong> latter year <strong>the</strong> Bureau of Ethnology reported 724.<br />
Kutch<strong>in</strong>.—^A group of tribes occupy<strong>in</strong>g a large part<br />
of <strong>the</strong> <strong>in</strong>terior of <strong>Alaska</strong> <strong>and</strong> extend<strong>in</strong>g far <strong>in</strong>to north-<br />
western Canada to <strong>the</strong> Mackenzie River. Their sub-<br />
divisions <strong>in</strong> <strong>Alaska</strong> comprise <strong>the</strong> Hankutch<strong>in</strong>, Natsitkutch<strong>in</strong>,<br />
Tenankutch<strong>in</strong>, Tukkuthkutch<strong>in</strong>, <strong>and</strong> Vun-<br />
takutch<strong>in</strong>.<br />
Under <strong>the</strong> head<strong>in</strong>g of Kutch<strong>in</strong> a considerable number<br />
of persons were enumerated without fur<strong>the</strong>r dis-<br />
t<strong>in</strong>ction of tribe, <strong>and</strong> <strong>the</strong>se are here grouped toge<strong>the</strong>r.<br />
The number enumerated as Kutch<strong>in</strong> <strong>in</strong> <strong>1910</strong> was 359.<br />
Similar figures for earHer censuses were 580 <strong>in</strong> 1890<br />
<strong>and</strong> 107 <strong>in</strong> 1880.<br />
Ndhane.—^A group composed of several distiact<br />
tribes liv<strong>in</strong>g <strong>in</strong> nor<strong>the</strong>rn British Columbia <strong>and</strong> <strong>the</strong><br />
Yukon Territory, Canada. Only 8 were enumerated<br />
<strong>in</strong> <strong>1910</strong>.<br />
NatsiikutcMn.—^A tribe belong<strong>in</strong>g to <strong>the</strong> Kutch<strong>in</strong><br />
subdivision of this stock, <strong>and</strong> liv<strong>in</strong>g north of <strong>the</strong> Porcup<strong>in</strong>e<br />
River, <strong>in</strong> nor<strong>the</strong>rn <strong>Alaska</strong>. The number<br />
enumerated <strong>in</strong> <strong>1910</strong> was 177. Comparison with <strong>the</strong><br />
census figures of earlier years is of somewhat doubtful<br />
value, ow<strong>in</strong>g to uncerta<strong>in</strong>ty as to what was <strong>in</strong>cluded<br />
under <strong>the</strong> term. As nearly as can be determiued<br />
<strong>the</strong>y numbered 312 <strong>in</strong> 1880.<br />
TenankutcJi<strong>in</strong>.—^A tribe whose habitat comprised<br />
<strong>the</strong> whole of <strong>the</strong> bas<strong>in</strong> of <strong>the</strong> Tanana River. The<br />
number enumerated <strong>in</strong> <strong>1910</strong> was 415. Accord<strong>in</strong>g to<br />
<strong>the</strong> census of 1890, <strong>the</strong>y numbered 309, <strong>and</strong> <strong>in</strong> 1880,<br />
738. In 1890 <strong>the</strong> Bureau of Ethnology reported 373.<br />
TuTckutkTcutch<strong>in</strong>.—^A Canadian tribe of this stock<br />
whose habitat lies between <strong>the</strong> upper Porcup<strong>in</strong>e <strong>and</strong><br />
Mackenzie Rivers, Yukon Territory. Only 6 were<br />
enumerated <strong>in</strong> <strong>1910</strong>.<br />
UndkJwfana.—^A tribe liv<strong>in</strong>g on <strong>the</strong> Yukon River<br />
between <strong>the</strong> mouths of <strong>the</strong> Tanana <strong>and</strong> Koyukuk<br />
Rivers, <strong>and</strong> also on <strong>the</strong> latter stream. The number<br />
enumerated <strong>in</strong> <strong>1910</strong> was 193. Census figures for 1890<br />
<strong>and</strong> 1880 were 502 <strong>and</strong> 596, respectively.<br />
VuntakutcMn.—^A tribe belongiag to <strong>the</strong> Kutch<strong>in</strong><br />
subdivision of this stock, <strong>and</strong> occupy<strong>in</strong>g <strong>the</strong> region<br />
north from <strong>the</strong> Porcup<strong>in</strong>e River toward <strong>the</strong> Arctic<br />
coast. Only 5 persons were enumerated <strong>in</strong> <strong>1910</strong> as<br />
members of this tribe, 2 males <strong>and</strong> 3 females.<br />
Tribe not reported.— ^Under this head<strong>in</strong>g are <strong>in</strong>cluded<br />
all those <strong>Indian</strong>s who were enumerated merely as<br />
"Athapaskan" without fur<strong>the</strong>r detail as to tribe, toge<strong>the</strong>r<br />
with a small number of o<strong>the</strong>rs, for whom no<br />
<strong>in</strong>formation whatever was given except "<strong>Indian</strong>," but<br />
who from o<strong>the</strong>r evidence, almost certa<strong>in</strong>ly belonged<br />
to this stock.<br />
The Athapaskans <strong>in</strong> <strong>Alaska</strong> of imcerta<strong>in</strong> or unknown<br />
tribal affiliation numbered 1,472 <strong>in</strong> <strong>1910</strong>. On accoimt<br />
of <strong>the</strong> large number thus returned, <strong>the</strong>y are shown<br />
by sex <strong>and</strong> age <strong>in</strong> Table 52 (p. 154).<br />
ESKIMAUAN STOCK.<br />
Stock as a whole.—This stock is more widely distributed<br />
than any o<strong>the</strong>r <strong>in</strong> North America, its members<br />
extend<strong>in</strong>g from near Mount St. Elias, <strong>in</strong> sou<strong>the</strong>rn<br />
<strong>Alaska</strong>, a,long <strong>the</strong> entire nor<strong>the</strong>rn littoral of <strong>the</strong> cont<strong>in</strong>ent<br />
to <strong>the</strong> east coast of Greenl<strong>and</strong>, <strong>and</strong> formerly south<br />
as far as <strong>the</strong> Gulf of St. Lawrence. A small group is<br />
also foTuid <strong>in</strong> <strong>the</strong> vic<strong>in</strong>ity of East Cape, Siberia. They<br />
nowhere extend far <strong>in</strong>to <strong>the</strong> <strong>in</strong>terior. The total <strong>population</strong><br />
of <strong>the</strong> Eskimauan stock <strong>in</strong> <strong>Alaska</strong>, as enumer-<br />
ated <strong>in</strong> <strong>1910</strong>, is 14,087. The number reported by <strong>the</strong><br />
census for this stock <strong>in</strong> 1890 was 15,550, <strong>and</strong> <strong>in</strong> 1880,<br />
20,245.<br />
Real tribal groups <strong>in</strong> <strong>the</strong> more exact sense of <strong>the</strong><br />
term are not found among <strong>the</strong> Eskimo, <strong>the</strong> subdivi-<br />
sions be<strong>in</strong>g generally more geographical than tribal,<br />
<strong>the</strong> names given relat<strong>in</strong>g often to a s<strong>in</strong>gle village only.<br />
The tribes or groups of <strong>the</strong> Eskimauan stock, for which<br />
members were reported, are as follows:<br />
Aleut.
STOCKS AND TRIBES, BY SEX, AGE, AND BLOOD. 113<br />
river as far as Razbo<strong>in</strong>ski. The number enumerated<br />
<strong>in</strong> <strong>1910</strong> was 326. This tribe showed a <strong>population</strong> of<br />
621 at <strong>the</strong> census of 1890, prior to which year <strong>the</strong>y<br />
do not appear to have been enumerated separately.<br />
Ikogmiut.— ^The territory occupied by <strong>the</strong> Ikogmiut<br />
is generally imderstood to <strong>in</strong>clude <strong>the</strong> region along<br />
both banks of <strong>the</strong> Yukon River from its mouth nearly<br />
as far up as Anvik. As thus used, it comprises several<br />
smaller tribes or subdivisions <strong>in</strong>clud<strong>in</strong>g part of <strong>the</strong><br />
Chnagmiut. It is sometimes used <strong>in</strong> a more narrow<br />
sense to apply only to <strong>the</strong> <strong>in</strong>habitants of <strong>the</strong> village<br />
of Ikogmiut. The term has been used here <strong>in</strong> its<br />
wider application. The number enumerated <strong>in</strong> <strong>1910</strong><br />
was 782. The census of 1880 showed a <strong>population</strong> of<br />
2,696, while that of 1890 showed 172 for <strong>the</strong> village of<br />
Ikogmiut only.<br />
Imaklimiut.^—A tribe liv<strong>in</strong>g on Big Diomede Isl<strong>and</strong><br />
<strong>in</strong> Ber<strong>in</strong>g Strait. Two full-bloods were enimaerated<br />
under this name—1 male <strong>and</strong> 1 female.<br />
Iprackmiut.— ^The village to which this name refers<br />
has not been located exactly. It lies, however, with<strong>in</strong><br />
Malemiut territory probably, <strong>and</strong> is situated, so far as<br />
can be ascerta<strong>in</strong>ed, on <strong>the</strong> north shore of Seward<br />
Pen<strong>in</strong>sula, eastward of Shishmaref Inlet. Four full-<br />
bloods were enumerated under this name—3 males<br />
<strong>and</strong> 1 female.<br />
Ecdaligmiut.— ^A tribe occupy<strong>in</strong>g a large portion<br />
of <strong>the</strong> Yukon delta, <strong>the</strong>ir territory extend<strong>in</strong>g from a<br />
little north of Kuskokwim Bay to Cape Romanzof.<br />
The Kaialigmiut, as enimaerated <strong>in</strong> <strong>1910</strong>, numbered 192.<br />
EakuakaTmut.—^A tribe or perhaps a subdivision of<br />
<strong>the</strong> Nushagagmiut, liv<strong>in</strong>g on <strong>the</strong> Nushagak River. The<br />
number enumerated <strong>in</strong> <strong>1910</strong> was 22. Previous census<br />
figures were 45 <strong>in</strong> 1890 <strong>and</strong> 104 <strong>in</strong> 1880.<br />
Eangmaligmiut.—A name of somewhat uncerta<strong>in</strong><br />
application used for <strong>the</strong> groups of Eskimo liv<strong>in</strong>g on<br />
<strong>the</strong> Arctic coast between Po<strong>in</strong>t Hope <strong>and</strong> <strong>the</strong> mouth<br />
of <strong>the</strong> Mackenzie River. One full-blood woman was<br />
enumerated under this name <strong>in</strong> <strong>1910</strong>.<br />
Eaviagmivi.— ^A tribe whose proper habitat is<br />
given as <strong>the</strong> nor<strong>the</strong>rn shore of Norton Sound, from<br />
about <strong>the</strong> middle of <strong>the</strong> western shore of Norton Bay<br />
to about Cape Douglas, <strong>and</strong> extend<strong>in</strong>g <strong>in</strong>l<strong>and</strong> to <strong>the</strong><br />
watershed divid<strong>in</strong>g <strong>the</strong> streams flow<strong>in</strong>g <strong>in</strong>to Norton<br />
Sound from those flow<strong>in</strong>g <strong>in</strong>to Kotzebue Sound.<br />
Dur<strong>in</strong>g <strong>the</strong> last decade <strong>the</strong>y have been considerably<br />
scattered. The number emmierated <strong>in</strong> <strong>1910</strong> was 238,<br />
as compared with 427 <strong>in</strong> 1890 <strong>and</strong> 858 <strong>in</strong> 1880.<br />
Kehchabukmiut.—A small group of Eskimo, of whose<br />
village, Kekchabuk, <strong>the</strong> precise location is uncerta<strong>in</strong>.<br />
It is probably <strong>in</strong> <strong>the</strong> Kuskokwim delta region or on <strong>the</strong><br />
western side of <strong>the</strong> lower river. If this location is correct<br />
<strong>the</strong>y would form a part of <strong>the</strong> Kuskwogmiut. The<br />
number enumerated <strong>in</strong> <strong>1910</strong> was 32.<br />
K<strong>in</strong>ugumiut.—A tribe whose proper habitat seems<br />
to have been <strong>in</strong> <strong>the</strong> western part of Seward Pen<strong>in</strong>sula,<br />
from Sliishmaref Inlet to Port Clarence. The num-<br />
67090°—15 8<br />
ber enumerated <strong>in</strong> <strong>1910</strong> was 594, as compared with<br />
652 <strong>in</strong> 1890 <strong>and</strong> 500 <strong>in</strong> 1880. In 1880 <strong>the</strong> Bureau of<br />
Ethnology reported 400.<br />
Eopagmiut.—^A tribe whose habitat hes on <strong>the</strong><br />
Arctic coast at <strong>the</strong> mouth <strong>and</strong> along <strong>the</strong> lower course<br />
of <strong>the</strong> Mackenzie River, Canada. The niunber enumerated<br />
<strong>in</strong> <strong>1910</strong> was 9.<br />
Kowagmiut.—^A tribe liv<strong>in</strong>g on <strong>the</strong> Kobuk River,<br />
a stream flow<strong>in</strong>g <strong>in</strong>to Kotzebue Sound. The number<br />
enumerated <strong>in</strong> <strong>1910</strong> was 561. The census of 1890<br />
gave a <strong>population</strong> of only 81 for this tribe. The fact<br />
that it is frequently confused with <strong>the</strong> Selawigmiut<br />
<strong>and</strong> Nimatogmiut probably accoimts <strong>in</strong> part for <strong>the</strong><br />
large difference <strong>in</strong> ntmibers.<br />
Kukfaurungmiut.—^A tribe liv<strong>in</strong>g on <strong>the</strong> Arctic coast<br />
near Po<strong>in</strong>t Lay. The number enumerated <strong>in</strong> <strong>1910</strong><br />
was 6. Previous census figures were 52 <strong>in</strong> 1890 <strong>and</strong><br />
30 <strong>in</strong> 1880.<br />
Kunmiut.—^A tribe Hv<strong>in</strong>g on <strong>the</strong> Kok River, near<br />
Wa<strong>in</strong>wright Inlet, on <strong>the</strong> Arctic coast, of which <strong>the</strong><br />
number enumerated <strong>in</strong> <strong>1910</strong> was 77.<br />
Eusetr<strong>in</strong>miut.—^A tribe occupy<strong>in</strong>g <strong>the</strong> bas<strong>in</strong> of <strong>the</strong><br />
Kuzitr<strong>in</strong> River, Seward Pen<strong>in</strong>sula. They probably<br />
form a portion of <strong>the</strong> Kaviagmiut, but may be a<br />
subdivision of <strong>the</strong> K<strong>in</strong>ugumiut. Because of this<br />
xmcerta<strong>in</strong>ty, <strong>the</strong>y are here treated separately. The<br />
munber enumerated <strong>in</strong> <strong>1910</strong> was 133.<br />
Euskovakmiut.—^A tribe (or village) on <strong>the</strong> right<br />
bank of <strong>the</strong> Kuskokwim River, near its mouth, form<strong>in</strong>g<br />
a subdivision of <strong>the</strong> Kuskwogmiut. The number<br />
enumerated <strong>in</strong> <strong>1910</strong> was 370.<br />
Euskovnk.—^A village whose precise position is<br />
uncerta<strong>in</strong>. It is probably on <strong>the</strong> lower Kuskokwim<br />
River, <strong>and</strong> if so, <strong>the</strong> <strong>in</strong>habitants would belong to <strong>the</strong><br />
Kuskwogmiut. The number emmierated <strong>in</strong> <strong>1910</strong><br />
was 37.<br />
Euskwogmiut.-r-A. tribe occupy<strong>in</strong>g <strong>the</strong> banks of <strong>the</strong><br />
Kuskokwim River, from Koknakof to <strong>the</strong> south <strong>and</strong><br />
<strong>the</strong> shores of Kuskokwim Bay. The Kuskovakmiut<br />
<strong>and</strong> probably <strong>the</strong> Kuskowik are subdivisions of <strong>the</strong><br />
tribe. The nimiber enumerated <strong>in</strong> <strong>1910</strong> was 1,480.<br />
Includ<strong>in</strong>g <strong>the</strong> Kuskovakmiut <strong>and</strong> <strong>the</strong> Kuskowik <strong>the</strong><br />
number <strong>in</strong> <strong>1910</strong> was 1,887, as compared with 3,294 at<br />
<strong>the</strong> census of 1890 <strong>and</strong> 3,522 <strong>in</strong> 1880.<br />
Magemiut.—^A tribe occupy<strong>in</strong>g <strong>the</strong> coast from Cape<br />
Romanzof nearly to <strong>the</strong> western mouth of <strong>the</strong> Yukon,<br />
<strong>and</strong> extend<strong>in</strong>g <strong>in</strong>l<strong>and</strong> for a considerable distance.<br />
The Nunochogmiut are a subdivision of <strong>the</strong> Mage-<br />
miut. The number enumerated <strong>in</strong> <strong>1910</strong> was 376.<br />
In 1890 <strong>the</strong>y were reported by <strong>the</strong> census as 2,147,<br />
but were not enumerated separately <strong>in</strong> 1880.<br />
Malemiut.—A tribe occupy<strong>in</strong>g <strong>the</strong> eastern portion<br />
of Seward Pen<strong>in</strong>sula between Kotzebue Sound <strong>and</strong><br />
Norton Bay. On <strong>the</strong> former <strong>the</strong>y extend as far west<br />
as Shishmaref Inlet; on <strong>the</strong> latter as far as Cape<br />
Denbigh. The number enumerated <strong>in</strong> <strong>1910</strong> was 563,<br />
as compared with 630 <strong>in</strong> 1890 <strong>and</strong> 1,101 <strong>in</strong> 1880.
114 INDIANS IN THE UNITED STATES.<br />
Naparktoo.—Under this name a few persons were<br />
enumerated <strong>in</strong> <strong>the</strong> vic<strong>in</strong>ity of Po<strong>in</strong>t Barrow. The<br />
name is probably that of a village, but it has not been<br />
possible to locate it. The people are almost certa<strong>in</strong>ly<br />
Eskimo. The Naparktoo, as enumerated <strong>in</strong> <strong>1910</strong>,<br />
numbered 9.<br />
Neechuktamiut.—A tribe or village located apparently<br />
on M<strong>in</strong>iatulik Kiver, flow<strong>in</strong>g <strong>in</strong>to Norton Bay.<br />
It is uncerta<strong>in</strong> whe<strong>the</strong>r <strong>the</strong>se Eskimo should be con-<br />
sidered as a subdivision of <strong>the</strong> Kaviagmiut or <strong>the</strong><br />
Malemiut. The number enumerated <strong>in</strong> <strong>1910</strong> was 25.<br />
Nunatogmiut.—A tribe occupy<strong>in</strong>g <strong>the</strong> region about<br />
<strong>the</strong> Noatak River, <strong>and</strong> extend<strong>in</strong>g <strong>in</strong>l<strong>and</strong> a considerable<br />
distance. The appUcation of <strong>the</strong> name has been somewhat<br />
variable. The number enumerated <strong>in</strong> <strong>1910</strong> was<br />
285. Ow<strong>in</strong>g to <strong>the</strong> uncerta<strong>in</strong>ty <strong>in</strong> <strong>the</strong> application of<br />
<strong>the</strong> name, comparison with earlier censuses is of doubt-<br />
ful value, only 42 be<strong>in</strong>g reported <strong>in</strong> 1890 <strong>and</strong> 650 <strong>in</strong><br />
1880.<br />
Nunivagmiut.—^A tribe liv<strong>in</strong>g on Nunivak Isl<strong>and</strong><br />
<strong>and</strong> a small area about Cape Vancouver <strong>in</strong> <strong>the</strong> Yukon-<br />
Kuskokwim delta region. The number enumerated <strong>in</strong><br />
<strong>1910</strong> was 301, as aga<strong>in</strong>st 702 <strong>in</strong> 1890 <strong>and</strong> 408 <strong>in</strong> 1880.<br />
NuTiochogmiut.—A village or tribe <strong>in</strong> <strong>the</strong> Yukon<br />
delta, <strong>in</strong>l<strong>and</strong> from Baird Inlet. They form a subdivision<br />
of <strong>the</strong> Magemiut. The number enumerated<br />
<strong>in</strong> <strong>1910</strong> was 158, as compared with 135 <strong>in</strong> 1890 <strong>and</strong> 40<br />
<strong>in</strong> 1880.<br />
NushagagTniut.— ^A tribe liv<strong>in</strong>g <strong>in</strong> <strong>the</strong> vic<strong>in</strong>ity of<br />
Nushagak Bay, of which <strong>the</strong> number enumerated <strong>in</strong><br />
<strong>1910</strong> was 31. Ow<strong>in</strong>g to uncerta<strong>in</strong>ty as to what is<br />
<strong>in</strong>cluded under <strong>the</strong> name, comparison with earlier<br />
censuses is of little value, 193 be<strong>in</strong>g reported <strong>in</strong> 1890<br />
<strong>and</strong> 817 <strong>in</strong> 1880.<br />
Nuvmlcmiut.—A tribe liv<strong>in</strong>g <strong>in</strong> <strong>the</strong> vic<strong>in</strong>ity of Po<strong>in</strong>t<br />
Barrow, on <strong>the</strong> Arctic coast. The number enumerated<br />
<strong>in</strong> <strong>1910</strong> was 81, as aga<strong>in</strong>st 143 <strong>in</strong> 1890. They were not<br />
reported separately at <strong>the</strong> census of 1880.<br />
Pitulcmiut.—A small group of Eskimo enumerated<br />
on Kotzebue Sound, whose precise habitat <strong>and</strong> affiha^<br />
tions are unknown. Four full-blood Pitukmiut were<br />
enumerated <strong>in</strong> <strong>1910</strong>—3 males <strong>and</strong> 1 female.<br />
Polazramiut.—A small tribe, probably a subdivision<br />
of <strong>the</strong> Eanugumiut, enumerated near Cape Pr<strong>in</strong>ce of<br />
Wales, Seward Pen<strong>in</strong>sula. The number enumerated<br />
<strong>in</strong> <strong>1910</strong> was 14.<br />
Sdawigmiut.—^A tribe liv<strong>in</strong>g on <strong>and</strong> near Selawik<br />
Lake, near Kotzebue Sound, of which <strong>the</strong> number<br />
enumerated <strong>in</strong> <strong>1910</strong> was 258.<br />
Sidarumiut.—^A tribe or village located on <strong>the</strong><br />
Arctic coast <strong>in</strong> <strong>the</strong> vic<strong>in</strong>ity of Po<strong>in</strong>t Belcher. Five<br />
Sidarumiut were enumerated <strong>in</strong> <strong>1910</strong>—2 fuU-blood<br />
males, 2 fuU-blood females, <strong>and</strong> 1 mixed white <strong>and</strong><br />
<strong>Indian</strong> male.<br />
Tikeramiut.—A tribe liv<strong>in</strong>g on <strong>the</strong> northwestern<br />
coast <strong>in</strong> <strong>the</strong> vic<strong>in</strong>ity of Po<strong>in</strong>t Hope. The number<br />
enumerated <strong>in</strong> <strong>1910</strong> was 320, as compared with 295 <strong>in</strong><br />
1890. In 1880 <strong>the</strong>y were not enumerated separately.<br />
Togiagmiut.—A tribe liv<strong>in</strong>g <strong>in</strong> <strong>the</strong> vic<strong>in</strong>ity of<br />
Togiak Lake <strong>and</strong> Bay (Bristol Bay). The number<br />
emunerated <strong>in</strong> <strong>1910</strong> was 93, as aga<strong>in</strong>st 190 <strong>in</strong> 1890.<br />
They were not enumerated separately <strong>in</strong> 1880.<br />
Wdvokmiwt.—^A subdivision of <strong>the</strong> Kaviagmiut, liv<strong>in</strong>g<br />
on K<strong>in</strong>g Isl<strong>and</strong>, Ber<strong>in</strong>g Strait. The number<br />
enumerated <strong>in</strong> <strong>1910</strong> was 140, as compared with 200<br />
at <strong>the</strong> census of 1890.<br />
TJnaligmiut.—A tribe occupy<strong>in</strong>g <strong>the</strong> shores of<br />
Norton Sound from a little south of Cape Denbigh<br />
nearly to <strong>the</strong> mouth of <strong>the</strong> Yukon. The number<br />
enumerated <strong>in</strong> <strong>1910</strong> was 441. Earher census figures<br />
were 119 <strong>in</strong> 1890 <strong>and</strong> 418 <strong>in</strong> 1880.<br />
Uikiav<strong>in</strong>miut.—A tribe liv<strong>in</strong>g on <strong>the</strong> Arctic coast at<br />
<strong>and</strong> to <strong>the</strong> west of Cape Smith. The number enumerated<br />
<strong>in</strong> <strong>1910</strong> was 123, as aga<strong>in</strong>st 193 reported <strong>in</strong><br />
1890.<br />
TJtukamiut (syn. Otookogmiut).—A tribe liv<strong>in</strong>g on<br />
<strong>the</strong> Arctic coast between Po<strong>in</strong>t Hope <strong>and</strong> Wa<strong>in</strong>right<br />
Inlet. The number enumerated <strong>in</strong> <strong>1910</strong> was 127.<br />
Comparison with earlier years is limited to 1890, at<br />
which census 48 were reported. The large <strong>in</strong>crease<br />
thus shown is probably due partly to uncerta<strong>in</strong>ty as<br />
to tribal limits, <strong>and</strong> partly to <strong>the</strong> fact that, be<strong>in</strong>g<br />
more nomadic than many of <strong>the</strong> tribes <strong>in</strong> <strong>the</strong> vic<strong>in</strong>ity,<br />
a considerable number were not enumerated <strong>in</strong> 1890.<br />
Yuit.—A group of Eskimo occupy<strong>in</strong>g St. Lawrence<br />
Isl<strong>and</strong> <strong>and</strong> <strong>the</strong> region about East Cape, Siberia. The<br />
number enumerated <strong>in</strong> <strong>1910</strong> was 292, as compared<br />
with 267 <strong>in</strong> 1890 <strong>and</strong> 500 (as estimated) <strong>in</strong> 1880.<br />
Sou<strong>the</strong>rn Eskimo.—By an unfortunate error on <strong>the</strong><br />
part of <strong>the</strong> enumerators, <strong>the</strong> naajority of <strong>the</strong> Eskimo<br />
of sou<strong>the</strong>rn <strong>Alaska</strong>, from <strong>the</strong> Shtunag<strong>in</strong> Isl<strong>and</strong>s to<br />
Controller Bay, toge<strong>the</strong>r with some on <strong>the</strong> shores of<br />
Bristol Bay, were enumerated wrongly as Aleut. The<br />
tribal groups so confused were ma<strong>in</strong>ly <strong>the</strong> Kaniagmiut,<br />
Chugachigmiut, <strong>and</strong> Ugalakmiut, <strong>and</strong> to a lesser degree<br />
<strong>the</strong> Agiemiut <strong>and</strong> perhaps a few of <strong>the</strong> Nushagagmiut.<br />
A portion of <strong>the</strong> Agiemiut <strong>and</strong> Kaniagmiut were,<br />
however, correctly enumerated under <strong>the</strong>ir proper<br />
names. As it has been impossible to separate this<br />
mixed body of Eskimo <strong>in</strong>to its constituent tribal or<br />
geographic divisions, <strong>the</strong>y have been treated as a<br />
general group under <strong>the</strong> above head<strong>in</strong>g, which thus<br />
<strong>in</strong>cludes all Eskimo south <strong>and</strong> east of <strong>the</strong> head of<br />
Bristol Bay. The number enumerated <strong>in</strong> <strong>1910</strong> was<br />
3,650. No very satisfactory comparison with <strong>the</strong><br />
census figures for earlier years can be made. The<br />
comb<strong>in</strong>ed <strong>population</strong> of <strong>the</strong> Agiemiut, Chugachigmiut,<br />
Kaniagmiut, <strong>and</strong> Ugalakmiut was 3,142 <strong>in</strong> 1890 <strong>and</strong><br />
3,489 <strong>in</strong> 1880.<br />
Tribe not reported.— ^Under this general head<strong>in</strong>g are<br />
<strong>in</strong>cluded all persons enumerated merely as " Eskimo "<br />
without fur<strong>the</strong>r dist<strong>in</strong>ction of tribe. The Eskimo<br />
of unknown affiliation enumerated <strong>in</strong> <strong>Alaska</strong> <strong>in</strong> <strong>1910</strong><br />
were 474, <strong>and</strong> on account of this comparatively large<br />
number, <strong>the</strong>y are shown separately by sex <strong>and</strong> age <strong>in</strong><br />
Table 52 (p. 156).
STOCKS AND TRIBES, BY SEX, AGE, AND BLOOD. 115<br />
HAEDAN STOCK (syn. Skittagetan)<br />
A tribe occupy<strong>in</strong>g <strong>the</strong> Queen Charlotte Isl<strong>and</strong>s <strong>and</strong><br />
<strong>the</strong> sou<strong>the</strong>rn portion of Pr<strong>in</strong>ce of Wales Isl<strong>and</strong> <strong>in</strong><br />
British Columbia <strong>and</strong> <strong>Alaska</strong>, <strong>and</strong> form<strong>in</strong>g an <strong>in</strong>dependent<br />
l<strong>in</strong>guistic stock. The tribe formerly lived<br />
wholly <strong>in</strong> what is now Canadian territory, those at<br />
present occupy<strong>in</strong>g part of Pr<strong>in</strong>ce of Wales Isl<strong>and</strong> hav<strong>in</strong>g<br />
taken possession of this region some time probably <strong>in</strong><br />
<strong>the</strong> early part of <strong>the</strong> eighteenth century. A few immigrant<br />
members of this tribe are also found <strong>in</strong> conti-<br />
nental <strong>United</strong> <strong>States</strong> (see p. 82).<br />
The Haida <strong>in</strong> <strong>Alaska</strong>, as enumerated <strong>in</strong> <strong>1910</strong>, were<br />
530, as compared with 415 <strong>in</strong> 1890 <strong>and</strong> 795 <strong>in</strong> 1880.<br />
About 1870 <strong>the</strong>y were estimated at 600.<br />
TLiNGiT STOCK (syn. Koluschan).<br />
Stock as a whole.—A coastal stock of sou<strong>the</strong>rn<br />
<strong>Alaska</strong>, occupy<strong>in</strong>g <strong>the</strong> coast <strong>and</strong> adjacent isl<strong>and</strong>s<br />
from Portl<strong>and</strong> Canal to Controller Bay. A few immigrant<br />
members of this stock are also found <strong>in</strong> con-<br />
t<strong>in</strong>ental <strong>United</strong> <strong>States</strong> (see p. 106).<br />
The <strong>Indian</strong>s of <strong>the</strong> THngit stock, as enumerated <strong>in</strong><br />
<strong>1910</strong> <strong>in</strong> <strong>Alaska</strong>, numbered 4,426. The number reported<br />
for this stock <strong>in</strong> 1890 was 4,583 <strong>and</strong> <strong>in</strong> 1880,<br />
6,763.<br />
The tribes of this stock, for which members were<br />
reported, are as follows:<br />
Auk.<br />
.
116 INDIANS IN THE UNITED STATES.<br />
NUMBER OF INDIANS REPORTED ON SPECIAL INDIAN SCHEDULE, CLASSIFIED BY LINGUISTIC STOCKS AXD<br />
TRIBES AND BY SEX AND PURITY O^ BLOOD: <strong>1910</strong>.<br />
Table 50
STOCKS AND TRIBES, BY SEX, AGE, AND BLOOD. 117<br />
NUMBER OP INDIANS REPORTED ON SPECIAL INDIAN SCHEDULE, CLASSIFIED BY LINGUISTIC STOCKS AND<br />
TRIBES AND BY SEX AND PURITY OP BLOOD: <strong>1910</strong>—Cont<strong>in</strong>ued.<br />
Table 50—Cont<strong>in</strong>ued.
118 INDIANS IN THE UNITED STATES.<br />
NUMBER OF INDIANS REPORTED ON SPECIAL INDIAN SCHEDULE, CLASSIFIED BY LINGUISTIC STOCKS AND<br />
TRIBES AND BY SEX AND PURITY OF BLOOD: <strong>1910</strong>—Cont<strong>in</strong>ued<br />
Table 50—Cont<strong>in</strong>ued.<br />
STOCK AND TEIBE.<br />
Kebesan stock<br />
Total<br />
number.<br />
Full<br />
blood.<br />
Mixed<br />
blood.<br />
Blood<br />
not<br />
reported.<br />
INDIANS KEPOKTED ON SPECIAL SCHEDULE: <strong>1910</strong>.<br />
Total number.<br />
Male. Female.<br />
tTNITBD STATES—Cont<strong>in</strong>ued.<br />
Full blood.<br />
Male. Female.<br />
Distribution by sex.<br />
Total.<br />
Mixed blood.<br />
Male. Female.<br />
White <strong>and</strong><br />
<strong>Indian</strong>.<br />
Male. Female.<br />
Blood<br />
not reported.<br />
Male. Female.
STOCKS AND TRIBES, BY SEX, AGE, AND BLOOD. 119<br />
NUMBER OF INDIANS REPORTED ON SPECIAL INDIAN SCHEDULE, CLASSIFIED BY LINGUISTIC STOCKS AND<br />
TRIBES AND BY SEX AND PURITY OF BLOOD: <strong>1910</strong>—Cont<strong>in</strong>ued.<br />
Table SO—Cont<strong>in</strong>ued.
120 INDIANS IN THE UNITED STATES.<br />
NUMBER OF INDIANS REPORTED ON SPECIAL INDIAN SCHEDULE, CLASSIFIED BY LINGUISTIC STOCKS AND<br />
TRIBES AND BY SEX AND PURITY OP BLOOD: <strong>1910</strong>—Cont<strong>in</strong>ued.<br />
Table 50—Cont<strong>in</strong>ued.
STOCKS AND TRIBES, BY SEX, AGE, AND BLOOD. 121<br />
NTMBER OF INDIANS REPORTED ON SPECIAL INDIAN SCHEDULE, CLASSIFIED BY LINGUISTIC STOCKS AND<br />
TRIBES AND BY SEX AND PURITY OF BLOOD: <strong>1910</strong>—Cont<strong>in</strong>ued.<br />
Table 50—Cont<strong>in</strong>ued.
122 INDIANS IN THE UNITED STATES.<br />
NUMBER OF INDIANS REPORTED ON SPECIAL INDIAN SCHEDULE, CLASSIFIED BY LINGUISTIC STOCKS AND<br />
TRIBES AND BY SEX AND PURITY OF BLOOD: <strong>1910</strong>—Cont<strong>in</strong>ued.<br />
Table 50—Cont<strong>in</strong>ued.
STOCKS AND TRIBES, BY SEX, AGE, AND BLOOD. 123<br />
INDIANS IN EACH STOCK AND TRIBE IN THE UNITED STATES, CLASSIFIED ACCORDING TO SEX AND AGE<br />
PERIODS, BY MIXTURE OF BLOOD: <strong>1910</strong>.<br />
Table 61<br />
TBIBE AND MIXTORE OP<br />
BLOOD.<br />
Both
124 INDIANS IN THE UNITED STATES.<br />
INDIANS IN EACH STOCK AND TRIBE IN THE UNITED STATES, CLASSIFIED ACCORDING TO SEX AND AGE<br />
PERIODS, BY MIXTURE OF BLOOD: <strong>1910</strong>—Cont<strong>in</strong>ued.<br />
Table 51—Cont<strong>in</strong>ued.
STOCKS AND TRIBES, BY SEX, AGE, AND BLOOD. 125<br />
INDIANS IN EACH STOCK AND TRIBE IN THE UNITED STATES, CLASSIFIED ACCORDING TO SEX AND AGE<br />
PERIODS, BY MIXTURE OF BLOOD: <strong>1910</strong>—Cont<strong>in</strong>ued.<br />
fable 5 1—Cont<strong>in</strong>ued.
126 INDIANS IN THE UNITED STATES.<br />
INDIANS IN EACH STOCK AND TRIBE IN THE UNITED STATES, CLASSIFIED ACCORDING TO SEX AND AGE<br />
PERIODS, BY MIXTURE OF BLOOD: <strong>1910</strong>—Cont<strong>in</strong>ued.<br />
Table 61—Cont<strong>in</strong>ued.<br />
TRIBE AND MIXTUllE OF<br />
BLOOD.<br />
Naeraganset<br />
Both<br />
sexes.<br />
Total.i<br />
Under<br />
20<br />
yrs.<br />
61<br />
yrs.<br />
<strong>and</strong><br />
over.<br />
Total.!<br />
AIiOONQTJIAN STOCK—Cont<strong>in</strong>ued.<br />
Under<br />
20<br />
yrs.<br />
20<br />
to<br />
60<br />
yrs.<br />
61<br />
yrs.<br />
<strong>and</strong><br />
over.
STOCKS AND TRIBES, BY SEX, AGE, AND BLOOD. 127<br />
INDIANS IN EACH STOCK AND TRIBE IN THE UNITED STATES, CLASSIFIED ACCORDING TO SEX AND AGE<br />
PERIODS, BY MIXTURE OF BLOOD: <strong>1910</strong>—Cont<strong>in</strong>ued.<br />
Table 5 1—Caat<strong>in</strong>ued.<br />
TEIBE AKD MIXTUKE OF<br />
BLOOD.<br />
Powhatan<br />
Both<br />
sexes.<br />
Total.!<br />
Under<br />
20<br />
yrs.<br />
51<br />
yrs.<br />
<strong>and</strong><br />
over.<br />
Total.!<br />
ALGONQXTIAN' STOCK—Cont<strong>in</strong>ued.<br />
Under<br />
20<br />
yrs.<br />
51<br />
yrs.<br />
<strong>and</strong><br />
over.<br />
TEIBE AND MIXTITKE OF<br />
BLOOD.<br />
Both<br />
sexes.<br />
Total.i<br />
Under<br />
yrs.<br />
51<br />
yrs.<br />
<strong>and</strong><br />
over.<br />
Total.i<br />
Under<br />
20<br />
yrs.<br />
51<br />
yrs.<br />
<strong>and</strong><br />
over.
128 INDIANS IN THE UNITED STATES.<br />
INDIANS IN EACH STOCK AND TRIBE IN THE UNITED STATES, CLASSIFIED ACCORDING TO SEX AND AGE<br />
PERIODS, BY MIXTURE OF BLOOD: <strong>1910</strong>—Contmued.<br />
Table 6 1—Cont<strong>in</strong>ued.
STOCKS AND TRIBES, BY SEX, AGE, AND BLOOD. 129<br />
INDIANS IN EACH STOCK AND TRIBE IN THE UNITED STATES; CLASSIFIED ACCORDING TO SEX AND AGE<br />
PERIODS, BY MIXTURE OF BLOOD: <strong>1910</strong>—Cont<strong>in</strong>ued.<br />
Table 51—Cont<strong>in</strong>ued.<br />
TBIBB AND MIXTUBE OF<br />
BLOOD.<br />
. Redwood (Whil-<br />
KXJT) . .<br />
Both<br />
Total.!<br />
Under<br />
20<br />
yrs.<br />
20 51<br />
to yrs.<br />
SO <strong>and</strong><br />
yrs. over<br />
Total.!<br />
ATHAPASKAN STOCK—Cont<strong>in</strong>ued.<br />
Under<br />
20<br />
yrs.<br />
61<br />
yrs.<br />
<strong>and</strong><br />
over.
130 INDIANS IN THE UNITED STATES.<br />
INDIANS IN EACH STOCK AND TRIBE IN THE UNITED STATES, CLASSIFIED ACCORDING TO SEX AND AGE<br />
PERIODS, BY MIXTURE OF BLOOD: <strong>1910</strong>—Cont<strong>in</strong>ued.<br />
Table 6 1— Cont<strong>in</strong>ued.<br />
TBIBE AND MIXTDKE OF<br />
BLOOD.<br />
Caddo—Cont<strong>in</strong>ued.<br />
Mixed blood—Cont<strong>in</strong>ued.<br />
Negro <strong>and</strong> <strong>Indian</strong><br />
&lfNegro,lialI <strong>Indian</strong>.<br />
Both<br />
Total.!<br />
Under<br />
20<br />
yrs.<br />
51<br />
yrs.<br />
<strong>and</strong><br />
over.<br />
CADDOAN STOCK—Cont<strong>in</strong>ued.<br />
Total.!<br />
Under<br />
20<br />
yrs.<br />
51<br />
yrs.<br />
<strong>and</strong><br />
over.
STOCKS AND TRIBES, BY SEX, AGE, AND BLOOD. 131<br />
INDIANS IN EACH STOCK AND TRIBK IN THE UNITED STATES, CLASSIFIED ACCORDING TO SEX AND AGE<br />
PERIODS, BY MIXTURE OF BLOOD: <strong>1910</strong>—Cont<strong>in</strong>ued.<br />
Table 6 1—Cont<strong>in</strong>ued.<br />
TRIBE AKD MIXTURE OF<br />
BLOOD.<br />
Both<br />
sexes.
132 INDIANS IN THE UNITED STATES.<br />
INDIANS IN EACH STOCK AND TRIBE IN THE UNITED STATES, CLASSIFIED ACCORDING TO SEX AND AGE<br />
PERIODS, BY MIXTURE OF BLOOD: <strong>1910</strong>—Cont<strong>in</strong>ued.<br />
Table 5 1—Cont<strong>in</strong>ued.<br />
TBIBE AND MIXTUKE OP<br />
BLOOD.<br />
Total<br />
Both<br />
sexes.<br />
Total.!<br />
Under<br />
20<br />
yrs.<br />
51<br />
yrs.<br />
<strong>and</strong><br />
over.<br />
ESKIMATTAN STOCK.<br />
Total.'<br />
Under<br />
20<br />
yrs.<br />
51<br />
yrs.<br />
<strong>and</strong><br />
over.
STOCKS AND TRIBES, BY SEX, AGE, AND BLOOD. 133<br />
INDIANS IN EACH STOCK AND TRIBE IN THE UNITED STATES, CLASSIFIED ACCORDING TO SEX AND AGE<br />
PERIODS, BY MIXTURE OP BLOOD: <strong>1910</strong>—Cont<strong>in</strong>ued.<br />
Table 6 1—Cont<strong>in</strong>ued.<br />
TBIBE AND HIXTUBE OF<br />
BLOOD.<br />
Mohawk—Contd.<br />
Mixed blood<br />
White <strong>and</strong> <strong>Indian</strong><br />
Less than one-haU<br />
Salt wbite,'haU Indi^.'<br />
More than one-hEiU<br />
white<br />
Neero,white, <strong>and</strong> <strong>Indian</strong>..<br />
Ei<strong>the</strong>r white or Negro<br />
<strong>and</strong> <strong>Indian</strong><br />
Mixture unknown<br />
Blood not reported.<br />
Oneida.<br />
Fullhlood<br />
Fulltribsil<br />
Mixed tribal<br />
Twotribes<br />
Tliree or more tribes. .<br />
Tribal blood of one parent<br />
unknown<br />
.<br />
. . .<br />
(Mixed blood<br />
White <strong>and</strong> <strong>Indian</strong><br />
Less than one-haU<br />
white<br />
Hall white, hall <strong>Indian</strong>.<br />
More than one-half<br />
white<br />
Negro <strong>and</strong> <strong>Indian</strong> (less<br />
tfian one-hall Negro) . .<br />
Negro.white, <strong>and</strong> <strong>Indian</strong>..<br />
Mixture unknown<br />
Blood not reported.<br />
Oneida (Wiscons<strong>in</strong>).<br />
Full blood<br />
Full tribal<br />
Mixed tribal<br />
Two tribes<br />
Three or more tribes ..<br />
Tribal blood of one parent<br />
unknown<br />
Mixed blood<br />
White <strong>and</strong> <strong>Indian</strong><br />
Less than one-half<br />
white<br />
Halfwhite, half <strong>Indian</strong>.<br />
More than one-half<br />
white<br />
Negro <strong>and</strong> <strong>Indian</strong> (less<br />
than one-haU Negro}. .<br />
Negro, white, <strong>and</strong> <strong>Indian</strong>.<br />
Mixture unknown<br />
Blood not reported<br />
Oneida (New York)<br />
Full blood<br />
Full tribal<br />
Mixed tribal<br />
Twotribes<br />
Three or more tribes . .<br />
Tribal blood of one parent<br />
unknown. .'<br />
Mixed blood (white <strong>and</strong><br />
<strong>Indian</strong>)<br />
Less than one-half white.<br />
Half white, half <strong>Indian</strong>.<br />
Morethan one-haltwhite<br />
Onondaga .<br />
Full blood<br />
Full tribal<br />
Mixed tribal<br />
Twotribes<br />
Three or more tribes. .<br />
Mixed blood<br />
White <strong>and</strong> <strong>Indian</strong>. . . . - .<br />
Less than one-half<br />
white<br />
Half white.half <strong>Indian</strong><br />
More than one-half<br />
white<br />
Mixture unknown<br />
Blood not reported.<br />
.<br />
Both<br />
Total.i<br />
Under<br />
20<br />
yrs.<br />
51<br />
yrs.<br />
<strong>and</strong><br />
over.<br />
Total.i<br />
IBOQTTOIAN STOCK—Cont<strong>in</strong>ued.<br />
304<br />
293<br />
14<br />
2S2<br />
2,436<br />
2,098<br />
1,904<br />
184<br />
174<br />
10<br />
10<br />
333<br />
312<br />
107<br />
.103<br />
102<br />
2,107<br />
1,854<br />
1,760<br />
85<br />
248<br />
227<br />
74<br />
12<br />
211<br />
188<br />
89<br />
365<br />
299<br />
135<br />
164<br />
134<br />
30<br />
64<br />
146<br />
138<br />
107<br />
1,276<br />
1,102<br />
986<br />
108<br />
101<br />
7<br />
8<br />
172<br />
55<br />
1,109<br />
976<br />
918<br />
50<br />
48<br />
2<br />
132<br />
122<br />
113<br />
100<br />
42<br />
57<br />
52<br />
5<br />
13<br />
183<br />
141<br />
70<br />
71<br />
63<br />
8<br />
41<br />
41<br />
19<br />
18<br />
64<br />
590<br />
482<br />
416<br />
S8<br />
53<br />
5<br />
107<br />
104<br />
36<br />
392<br />
29<br />
28<br />
1<br />
48<br />
83<br />
501<br />
448<br />
413<br />
35<br />
33<br />
2<br />
438<br />
397<br />
382<br />
15<br />
14<br />
1<br />
4<br />
"3<br />
1.<br />
183<br />
148<br />
142<br />
23<br />
80 19<br />
158<br />
155<br />
5<br />
14S<br />
1,160<br />
918<br />
76<br />
73<br />
161<br />
150<br />
879<br />
842<br />
35<br />
34<br />
1<br />
116<br />
105<br />
10<br />
182<br />
158<br />
65<br />
93<br />
71<br />
22<br />
23<br />
21<br />
4<br />
16<br />
Under<br />
20<br />
yrs.<br />
578<br />
446<br />
41<br />
444<br />
418<br />
25<br />
25<br />
21<br />
34<br />
381<br />
354<br />
25<br />
14<br />
366<br />
321<br />
96 67<br />
SI<br />
yrs.<br />
<strong>and</strong><br />
over.<br />
127<br />
118<br />
115<br />
106<br />
103<br />
23<br />
IS<br />
TRIBE AND MIXTCllE OP<br />
BLOOD.<br />
St. Kegis<br />
Both<br />
Total.'<br />
Under<br />
20<br />
yrs.<br />
20 SI<br />
to<br />
SO<br />
yrs.<br />
<strong>and</strong><br />
yrs. over.<br />
Total.i<br />
IKOQTJOIAN STOCK—Cont<strong>in</strong>ued.<br />
Under<br />
20<br />
yrs.<br />
51<br />
yrs.<br />
<strong>and</strong><br />
over.
134 INDIANS IN THE UNITED STATES.<br />
INDIANS IN EACH STOCK AND TEIBE IN THE UNITED STATES, CLASSIFIED ACCOEDING TO SEX AND AGE<br />
PERIODS, BY MIXTURE OF BLOOD: igiO-Oont<strong>in</strong>ued.<br />
Table 5 1—Cont<strong>in</strong>ued.<br />
TRIBE AND HIXTUBE Or<br />
BLOOD.<br />
Both
STOCKS AND TRIBES, BY SEX, AGE, AND BLOOD. 135<br />
INDIANS IN EACH STOCK AND TRIBE IN THE UNITED STATES, CLASSIFIED ACCORDING TO SEX AND AGE<br />
PERIODS, BY MIXTURE OP BLOOD: <strong>1910</strong>—Cont<strong>in</strong>ued.<br />
Table 51—Cont<strong>in</strong>ued.<br />
TBIB£A<strong>in</strong>> MIXTUBE 07<br />
BLOOD.<br />
Both<br />
Total.i<br />
Under<br />
20<br />
yrs.<br />
51<br />
yrs.<br />
<strong>and</strong><br />
over.<br />
KEBSSAM' STOCK—Cont<strong>in</strong>ued.<br />
Total.!<br />
Under<br />
20<br />
yrs.<br />
51<br />
yrs.<br />
<strong>and</strong><br />
over.<br />
TBIBEAITD MIXTUBE 07<br />
BLOOD.<br />
Both<br />
sexes.<br />
Total.!<br />
Under<br />
20<br />
yrs.<br />
20<br />
to<br />
50<br />
yrs.<br />
51<br />
yrs.<br />
<strong>and</strong><br />
over.<br />
To.<br />
tal.i<br />
Under<br />
20<br />
yrs.<br />
51<br />
yrsi<br />
<strong>and</strong><br />
over.
136 INDIANS IN THE UNITED STATES.<br />
INDIANS IN EACH STOCK AND TRIBE IN THE UNITED STATES, CLASSIFIED ACC0RDIN(5 TO SEX AND AGE<br />
PERIODS, BY MIXTURE OP BLOOD: <strong>1910</strong>—Cont<strong>in</strong>ued.<br />
Table 5 1—Cont<strong>in</strong>ued.
STOCKS AND TRIBES, BY SEX, AGE, AND BLOOD. 137<br />
INDIANS IN EACH STOCK ^ V^/BE IN THE TOITED STA^^^^ CLASSIFIED ACCORDING TO SEX AND AGE<br />
PERIODS, BY MIXTURE OF BLOOD: <strong>1910</strong>—Cont<strong>in</strong>ued.<br />
Table 5 1—Cont<strong>in</strong>ued.
138 INDIANS IN THE UNITED STATES.<br />
INDIANS IN EACH STOCK AND TRIBE IN THE UNITED STATES, CLASSIFIED ACCORDING TO SEX AND AGE<br />
PERIODS, BY MIXTURE OF BLOOD: <strong>1910</strong>—Cont<strong>in</strong>ued.<br />
Table 6 1—Cont<strong>in</strong>ued.
STOCKS AND TRIBES, BY SEX, AGE, AND BLOOD. 139<br />
INDIANS IN EACH STOCK ANB TRIBE IN THE UNITED STATES, CLASSIFIED ACCORDING TO SEX AND AGE<br />
PERIODS, BY MIXTURE OF BLOOD: <strong>1910</strong>—Cont<strong>in</strong>ued.<br />
Table 5 1—Cont<strong>in</strong>ued.
140 INDIANS IN THE UNITED STATES.<br />
INDIANS IN EACH STOCK AND TRIBE IN THE UNITED STATES, CLASSIFIED ACCORDING TO SEX AND AGE<br />
PERIODS, BY MIXTURE OP BLOOD: <strong>1910</strong>—Cont<strong>in</strong>ued.<br />
Table 6 1—CJont<strong>in</strong>ued.
STOCKS AND TRIBES, BY SEX, AGE, AND BLOOD. 141<br />
INDIANS IN EACH STOCK AND TEIBE IN THE UNITED STATES, CLASSIFIED ACCORDING TO SEX AND AGE<br />
PERIODS, BY MIXTURE OF BLOOD: <strong>1910</strong>—Cont<strong>in</strong>ued.<br />
Table 5 1—Cont<strong>in</strong>ued.<br />
TEIBE AND MIXTDKE OP<br />
BLOOD.<br />
SONQISH.<br />
IHill blood<br />
Full tribal<br />
Ifixed tribal (tvro tribes)<br />
Tribal blood of one parent<br />
unknown<br />
IiGxed blood (half wblte,<br />
hall <strong>Indian</strong>)<br />
Spozan..<br />
Full blood<br />
Full tribal ;<br />
Mixed tribal<br />
Two tribes<br />
Three or more tribes.<br />
Tribal blood of one parent<br />
unknown<br />
Mixed blood (white <strong>and</strong><br />
<strong>Indian</strong>)<br />
Less than one-half white.<br />
Half white, half <strong>Indian</strong>.<br />
More than one-half white.<br />
Blood not reported<br />
Squaxon.<br />
Full blood<br />
Full tribal....<br />
Mixed tribal<br />
Two tribes<br />
Three or more tribes. -<br />
Tribal blood of one parent<br />
unknown<br />
Mixed blood (less than onehalf<br />
white)<br />
SUQUAMISH.<br />
Full blood<br />
Full tribal<br />
Mixed tribal<br />
Two tribes<br />
Three or more tribes..,<br />
Tribal blood of one parent<br />
unknown ,<br />
Mixed blood<br />
White <strong>and</strong> <strong>Indian</strong><br />
Less than one -half<br />
white<br />
Half white, half <strong>Indian</strong>.<br />
More than one-half<br />
white<br />
Negro <strong>and</strong> <strong>Indian</strong> (half<br />
Negro, halt <strong>Indian</strong>^...,<br />
Negro,white, <strong>and</strong> <strong>Indian</strong>.<br />
SwnJOMiSH.<br />
Full blood<br />
Full tribal<br />
Mixed tribal (two tribes)<br />
Tribal blood of one parent<br />
unknown<br />
Mixed blood<br />
Wbite<strong>and</strong> <strong>Indian</strong><br />
Less than one-half<br />
white<br />
Hall white, half <strong>Indian</strong><br />
More than one- half<br />
white<br />
O<strong>the</strong>r races <strong>and</strong> <strong>Indian</strong><br />
(Ch<strong>in</strong>ese)<br />
TiLLAUOOE.<br />
Full blood<br />
Full tribal<br />
Mixed tribal (two tribes)<br />
Mixed blood (less than onehalf<br />
white)<br />
Blood not reported.<br />
Both<br />
Total.!<br />
Under<br />
20<br />
yrs.<br />
20 51<br />
to<br />
50<br />
yrs.<br />
<strong>and</strong><br />
yrs. over,<br />
To^<br />
tal.i<br />
SAIilSHAX STOCK—Cont<strong>in</strong>ued.<br />
643<br />
409<br />
356<br />
51<br />
39<br />
12<br />
233<br />
44<br />
307<br />
177<br />
145<br />
27<br />
18<br />
130<br />
127<br />
333<br />
279<br />
270<br />
301<br />
185<br />
162<br />
21<br />
16<br />
22<br />
17<br />
36<br />
142<br />
138<br />
36<br />
101<br />
12<br />
1 1<br />
1<br />
54<br />
15<br />
24<br />
342<br />
224<br />
194<br />
30<br />
23<br />
7<br />
118<br />
20<br />
40<br />
58<br />
144<br />
155<br />
137<br />
132<br />
3<br />
12<br />
Under<br />
20<br />
yrs.<br />
20<br />
to<br />
50<br />
yrs.<br />
42<br />
51<br />
yrs.<br />
<strong>and</strong><br />
over.<br />
63<br />
23<br />
36<br />
TBIBE AND MIXTUBE OF<br />
BLOOD.<br />
Both
142 INDIANS IN THE UNITED STATES.<br />
INDIANS IN EACH STOCK AND TRIBE IN THE UNITED STATES, CLASSIFIED ACCORDING TO SEX AND AGE<br />
PERIODS, BY MIXTURE OF BLOOD: IQIO-Contmued.<br />
TaTole SI—Cont<strong>in</strong>ned.<br />
TKIBE AND MIXTUKE OF<br />
BLOOD.<br />
TOPINISH<br />
Full blood:<br />
Full tribal<br />
Uixed tribal (two tribes).<br />
Umatilla<br />
. .<br />
. .<br />
FuU blood<br />
Fulltribta<br />
Mixed tribal<br />
Two tribes ,<br />
Three or more tribes. .<br />
Uixed blood (wbite <strong>and</strong><br />
<strong>Indian</strong>) ,<br />
Less than one-balf white.<br />
Half white, half <strong>Indian</strong>.<br />
More than one-halfwhite.<br />
Unknown proportions .<br />
Wallawalla ,<br />
Fun blood<br />
FuU tribal<br />
Mixed tribal<br />
Two tribes<br />
Three or more tribes . .<br />
Mixed blood ,<br />
'White <strong>and</strong> <strong>Indian</strong><br />
Xfess than one-half<br />
white<br />
Halfwbite, half <strong>Indian</strong><br />
More than one-half<br />
white<br />
ITegro,white, <strong>and</strong> <strong>Indian</strong>.<br />
I Wabm<br />
SPRmas ,<br />
Full blood<br />
Full tribal<br />
Mixed tribal<br />
Two tribes<br />
Three or more tribes.<br />
Mixed blood (white <strong>and</strong><br />
<strong>Indian</strong>)<br />
Less than one-half white<br />
Half white, half <strong>Indian</strong>..<br />
Morethan one-halfwhite.<br />
Yazdia<br />
Full blood<br />
Full tribal<br />
Mixed tribal<br />
Two tribes<br />
Three or more tribes. .<br />
Tribal blood of one parent<br />
imlcnown<br />
Mixed blood<br />
White <strong>and</strong> <strong>Indian</strong>. . .,<br />
Less than one-half<br />
white<br />
Half white, half <strong>Indian</strong>.<br />
More than one-half<br />
white<br />
Unknown proportions<br />
("Mexican"^ mixture)<br />
Xegro <strong>and</strong> <strong>Indian</strong><br />
Less than one-half<br />
Negro<br />
Half Negro, half <strong>Indian</strong>.<br />
O<strong>the</strong>r races <strong>and</strong> <strong>Indian</strong><br />
(Polynesian)..!<br />
Blood not reported<br />
Total<br />
.<br />
Botb<br />
sexes.<br />
Total.i<br />
Under<br />
20<br />
yrs.<br />
SI<br />
yrs.<br />
<strong>and</strong><br />
over.<br />
Total.i<br />
SHAHAPTIAIW STOCK—Cont<strong>in</strong>ued.<br />
47<br />
272<br />
219<br />
158<br />
61<br />
54<br />
7<br />
397<br />
126<br />
100<br />
26<br />
271<br />
20<br />
100<br />
146<br />
5<br />
538<br />
470<br />
68<br />
60<br />
12<br />
8<br />
3<br />
1<br />
1,362<br />
1,043<br />
916<br />
125<br />
115<br />
10<br />
317<br />
312<br />
80<br />
135<br />
95<br />
114<br />
17<br />
15<br />
2<br />
138<br />
136<br />
11<br />
59<br />
2<br />
255<br />
250<br />
215<br />
35<br />
31<br />
4<br />
474<br />
413<br />
61<br />
57<br />
4<br />
158<br />
155<br />
34<br />
108<br />
102<br />
278<br />
191<br />
150<br />
41<br />
38<br />
3<br />
87<br />
30<br />
54<br />
10<br />
25<br />
95<br />
249<br />
190<br />
175<br />
15<br />
15<br />
57<br />
SHASTAX 8TOCK.<br />
26<br />
100<br />
12<br />
158<br />
132<br />
93<br />
39<br />
34<br />
5<br />
193<br />
133<br />
130<br />
288<br />
255<br />
730<br />
603<br />
159<br />
157<br />
Under<br />
20<br />
yrs.<br />
116<br />
113<br />
95<br />
18<br />
15<br />
287<br />
180<br />
144<br />
36<br />
33<br />
3<br />
107<br />
107<br />
65<br />
113<br />
109<br />
96<br />
13<br />
12<br />
1<br />
253<br />
232<br />
21<br />
19<br />
2<br />
51<br />
yrs.<br />
<strong>and</strong><br />
over.<br />
32<br />
66<br />
125<br />
117<br />
6<br />
5<br />
1
STOCKS AND TRIBES, BY SEX, AGE, AND BLOOD. 143<br />
INDIANS IN EACH STOCK AND TRIBE IN THE UNITED STATES, CLASSIFIED ACCORDING TO SEX AND AGE<br />
PERIODS, BY MIXTURE OP BLOOD: <strong>1910</strong>—Cont<strong>in</strong>ued.<br />
Table 5 1— Cont<strong>in</strong>ued.<br />
TRIBE AND MIXTtTEE OP<br />
BLOOD.<br />
Total—Cont<strong>in</strong>ued.<br />
Mixed blood—Cont<strong>in</strong>ued.<br />
Negro <strong>and</strong> <strong>Indian</strong><br />
Less than one-half<br />
Negro<br />
Half Negro,half <strong>Indian</strong><br />
Neero,white, <strong>and</strong> <strong>Indian</strong>.<br />
Ei<strong>the</strong>r white<br />
Both<br />
Total.i<br />
Under<br />
20<br />
yrs.<br />
51<br />
yrs.<br />
<strong>and</strong><br />
over.<br />
Total.!<br />
8HOSHONBAN STOCK—Cont<strong>in</strong>ued.<br />
- or Negro<br />
<strong>and</strong> <strong>Indian</strong><br />
O<strong>the</strong>r races <strong>and</strong> <strong>Indian</strong><br />
(Ch<strong>in</strong>ese)<br />
Blood not reported.<br />
Bannock..<br />
Full blood<br />
Full tribal<br />
Mixed tribal (two tribes)<br />
. .<br />
Mixed blood (white <strong>and</strong><br />
<strong>Indian</strong>)<br />
Less than one-half white.<br />
HaUwhite, half <strong>Indian</strong>...<br />
More than one-half white.<br />
Unknown proportions<br />
("Mexican'' mixture)<br />
Chemehuevi...<br />
Full blood<br />
Full tribal<br />
Mixed tribal (two tribes)<br />
Mixed blood<br />
White <strong>and</strong> <strong>Indian</strong><br />
Less than one-half<br />
white<br />
Half white, half <strong>Indian</strong><br />
More than one-half<br />
white<br />
Unknown proportions<br />
("Mexican" mixture)<br />
Ei<strong>the</strong>r white or Negro<br />
<strong>and</strong> <strong>Indian</strong><br />
Comanche.<br />
Full blood<br />
Full tribal<br />
Mixed tribal<br />
Two tribes<br />
Three or more tribes.<br />
Tribal blood of one parent<br />
unknown<br />
Mixed blood<br />
White <strong>and</strong> <strong>Indian</strong><br />
Less than one-half<br />
white<br />
Half white, half <strong>Indian</strong><br />
More than one-half<br />
white<br />
Unknown proportions,<br />
<strong>and</strong> "Mexican"<br />
mixture<br />
Negro <strong>and</strong> <strong>Indian</strong><br />
Less than one-half<br />
Negro<br />
Half Negro.half<strong>Indian</strong><br />
Negro,whlte,<strong>and</strong> <strong>Indian</strong>.<br />
Eiffier white or Negro<br />
<strong>and</strong> <strong>Indian</strong><br />
Blood not reported.<br />
Gaebieleno .<br />
Mixed blood:<br />
Less than one-half white.<br />
More than one-half white.<br />
Hopi..<br />
Full blood<br />
Full tribal<br />
Mixed tribal (two tribes)<br />
Tribal blood of one parent<br />
unlmown<br />
Mixed blood (half white,<br />
half <strong>Indian</strong>)<br />
24<br />
14<br />
10<br />
16<br />
2<br />
2<br />
242<br />
413<br />
323<br />
305<br />
18<br />
355<br />
315<br />
297<br />
18<br />
40<br />
2<br />
1<br />
1,171<br />
736<br />
407<br />
399<br />
119<br />
85<br />
48<br />
147<br />
28<br />
10<br />
2,009<br />
2,006<br />
1,995<br />
10<br />
1<br />
128<br />
214<br />
169<br />
158<br />
11<br />
177<br />
156<br />
144<br />
12<br />
21<br />
21<br />
8<br />
11<br />
590<br />
362<br />
339<br />
11<br />
12<br />
214<br />
211<br />
26<br />
72<br />
1,061<br />
1,059<br />
1,053<br />
10<br />
23<br />
64<br />
153<br />
135<br />
134<br />
132<br />
23<br />
516<br />
514<br />
509<br />
46<br />
77<br />
67<br />
217<br />
151<br />
147<br />
1<br />
1<br />
449<br />
448<br />
19<br />
7<br />
5<br />
7<br />
2<br />
1<br />
.114<br />
199<br />
154<br />
147<br />
7<br />
178<br />
159<br />
153<br />
6<br />
5<br />
1<br />
1<br />
581<br />
374<br />
351<br />
13<br />
13<br />
10<br />
193<br />
188<br />
22<br />
948<br />
947<br />
942<br />
5<br />
Under<br />
20<br />
yrs.<br />
256<br />
128<br />
114<br />
10<br />
10<br />
122<br />
119<br />
489<br />
486<br />
68<br />
228<br />
25<br />
377<br />
376<br />
374<br />
2<br />
51<br />
yrs.<br />
<strong>and</strong><br />
over<br />
12<br />
IBIBE AKD MIXTUBE OF<br />
BLOOD.<br />
JUANENO<br />
Both<br />
sexes.<br />
Total.i<br />
Under<br />
20<br />
yrs.<br />
yrs.<br />
<strong>and</strong><br />
Total.!<br />
SHOSHONEAN STOCK—Cont<strong>in</strong>ued.<br />
Undec<br />
20<br />
yrs.<br />
20<br />
to<br />
60<br />
yrs.<br />
51<br />
yrs.<br />
<strong>and</strong>
144 INDIANS IN THE UNITED STATES.<br />
INDIANS IX EACH STOCK AND TRIBE IN THE UNITED STATES, CLASSIFIED ACCORDING TO SEX AND AGE<br />
PERIODS, BY MIXTURE OF BLOOD: <strong>1910</strong>—Cont<strong>in</strong>ued.<br />
Table 5 1—Conttaued.<br />
TKIBE AND MIXTURE OF<br />
BLOOD.<br />
Patote—Cont<strong>in</strong>ued<br />
Mixed blood. . . .<br />
Both<br />
sexes.<br />
Total.!<br />
Under<br />
20<br />
yrs.<br />
51<br />
yrs.<br />
<strong>and</strong><br />
over,<br />
To-<br />
tal.'<br />
SHOSHONEAN STOCK—Cont<strong>in</strong>ued.<br />
Under<br />
20<br />
yrs.<br />
20<br />
to<br />
SO<br />
yrs.<br />
51<br />
yrs.<br />
E<strong>in</strong>d<br />
over
STOCKS AND TRIBES, BY SEX, AGE, AND BLOOD. 145<br />
INDIANS IN EACH STOCK AND TRIBE IN THE UNITED STATES, CLASSIFIED ACCORDING TO SEX AND AGE<br />
PERIODS, BY MIXTURE OF BLOOD: <strong>1910</strong>—Cont<strong>in</strong>ued.<br />
Table 61—Cont<strong>in</strong>aed.<br />
IBIBE AND MIXTTTEE OF<br />
BLOOD.<br />
Both
146 INDIANS IN THE UNITED STATES.<br />
INDIANS IN EACH STOCK AND TRIBE IN THE UNITED STATES, CLASSIFIED ACCORDING TO SEX AND AGE<br />
PERIODS, BY MIXTURE OF BLOOI): <strong>1910</strong>-Contmued<br />
Table SI—Cont<strong>in</strong>ued.<br />
TBIBE AND MIXTCKE OF<br />
BLOOD.<br />
PONCA..<br />
. . . . . .<br />
Full blood<br />
Full tribal<br />
Utzed tribal (two tribes)<br />
Mixed blood<br />
Wbite <strong>and</strong> <strong>Indian</strong><br />
Less than one -half<br />
white<br />
Half white, halt <strong>Indian</strong><br />
More than one - half<br />
white<br />
• Unknown proportions.<br />
Ei<strong>the</strong>r white or Negro<br />
<strong>and</strong> <strong>Indian</strong><br />
Blood not reported..<br />
QtTAPAW..<br />
Full blood<br />
Full tribal<br />
Mixed tribal<br />
Two tribes<br />
Three or more tribes<br />
Mixed blood<br />
.-<br />
White <strong>and</strong> <strong>Indian</strong><br />
Less than one -half<br />
white<br />
Salf white, half <strong>Indian</strong>.<br />
More than one- half<br />
white<br />
Unknown proportions<br />
Ei<strong>the</strong>r white or Negro<br />
<strong>and</strong> <strong>Indian</strong><br />
Mixture unknown<br />
Blood not reported..<br />
Santee Siomc.<br />
FuU blood<br />
Full tribal<br />
Mixed tribal<br />
Two tribes<br />
Three or more tribes.<br />
Tribal blood of one parent<br />
unknown<br />
Mixed blood<br />
White <strong>and</strong> <strong>Indian</strong><br />
Less than one - half<br />
white<br />
Half white, haU<strong>Indian</strong>.<br />
More than one - half<br />
white<br />
Negro <strong>and</strong> <strong>Indian</strong><br />
Lisss than one -half<br />
Negro<br />
Half Negro ,half <strong>Indian</strong><br />
Negro, white, <strong>and</strong>lndian.<br />
Ei<strong>the</strong>r white or Negro<br />
<strong>and</strong>lndian<br />
Mixture unknown<br />
Sioux.,<br />
Full blood ,<br />
FuU tribal<br />
Mixed tribal<br />
Two tribes<br />
Three or more tribes. .<br />
Tribal blood of one parent<br />
unknown<br />
Mixed blood<br />
White <strong>and</strong> <strong>Indian</strong><br />
Less than one - half<br />
white<br />
Half white, half <strong>Indian</strong><br />
More than one -half<br />
white<br />
Unknown proportions,<br />
<strong>and</strong> "Mexican"<br />
mixture<br />
Negro <strong>and</strong> <strong>Indian</strong> (half<br />
Negro, half <strong>Indian</strong>)<br />
Mixture unknown<br />
Blood not reported..<br />
Both<br />
sexes.<br />
To-<br />
tal."<br />
Under<br />
20<br />
yrs.<br />
51<br />
yrs.<br />
<strong>and</strong><br />
over.<br />
SIOXJAN STOCK—Cont<strong>in</strong>ued.<br />
875<br />
461<br />
455<br />
6<br />
160<br />
64<br />
39<br />
63<br />
31<br />
32<br />
25<br />
7<br />
lis<br />
116<br />
4<br />
22<br />
81<br />
1,539<br />
799<br />
672<br />
125<br />
89<br />
36<br />
2<br />
740<br />
714<br />
286<br />
160<br />
494<br />
441<br />
SO<br />
37<br />
13<br />
477<br />
474<br />
75<br />
187<br />
198<br />
25<br />
432<br />
224<br />
222<br />
2<br />
206<br />
185<br />
72<br />
34<br />
42<br />
37<br />
20<br />
3<br />
115<br />
26<br />
782<br />
385<br />
319<br />
65<br />
46<br />
19<br />
397<br />
381<br />
154<br />
145<br />
44<br />
112<br />
103<br />
220<br />
127<br />
116<br />
61<br />
14<br />
27<br />
24<br />
11<br />
2<br />
72<br />
33<br />
11<br />
158<br />
124<br />
222<br />
214<br />
102<br />
19<br />
93<br />
253<br />
96<br />
148<br />
148<br />
66<br />
162<br />
92<br />
32<br />
248<br />
140<br />
132<br />
8<br />
7<br />
1<br />
50<br />
128<br />
51<br />
To-<br />
tal.'<br />
443<br />
237<br />
233<br />
203<br />
184<br />
30<br />
116<br />
1<br />
24<br />
767<br />
414<br />
353<br />
60<br />
43<br />
17<br />
343<br />
333<br />
132<br />
78<br />
123<br />
444<br />
223<br />
193<br />
29<br />
22<br />
7<br />
208<br />
208<br />
95<br />
131<br />
Under<br />
20<br />
yrs.<br />
242<br />
96<br />
2<br />
142<br />
129<br />
75<br />
13<br />
21<br />
20<br />
13<br />
2<br />
70<br />
364<br />
145<br />
118<br />
27<br />
13<br />
14<br />
219<br />
214<br />
215<br />
124<br />
124<br />
67<br />
154<br />
36<br />
12<br />
244<br />
145<br />
131<br />
14<br />
11<br />
95<br />
168<br />
51<br />
yrs.<br />
<strong>and</strong><br />
over.<br />
148<br />
123<br />
104<br />
19<br />
19<br />
60<br />
TKIBE AND MIXTUKE OF<br />
BLOOD.<br />
SissETON Sioux.<br />
Full blood<br />
Full tribal ,<br />
Mixed tribal<br />
Two tribes<br />
Three or more tribes<br />
Tribal blood of one parent<br />
unknown<br />
Mixed blood<br />
White <strong>and</strong> <strong>Indian</strong><br />
Bess than one -half<br />
white<br />
Half white, half <strong>Indian</strong>.<br />
More than one - half<br />
white<br />
Unknown proportions.<br />
Negro, white,<strong>and</strong> <strong>Indian</strong>.<br />
Mixture unknown<br />
Blood not reported.<br />
Teton Sioux.<br />
Full blood<br />
Full tribal<br />
Mixed tribal<br />
Two tribes<br />
Three or more tribes<br />
Tribal blood of one parent<br />
unknown<br />
Mixed blood<br />
White <strong>and</strong> <strong>Indian</strong><br />
Less than one -half<br />
white<br />
Half white, half <strong>Indian</strong>.<br />
More than one -half<br />
white<br />
Unknown proportions,<br />
<strong>and</strong> "Mexican"mixture<br />
Negro <strong>and</strong> <strong>Indian</strong><br />
Less than one -half<br />
Negro<br />
Half NegrOjhalf <strong>Indian</strong>.<br />
Negro, white, <strong>and</strong> <strong>Indian</strong>,<br />
Ei<strong>the</strong>r white or Negro<br />
<strong>and</strong>lndian<br />
Mixture unknown<br />
Blood not reported.<br />
Brtiie Sioux.<br />
Full blood<br />
Full tribal<br />
Mixed tribal<br />
Two tribes<br />
Three or more tribes. .<br />
. . . .<br />
Tribal blood of one parent<br />
unknown<br />
Mixed blood<br />
White <strong>and</strong> <strong>Indian</strong><br />
Less than one - half<br />
white<br />
Half white, half <strong>Indian</strong>.<br />
More than one -halt<br />
white.<br />
Unknown proportions<br />
("Mexican"' mixture)<br />
Negro <strong>and</strong> <strong>Indian</strong> (less<br />
than one-half Negro) . .<br />
Negro, white, <strong>and</strong>lndian<br />
Mixture unknown<br />
Blood not reported<br />
Hvmkpapa Sioux<br />
Full blood<br />
Full tribal<br />
Mixed tribal<br />
Two tribes<br />
Three or more tribes. .<br />
Tribal blood of one parent<br />
unknown<br />
Mixed blood' (white <strong>and</strong><br />
IndlMi)<br />
Less than one-half white.<br />
Half white, half <strong>Indian</strong>...<br />
More than one-halfwhite<br />
Blood not reported<br />
'Totals <strong>in</strong>clude persons of unknown age.<br />
Both<br />
sexes.<br />
Total.'<br />
Under<br />
20<br />
yrs.<br />
51<br />
yrs.<br />
<strong>and</strong><br />
over.<br />
SIOtTAN STOCK-Contlnued.<br />
2,514<br />
1,631<br />
1,394<br />
228<br />
184<br />
44<br />
876<br />
863<br />
354<br />
346<br />
157<br />
6<br />
1<br />
12<br />
10,598<br />
9,747<br />
772<br />
379<br />
393<br />
79<br />
3,551<br />
3,508<br />
1,142<br />
1,277<br />
135<br />
806<br />
593<br />
441<br />
145<br />
128<br />
17<br />
212<br />
200<br />
1,072<br />
954<br />
453<br />
341<br />
128<br />
109<br />
48<br />
42<br />
19<br />
1,278<br />
801<br />
665<br />
131<br />
105<br />
26<br />
474<br />
469<br />
186<br />
191<br />
5,235<br />
'•It<br />
199<br />
212<br />
34<br />
1,796<br />
1,768<br />
584<br />
505<br />
53<br />
9<br />
4<br />
5<br />
14<br />
5<br />
415<br />
300<br />
222<br />
77<br />
67<br />
10<br />
1<br />
lis<br />
108<br />
27<br />
50<br />
525<br />
471<br />
204<br />
250<br />
185<br />
66<br />
566<br />
289<br />
221<br />
63<br />
44<br />
19<br />
276<br />
273<br />
130<br />
84<br />
500<br />
329<br />
287<br />
42<br />
169<br />
167<br />
211<br />
182<br />
156<br />
2,121 2,008 1,101<br />
1,862 1,873 1,060<br />
242 125 44<br />
81 76 42<br />
161 49<br />
17<br />
182<br />
116<br />
81<br />
35<br />
30<br />
211<br />
177<br />
55<br />
112<br />
68<br />
44<br />
10<br />
34<br />
21<br />
5<br />
8<br />
10<br />
614<br />
606<br />
125<br />
288<br />
170<br />
158<br />
20<br />
237<br />
219<br />
113<br />
103<br />
83<br />
20<br />
29<br />
17<br />
10<br />
76<br />
77<br />
Total.'<br />
1,236<br />
830<br />
729<br />
97<br />
79<br />
18<br />
4<br />
402<br />
168<br />
156<br />
67<br />
4<br />
1<br />
7<br />
5,363<br />
4,967<br />
361<br />
180<br />
181<br />
46<br />
1,755<br />
1,740<br />
558<br />
651<br />
490<br />
391<br />
Under<br />
20<br />
yrs.<br />
542<br />
263<br />
127<br />
90<br />
43<br />
20 51<br />
to<br />
50<br />
yrs.<br />
<strong>and</strong><br />
yrs. over.<br />
429<br />
14,284 7,100 3,235 2,652 1,205 7,184 3,152 2,685 1,435<br />
547<br />
483<br />
219<br />
156<br />
63<br />
15<br />
59<br />
26<br />
23<br />
10<br />
5<br />
2,066 1,979 1,318<br />
1,823 1,868 1,265<br />
210 100 61<br />
73<br />
4S<br />
137<br />
6<br />
22<br />
1,075<br />
1,067<br />
113<br />
111<br />
21<br />
262<br />
271 315 241<br />
219 285 222<br />
. 50 29 18<br />
. 37<br />
13<br />
24 18<br />
22<br />
160<br />
103<br />
64<br />
37<br />
32<br />
232<br />
189<br />
67<br />
113<br />
64<br />
49<br />
26<br />
2<br />
1<br />
144<br />
109<br />
85<br />
22<br />
16<br />
35<br />
13<br />
207<br />
191<br />
123<br />
65<br />
56<br />
16<br />
20<br />
20<br />
7<br />
10<br />
12<br />
98<br />
7<br />
SO<br />
2<br />
19<br />
SI<br />
70<br />
8<br />
8<br />
108<br />
103<br />
59<br />
41<br />
36<br />
5
STOCKS AND TRIBES, BY SEX, AGE, AND BLOOD. 147<br />
INDIANS IN EACH STOCK AND TRIBE IN THE UNITED STATES, CLASSIFIED ACCORDING TO SEX AND AGE<br />
PERIODS, BY MIXTURE OF BLOOD: <strong>1910</strong>—Contmued.<br />
Table 51—Cont<strong>in</strong>ued.
148 INDIANS IN THE UNITED STATES.<br />
INDIANS IN EACH STOCK AND TRIBE IN THE UNITED STATES, CLASSIFIED ACCORDING TO SEX AND AGE<br />
PERIODS, BY MIXTURE OF BLOOD: <strong>1910</strong>—Cont<strong>in</strong>ued.<br />
Table 6 1—Cont<strong>in</strong>ued.<br />
TBCBE AND HDCTUBE Or<br />
BLOOD.<br />
Total<br />
Both<br />
Total.!<br />
Under<br />
20<br />
yrs.<br />
51<br />
JTS.<br />
<strong>and</strong><br />
over.<br />
TAKBIiMAN STOCK.<br />
Total.!<br />
Under<br />
20<br />
yrs.<br />
51<br />
yrs.<br />
<strong>and</strong><br />
over.
STOCKS AND TRIBES, BY SEX, AGE, AND BLOOD. 149<br />
INDIANS IN EACH STOCK AND TRIBE IN THE
150 INDIANS IN THE UNITED STATES.<br />
INDIANS IN EACH STOCK AND TRIBE IN THE UNITED STAGES, CLASSIFIED ACCOBDING TO SEX AND AGE<br />
PERIODS, BY MIXTURE OP BLOOD: <strong>1910</strong>—Cont<strong>in</strong>ued.<br />
Table 5 1—Cont<strong>in</strong>ued.<br />
TBIBE AND HLXTtTBE OF<br />
BLOOD.<br />
Both
STOCKS AND TRIBES, BY SEX, AGE, AND BLOOD. 151<br />
INDIANS IN EACH STOCK AND TRIBE IN THE UNITED STATES, CLASSIFIED ACCORDING TO SEX AND AGE<br />
PERIODS, BY MIXTURE OF BLOOD: <strong>1910</strong>—Cont<strong>in</strong>ued.<br />
Table 5 1—Cont<strong>in</strong>ued.<br />
TRIBE AND MIXTXJBE OP<br />
BLOOD.<br />
Total..<br />
. . .<br />
Full blood<br />
Pure stock<br />
Mixed stock (two stocks)<br />
Stock <strong>in</strong> part unknown.<br />
Mixed blood<br />
White <strong>and</strong> <strong>Indian</strong><br />
Less than one-hall<br />
white<br />
Half white, halt <strong>Indian</strong>.<br />
More than one-hall<br />
white<br />
TTnknown proportions<br />
("Mexican" mixture)<br />
Kegro, white, <strong>and</strong> <strong>Indian</strong><br />
Bloodnot reported.<br />
CHoraiM<strong>in</strong>.<br />
Full blood<br />
Full tribal<br />
Mixed tribal (three or<br />
more tribes)<br />
Tribal blood of one parent<br />
unknown<br />
Mixed blood (unknown<br />
proportions, "Mexican"<br />
mixture)<br />
Blood not reported<br />
Chooeim<strong>in</strong>ah<br />
Full blood (full tribal)<br />
MUed blood (half white,<br />
half <strong>Indian</strong>)<br />
CmjKCHANSI..<br />
. Full blood<br />
Full tribal<br />
Tribal blood of one parent<br />
unknown<br />
Mixed blood (white <strong>and</strong><br />
<strong>Indian</strong>)<br />
Less than one-hall white<br />
Half white, half <strong>Indian</strong>. ..<br />
More thanone-hallwhite.<br />
Untaiown proportions<br />
("Mexican" mixture)..<br />
Blood not reported<br />
Kashowoo.<br />
Full blood<br />
Full tribal<br />
Mixed tribal (two tribes)<br />
Mixed blood (white <strong>and</strong><br />
<strong>Indian</strong>)<br />
Less than one-hallwhite .<br />
More than one-halfwhite.<br />
Tachi.<br />
Full blood<br />
Full tribal<br />
Mixed tribal<br />
Two tribes<br />
Three or more tribes..<br />
Mixed blood (white <strong>and</strong><br />
<strong>Indian</strong>)<br />
Less than one-hall white<br />
Unknown proportions<br />
("Mexican" mixture) .<br />
.<br />
.<br />
Both<br />
Total.!<br />
Under<br />
20<br />
Tis.<br />
YOKTTTS STOCK.<br />
533<br />
401<br />
366<br />
17<br />
18<br />
104<br />
28<br />
18<br />
27<br />
280 118 122<br />
206<br />
187<br />
10<br />
9<br />
64<br />
64<br />
18<br />
13<br />
29<br />
17<br />
'ih<br />
1<br />
1<br />
.<br />
21<br />
36<br />
51<br />
yrs.<br />
<strong>and</strong><br />
over.<br />
39<br />
Total.!<br />
253<br />
195<br />
179<br />
7<br />
9<br />
40<br />
18<br />
12<br />
Under<br />
20<br />
yrs.<br />
115 108<br />
27<br />
39<br />
51<br />
yrs.<br />
<strong>and</strong><br />
over.<br />
30<br />
25<br />
TRIBE AND MIXTURE OF<br />
BLOOD.<br />
Wechikhit..<br />
Full blood:<br />
Full tribal<br />
Mixed tribal<br />
Two tribes<br />
Three or more tribes.<br />
WlKCHAMNI.<br />
Full blood<br />
Full tribal<br />
Mixed tribal (two tribes).<br />
Tribal blood of one parent<br />
unknown<br />
Mixed blood (white <strong>and</strong><br />
<strong>Indian</strong>)<br />
Less than one-halfwhite<br />
Half white, half <strong>Indian</strong>. .<br />
Blood not reported.<br />
YOKUTS<br />
.<br />
. .<br />
FuU blood<br />
Full tribal<br />
Mixed tribal (two tribes).<br />
Tribal blood of one parent<br />
unknown<br />
Mixed blood<br />
White <strong>and</strong> <strong>Indian</strong><br />
'..<br />
Less than one-half<br />
white<br />
Hall white, half<strong>Indian</strong>.<br />
Unknown proportions<br />
("Mexican" mixture) .<br />
Negro, white, <strong>and</strong> <strong>Indian</strong>.<br />
Blood not reported<br />
YOWDANCm..<br />
Full blood:<br />
Full tribal..."<br />
Mixed tribal (two tribes).<br />
Total<br />
1 Totals <strong>in</strong>clude persons of unknown age.<br />
Both<br />
Total.!<br />
Under<br />
20<br />
yis.<br />
51<br />
yrs.<br />
<strong>and</strong><br />
over.<br />
YOKUTS STOCK—Cont<strong>in</strong>ued.<br />
25<br />
5<br />
4<br />
1<br />
3<br />
302<br />
255<br />
241<br />
12<br />
2<br />
172<br />
145<br />
136<br />
7<br />
TDCHBAN STOCK.<br />
YUKIAN STOCK.<br />
Total.!<br />
74 130<br />
110<br />
105<br />
5<br />
Under<br />
yrs.<br />
54<br />
61<br />
yrs.<br />
<strong>and</strong><br />
over.<br />
59 17<br />
14<br />
14
152 INDIANS IN THE UNITED STATES.<br />
INDIANS IN EACH STOCK AND TRIBE IN THE UNITED STATES, CLASSIFIED ACCORDING TO SEX AND AGE<br />
PERIODS, BY MIXTURE OP BLOOD: <strong>1910</strong>—Cont<strong>in</strong>ued.<br />
Table S 1—Ckmt<strong>in</strong>ued.<br />
TBffiE AND MIXTUKE OP<br />
BLOOD.<br />
Coast Yuki<br />
Full blood<br />
FulUribal<br />
Mixed tribal<br />
Two tribes<br />
Three or more tribes ..<br />
Mixed blood (hall white,<br />
half <strong>Indian</strong>)<br />
Red-wood (Huch-<br />
NOM)<br />
.<br />
.<br />
Full blood<br />
Full tribal<br />
Mixed tribal (two tribesV<br />
Mixed blood (half white,<br />
half <strong>Indian</strong>)<br />
Wappo<br />
Full blood<br />
Full tribal<br />
Mixed tribal<br />
Two tribes<br />
Three or more tribes. .<br />
Tribal blood of one parent<br />
unknown<br />
Mixed blood<br />
<strong>Indian</strong>)<br />
(white <strong>and</strong><br />
Less tlmn one-half white .<br />
Half white, half <strong>Indian</strong> ..<br />
More thanone-half white.<br />
Blood not reported<br />
YCKI<br />
Full blood<br />
Full tribal<br />
Mixed tribal<br />
Two tribes<br />
Three or more tribes. .<br />
Mixed blood<br />
White <strong>and</strong> <strong>Indian</strong><br />
Less than one-half<br />
white<br />
Half white, half <strong>Indian</strong><br />
Negro <strong>and</strong> <strong>Indian</strong> (half<br />
Negro, half <strong>Indian</strong>)<br />
Total :<br />
Full blood<br />
Pure stock<br />
Mixed stock (two stocks)<br />
Stock <strong>in</strong> part unknown.<br />
Mixed blood<br />
White <strong>and</strong> <strong>Indian</strong><br />
Less than one-half<br />
white<br />
Half white, half <strong>Indian</strong>.<br />
More than one-half<br />
white<br />
Unknown proportions<br />
("Mexican"^ mixture)<br />
Negro <strong>and</strong> <strong>Indian</strong><br />
Less than one-half<br />
Negro<br />
Half Negro, half <strong>Indian</strong><br />
Ei<strong>the</strong>r white or Negro<br />
<strong>and</strong> <strong>Indian</strong><br />
Blood not reported<br />
Both<br />
sexes.<br />
Total.!<br />
Under<br />
20<br />
yrs.<br />
51<br />
yrs.<br />
<strong>and</strong><br />
over.<br />
YTJKIAN STOCK—Cont<strong>in</strong>ued.<br />
15<br />
15<br />
73<br />
95<br />
4,279<br />
4,000<br />
3,900<br />
90<br />
10<br />
221<br />
216<br />
70<br />
32<br />
16 10<br />
YTJMAN STOCK.<br />
2,301<br />
2,149<br />
2,092<br />
53<br />
4<br />
123<br />
120<br />
47<br />
43<br />
854<br />
38<br />
857<br />
816<br />
807<br />
—<br />
Total.!<br />
41<br />
55<br />
45<br />
1,978<br />
1,851<br />
1,1<br />
37<br />
Under<br />
20<br />
yrs.<br />
16<br />
16<br />
802<br />
764<br />
32<br />
6<br />
78<br />
77<br />
35<br />
19<br />
15<br />
22<br />
20<br />
744<br />
715<br />
713<br />
2<br />
10<br />
61<br />
yrs.<br />
<strong>and</strong><br />
over.<br />
19<br />
327<br />
322<br />
319<br />
3<br />
TRIBE AND MIXTURE OF<br />
BLOOD.<br />
Both<br />
Total.!<br />
Under<br />
20<br />
yrs.<br />
20<br />
to<br />
50<br />
yrs.<br />
61<br />
yrs.<br />
<strong>and</strong><br />
over.
STOCKS AND TRIBES, BY SEX, AGE, AND BLOOD. 153<br />
INDIANS IN EACH STOCK AND TRIBE IN THE UNITED STATES, CLASSIFIED ACCORDING TO SEX AND AGE<br />
PERIODS, BY MIXTURE OP BLOOD: <strong>1910</strong>—Cont<strong>in</strong>ued.<br />
Table 5 1— Cont<strong>in</strong>ued.<br />
TSCBE Am> MIXTUBE OF<br />
BLOOD.<br />
Yavapai—Contd.<br />
Uixed blood—Cont<strong>in</strong>ued.<br />
Negro <strong>and</strong> <strong>Indian</strong><br />
Less than one-half Negro<br />
HaUNegro, half<strong>Indian</strong><br />
Blood not reported.<br />
Ytjma<br />
Full blood<br />
B^ill tribal<br />
Mixed tribal (two tribes)<br />
Tribal blood of one parent<br />
unlmown ,<br />
Mixed blood<br />
White <strong>and</strong> <strong>Indian</strong><br />
Half white.half<strong>Indian</strong><br />
More than one-hall<br />
white<br />
Unknown proportions<br />
("Mexican"^ mixture)<br />
Negro <strong>and</strong> <strong>Indian</strong> (half<br />
Negro, halt <strong>Indian</strong>)<br />
Blood not reported. . .<br />
Yuma Apache.<br />
Full blood (mixed tribal,<br />
three or more tribes)<br />
Total<br />
Full blood<br />
Full tribal<br />
Mixed tribal<br />
Two tribes<br />
Three or more tribes...<br />
Mixed blood<br />
White <strong>and</strong> <strong>Indian</strong><br />
Less than one-half<br />
white<br />
Half white, half <strong>Indian</strong><br />
More than one-half<br />
white<br />
O<strong>the</strong>r races, <strong>and</strong> <strong>Indian</strong><br />
(Ch<strong>in</strong>ese)<br />
.<br />
Both<br />
sexes.<br />
Total.!<br />
Under<br />
20<br />
yrs.<br />
51<br />
yrs.<br />
<strong>and</strong><br />
over.<br />
YTJMAN STOCK—Cont<strong>in</strong>ued.<br />
834<br />
816<br />
784<br />
24<br />
15<br />
435<br />
426<br />
413<br />
12<br />
15<br />
148<br />
140<br />
7<br />
196<br />
YUBOK STOC:^.<br />
S28<br />
514<br />
14<br />
13<br />
1<br />
140<br />
134<br />
46<br />
82<br />
327<br />
240<br />
6<br />
6<br />
Total.!<br />
1<br />
13<br />
399<br />
371<br />
17<br />
Under<br />
20<br />
yrs.<br />
161<br />
154<br />
141<br />
11<br />
20<br />
to<br />
50<br />
yis.<br />
166<br />
160<br />
51<br />
yrs.<br />
<strong>and</strong><br />
over.<br />
150 113 63 147 140 53<br />
TRIBE AND MIXTTIKE OP<br />
BLOOD.<br />
Total<br />
Both<br />
sexes.<br />
Total.!<br />
Under<br />
20<br />
yrs.<br />
51<br />
yrs.<br />
<strong>and</strong><br />
over.<br />
ZAPOTBCAN STOCK.<br />
Total.!<br />
Under<br />
20<br />
yrs.<br />
51<br />
yrs.<br />
<strong>and</strong><br />
over.
154 INDIANS IN THE UNITED STATES.<br />
INDIANS IN EACH STOCK AND TRIBE IN ALASKA, CLASSIFIED ACCORDING TO SEX AND AGE PERIODS, BY<br />
MIXTURE OF BLOOD: <strong>1910</strong>.<br />
Table 52
STOCKS AND TRIBES, BY SEX, AGE, AND BLOOD. 155<br />
INDIANS IN EACH STOCK AND TKIBE INALASBA, CLASSIFIED ACCORDING TO SEX AND AGE PERIODS, BY<br />
MIXTURE OF BLOOD: <strong>1910</strong>—Cont<strong>in</strong>ued.<br />
Table 52—Cont<strong>in</strong>ued.<br />
IBIBE MND MIXTUEE OF<br />
BLOOD.<br />
Both<br />
sexes.<br />
Total.!<br />
Under<br />
20
156 INDIANS IN THE UNITED STATES.<br />
INDIANS -IN EACH STOCK AND TRIBE IN ALASKA, CLASSIFIED ACCORDING TO SEX AND AGE PERIODS, BY<br />
MIXTURE OF BLOOD: <strong>1910</strong>—Cont<strong>in</strong>ued.<br />
Table 62—Ck>nt<strong>in</strong>ued.<br />
IBIBE AUS HIXTUBE 07<br />
BLOOD.<br />
Both
Information was collected by <strong>the</strong> Census Bureau <strong>in</strong><br />
<strong>1910</strong> ia regard to <strong>the</strong> number of children borne by<br />
every married woman. The results of <strong>the</strong> tabulation<br />
of this material for <strong>the</strong> <strong>Indian</strong> women are presented <strong>in</strong><br />
<strong>the</strong> follow<strong>in</strong>g discussion. Only those women were<br />
<strong>in</strong>cluded <strong>in</strong> <strong>the</strong> tabxilation who were between 15 <strong>and</strong><br />
44 years of age, who had been married for at least<br />
one year, <strong>and</strong> who were nei<strong>the</strong>r widowed nor divorced<br />
nor married a second or subsequent time. As a<br />
result of <strong>the</strong>se restrictions all <strong>the</strong> women <strong>in</strong>cluded<br />
<strong>in</strong> this tabulation answered <strong>the</strong> follow<strong>in</strong>g description:<br />
(1) They were of child-bear<strong>in</strong>g age; (2) had<br />
been married long enough to have children; <strong>and</strong> (3)<br />
were Uv<strong>in</strong>g <strong>in</strong> <strong>the</strong> married state at <strong>the</strong> time of <strong>the</strong><br />
enumeration.<br />
The last limitation makes possible <strong>the</strong> presentation<br />
of <strong>in</strong>formation about <strong>the</strong> husb<strong>and</strong> <strong>and</strong>, s<strong>in</strong>ce all<br />
second <strong>and</strong> subsequent marriages are excluded, <strong>the</strong><br />
children are <strong>in</strong> each case <strong>the</strong> offspr<strong>in</strong>g of <strong>the</strong> couple as<br />
shown on <strong>the</strong> schedule. In this manner most elements<br />
of uncerta<strong>in</strong>ty have been excluded, so that <strong>the</strong><br />
data lend <strong>the</strong>mselves to trustworthy <strong>in</strong>terpretation.<br />
In <strong>the</strong> tables of this section <strong>the</strong> degrees of mixture<br />
are given <strong>in</strong> <strong>the</strong> order of <strong>the</strong> <strong>in</strong>creas<strong>in</strong>g proportion of<br />
non-<strong>Indian</strong> blood, beg<strong>in</strong>n<strong>in</strong>g with marriages between<br />
full-blood <strong>Indian</strong>s <strong>and</strong> end<strong>in</strong>g with marriages between<br />
mixed-bloods <strong>and</strong> whites. The tables do not <strong>in</strong>clude<br />
all <strong>the</strong> possible comb<strong>in</strong>ations, but only those actually<br />
given on <strong>the</strong> schedules. Polygamous marriages, <strong>in</strong><br />
which husb<strong>and</strong> <strong>and</strong> wives are probably full-blood<br />
<strong>Indian</strong>s, are given separately at <strong>the</strong> end of <strong>the</strong> table.<br />
Sterility.— ^Table 53 presents <strong>the</strong> data on sterility.<br />
Table 53<br />
All classes.<br />
DEOBEE OF MZXTUKE.<br />
—<br />
Marriages among full-bloods<br />
Husb<strong>and</strong> <strong>and</strong> wife belong<strong>in</strong>g to same tribe<br />
Husb<strong>and</strong> <strong>and</strong> wife belong<strong>in</strong>g to different tribes.<br />
Mixed marriages ;<br />
Marriages of full-bloods with mrxed-bloods<br />
Wfle full blood, husb<strong>and</strong> white <strong>and</strong> <strong>Indian</strong>.<br />
Husb<strong>and</strong> full blood, wifewhite <strong>and</strong> <strong>Indian</strong>.<br />
Marriages of full-bloods with whites<br />
Wfie full blood, husb<strong>and</strong> white<br />
Husb<strong>and</strong> full blood, wife white<br />
Marriages among mixed-bloods<br />
Wfle white <strong>and</strong> <strong>Indian</strong>, husb<strong>and</strong> white<br />
<strong>and</strong> <strong>Indian</strong><br />
--<br />
Wife Negro <strong>and</strong> <strong>Indian</strong>, husb<strong>and</strong> Negro<br />
<strong>and</strong> <strong>Indian</strong><br />
;-••;<br />
Wife white, Negro, <strong>and</strong> <strong>Indian</strong>, husb<strong>and</strong><br />
white, Negro, <strong>and</strong> <strong>Indian</strong><br />
Marriages of mixed-bloods with.whites<br />
WMe white, husb<strong>and</strong> white <strong>and</strong> <strong>Indian</strong><br />
Husb<strong>and</strong> white, wife white <strong>and</strong> <strong>Indian</strong><br />
Polygamous marriages (husb<strong>and</strong> <strong>and</strong> wives probably<br />
full-blood <strong>Indian</strong>s)<br />
FECUNDITY AND VITALITY.<br />
WOMEN 15 TO 44 YEABS OF<br />
AQE, MABBIED ONE YEAR<br />
OB mobe: <strong>1910</strong>.<br />
Total<br />
number<br />
tabulated.<br />
21,S32<br />
10,379<br />
9,820<br />
559<br />
10,752<br />
1,508<br />
914<br />
208<br />
'3,' 970<br />
3,675<br />
101<br />
194<br />
6,066<br />
2,336<br />
2,730<br />
401<br />
Bear<strong>in</strong>g no<br />
children.<br />
Number. Per cent<br />
1,853<br />
1,111<br />
1,018<br />
93<br />
717<br />
133<br />
77<br />
56<br />
16<br />
16<br />
276<br />
254<br />
10<br />
12<br />
292<br />
174<br />
118<br />
25<br />
8.6<br />
10.7<br />
10.4<br />
16.6<br />
6.7<br />
8.8<br />
8.4<br />
9.4<br />
7.7<br />
7.7<br />
7.0<br />
6.9<br />
9.9<br />
6.2<br />
6.8<br />
7.4<br />
4.3<br />
6.2<br />
The most significant fact brought out by Table 53<br />
is that, while for aU classes of marriages <strong>the</strong> proportion<br />
result<strong>in</strong>g <strong>in</strong> no issue was 8.6 per cent <strong>and</strong> for marriages<br />
between full-bloods <strong>the</strong> proportion was 10.7 per<br />
cent, for mixed marriages it was only 6.7 per cent.<br />
Thus sterility is considerably less common <strong>in</strong> cases of<br />
miscegenation than <strong>in</strong> cases of marriage between fullbloods.<br />
Fur<strong>the</strong>rmore, <strong>the</strong> proportion of issueless marriages<br />
decreases directly as <strong>the</strong> amount of white blood<br />
<strong>in</strong> <strong>the</strong> married couple <strong>in</strong>creases. For <strong>the</strong> marriages of<br />
iull-bloods with mixed-bloods, where less than one-half<br />
of <strong>the</strong> blood was white, <strong>the</strong> percentage of sterility was<br />
8.8 ; for <strong>the</strong> marriages of full-bloods with whites, where<br />
one-half of <strong>the</strong> blood was white, <strong>the</strong> proportion of sterility<br />
was 7.7 per cent; for <strong>the</strong> marriages between<br />
mixed-bloods, where <strong>the</strong> proportion of white blood<br />
may have varied considerably but was probably one-<br />
half or more, sterility was shown <strong>in</strong> 7 per cent of <strong>the</strong><br />
cases; <strong>and</strong> f<strong>in</strong>ally, for marriages of mixed-bloods with<br />
whites, where more than one-half <strong>and</strong> often threefourths<br />
or more of <strong>the</strong> blood was white, <strong>the</strong> percentage<br />
of sterility was only 5.8. Thus an <strong>in</strong>verse relation<br />
between <strong>the</strong> amount of white blood <strong>in</strong> <strong>the</strong> married<br />
couple <strong>and</strong> <strong>the</strong> proportion of childless unions seems to<br />
be established by <strong>the</strong> table.<br />
In <strong>the</strong> case of polygamous marriages no separation<br />
by blood was made, but, as po<strong>in</strong>ted out previously,<br />
<strong>the</strong>se are almost without exception marriages between<br />
full-blood women <strong>and</strong> fuU-blood men, as such mar-<br />
riages were made, as a rule, a good many years ago.<br />
As a group, <strong>the</strong>n, by blood <strong>the</strong>se cases of plural wives<br />
may be compared with <strong>the</strong> fuU-blood groups already<br />
considered. It is apparent on comparison that<br />
women liv<strong>in</strong>g <strong>in</strong> polygamy show a considerably<br />
smaller percentage of steriHty than those <strong>in</strong> monogamous<br />
unions.<br />
Fecundity.—Table 54 deals only with women who<br />
have been married from 10 to 20 years, <strong>in</strong>clusive, <strong>and</strong><br />
dist<strong>in</strong>guishes those who have borne no more than two<br />
children (<strong>in</strong>clud<strong>in</strong>g those who have borne no children)<br />
from those who have borne from three to five children,<br />
<strong>and</strong> six or more children, as shown by <strong>the</strong> returns for<br />
<strong>1910</strong>.<br />
A comparison of <strong>the</strong> figures for marriages between<br />
full-bloods with mixed marriages shows <strong>the</strong> greater<br />
fertility of <strong>the</strong> latter; a smaller proportion resulted <strong>in</strong><br />
two children or less <strong>and</strong> <strong>in</strong> from three to five children<br />
than <strong>in</strong> <strong>the</strong> case of <strong>the</strong> pure marriages <strong>and</strong> a much<br />
higher proportion <strong>in</strong> six or more children.<br />
A fur<strong>the</strong>r analysis of mixed marriages shows, however,<br />
that as far as <strong>the</strong> number of children is concerned<br />
<strong>the</strong> proportion of white blood does not materially<br />
<strong>in</strong>fluence <strong>the</strong> offspr<strong>in</strong>g. In fact, <strong>the</strong> marriages between<br />
fuU-blood <strong>Indian</strong>s <strong>and</strong> whites are more prolific<br />
(157)
158 INDIANS IN THE UNITED STATES.<br />
than any of <strong>the</strong> o<strong>the</strong>r ma<strong>in</strong> classes of mixed marriages.<br />
Of <strong>the</strong> subclasses under "Marriages among mixedbloods,"<br />
<strong>the</strong> marriages between <strong>Indian</strong> <strong>and</strong> Negro<br />
mixed-bloods showed <strong>the</strong> greatest fertUity, more than<br />
half of such marriages result<strong>in</strong>g <strong>in</strong> six or more children.<br />
Table 54<br />
All classes.<br />
DEGREE OP MIXTTTKE.<br />
Marriages among full-bloods<br />
Husb<strong>and</strong> <strong>and</strong> wife belong<strong>in</strong>g to same tribe<br />
Husb<strong>and</strong> <strong>and</strong> wife belong<strong>in</strong>g to different tribes.<br />
Mixed marriage<br />
Marriages of full-bloods with mixed-bloods<br />
Wife full blood, husb<strong>and</strong> wUte <strong>and</strong> <strong>Indian</strong>.<br />
Husb<strong>and</strong> full blood, wife wbite <strong>and</strong> <strong>Indian</strong>.<br />
Marriages of full-bloods with whites..<br />
Wue full blood, husb<strong>and</strong> white .<br />
Husb<strong>and</strong> full blood, wife white .<br />
Marriages among mixed-bloods<br />
Wife white <strong>and</strong> <strong>Indian</strong>, husb<strong>and</strong> white <strong>and</strong> <strong>Indian</strong>.<br />
Wife Negro <strong>and</strong> <strong>Indian</strong>, husb<strong>and</strong> Negro <strong>and</strong> <strong>Indian</strong><br />
Wife white, Negro, <strong>and</strong> <strong>Indian</strong>, husb<strong>and</strong> white, Negro, <strong>and</strong> <strong>Indian</strong> 1<br />
Marriages of mixed-bloods with whites<br />
Wife white, husb<strong>and</strong> wMte <strong>and</strong> <strong>Indian</strong><br />
Husb<strong>and</strong> white, wife wliite <strong>and</strong> <strong>Indian</strong>.<br />
Polygamous marriages (husb<strong>and</strong> <strong>and</strong> wives probably fuIl-blood <strong>Indian</strong>s) .<br />
The average number of children per marriage, by<br />
degree of mixture of blood, is shown <strong>in</strong> Table 55.<br />
Table 65<br />
Polygamous marriages, as compared with monogamous<br />
marriages between fuU-bloods, showed a smaller<br />
proportion hav<strong>in</strong>g had only two children <strong>and</strong> three to<br />
five children, <strong>and</strong> a larger proportion hav<strong>in</strong>g had six<br />
or more.<br />
Total<br />
number<br />
tabulated.<br />
7,548<br />
3,658<br />
3,480<br />
178<br />
3,745<br />
630<br />
324<br />
206<br />
90<br />
1,385<br />
1,286<br />
36<br />
63<br />
1,740<br />
777<br />
963<br />
145<br />
WOMEN 15 TO 44 YEABS Or AGE, MABKIED 10 TO 20 TEARS: <strong>1910</strong>.<br />
Not more<br />
than two<br />
children.<br />
200<br />
183<br />
7<br />
10<br />
250<br />
126<br />
124<br />
Number bearlng-<br />
Three<br />
to five<br />
children.<br />
3,391<br />
1,739<br />
1,655<br />
1,587<br />
221<br />
137<br />
84<br />
39<br />
39<br />
539<br />
'508<br />
788<br />
349<br />
439<br />
65<br />
Six or<br />
more<br />
children.<br />
1,203<br />
1,145<br />
58<br />
1,626<br />
234<br />
145<br />
646<br />
595<br />
20<br />
31<br />
702<br />
302<br />
400<br />
Not more<br />
than two<br />
children.<br />
16.9<br />
19.6<br />
19.6<br />
20.2<br />
14.2<br />
14.2<br />
13.0<br />
16.0<br />
7.8<br />
7.8<br />
14.4<br />
14.2<br />
19.4<br />
15.9<br />
14.4<br />
16.2<br />
12.9<br />
17.2<br />
Per cent bear<strong>in</strong>g—<br />
Three<br />
to five<br />
children.<br />
44.9<br />
47.5<br />
47.6<br />
47.2<br />
4i2.4<br />
41.7<br />
42.3<br />
40.8<br />
43.3<br />
43.3<br />
38.9<br />
39.5<br />
23.0<br />
34.9<br />
45.3<br />
44.9<br />
45.6<br />
44.8<br />
Six or<br />
more<br />
children.<br />
38.2<br />
32.9<br />
32.9<br />
32.6<br />
43.4<br />
44.2<br />
44.8<br />
43.2<br />
48.9<br />
48.9<br />
46.6<br />
46.3<br />
55.6<br />
49.2<br />
40.3<br />
38.9<br />
41.5<br />
37.9-
For all classes of marriages <strong>the</strong> proportion of sur-<br />
viv<strong>in</strong>g children was 74.7 per cent; for pure marriages it<br />
was 69.7 per cent, <strong>and</strong> for mixed marriages 79 per cent.<br />
A fur<strong>the</strong>r analysis of <strong>the</strong> mixed marriages shows that<br />
<strong>the</strong> percentages of children surviv<strong>in</strong>g were highest<br />
among children one of whose parents was white. Thus<br />
for marriages between full-bloods <strong>and</strong> whites <strong>the</strong> pro-<br />
portion of surviv<strong>in</strong>g children was 82.9 per cent, <strong>and</strong> for<br />
marriages between mixed-bloods <strong>and</strong> whites <strong>the</strong> proportion<br />
was 83 per cent, while for marriages among<br />
mixed-bloods it was only 77.6 per cent, <strong>and</strong> for marri-<br />
ages between fuU-bloods <strong>and</strong> mixed-bloods only 69.9<br />
per cent, or only slightly higher than for marriages between<br />
full-bloods (69.7 per cent), In <strong>the</strong> case of polygamous<br />
marriages a larger percentage of children<br />
survive than <strong>in</strong> full-blood monogamous marriages.<br />
The figures br<strong>in</strong>g out <strong>the</strong> fact that a larger propor-<br />
tion of <strong>the</strong> children hav<strong>in</strong>g one white parent survive<br />
than of children both of whose parents are full-blood<br />
or mixed-blood <strong>Indian</strong>s, but do not <strong>in</strong> <strong>the</strong>mselves show<br />
whe<strong>the</strong>r this is due to conditions <strong>in</strong> <strong>the</strong> home or to<br />
greater virility of <strong>the</strong> offspr<strong>in</strong>g.<br />
Fur<strong>the</strong>r evidence bear<strong>in</strong>g on this po<strong>in</strong>t may be<br />
ga<strong>the</strong>red by compar<strong>in</strong>g <strong>the</strong> relative vitality of <strong>the</strong> chil-<br />
dren of fuU-blood <strong>and</strong> mixed-blood parents, accord<strong>in</strong>g<br />
to <strong>the</strong> size of <strong>the</strong> family, observ<strong>in</strong>g whe<strong>the</strong>r <strong>the</strong> larger<br />
famihes which are characteristic of <strong>the</strong> mixed-bloods<br />
show a greater or less degree of vitality than <strong>the</strong><br />
smaller families of <strong>the</strong> fuU-bloods, <strong>and</strong> also <strong>the</strong> relative<br />
vitality of families of <strong>the</strong> same size <strong>in</strong> <strong>the</strong> various<br />
classes by blood.<br />
In <strong>the</strong> follow<strong>in</strong>g table three groups by blood are<br />
alone considered, <strong>in</strong> order to secure sufficiently large<br />
numbers to be of some value: (1) both parents of full<br />
blood of <strong>the</strong> same tribe, (2) both parents of mixed<br />
blood (white <strong>and</strong> <strong>Indian</strong>), (3) one parent mixed blood<br />
(white <strong>and</strong> <strong>Indian</strong>), <strong>the</strong> o<strong>the</strong>r white. For each of<br />
<strong>the</strong>se three groups, <strong>and</strong> for famihes of vary<strong>in</strong>g size,<br />
<strong>the</strong> percentage of cases occurr<strong>in</strong>g where aU <strong>the</strong> children<br />
bom survive, is shown. Only those cases, moreover,<br />
are tabulated where <strong>the</strong> mo<strong>the</strong>r has been mar-<br />
ried from 10 to 20 years.<br />
Table 67<br />
FECUNDITY AND VITALITY. 159
160 INDIANS IN THE UNITED STATES.<br />
husb<strong>and</strong>a also of full blood of <strong>the</strong> same tribe, <strong>and</strong> mixed-blood<br />
women of white <strong>and</strong> <strong>Indian</strong> blood, with husb<strong>and</strong>s also of mixed<br />
blood, are considered. It has also been necessary, <strong>in</strong> order to secure<br />
numbers of any size, to make no dist<strong>in</strong>ction of <strong>the</strong> number of years<br />
married, but to <strong>in</strong>clude women married from 1 to 10 years.<br />
TBIBE OB QBOUF.<br />
Cherokee (OHb.)..<br />
Chippewa<br />
Sioiuc(alI)<br />
W. Wash<strong>in</strong>gton<br />
(ma<strong>in</strong>lj Sal&h)..<br />
Apache<br />
Navajo<br />
Yuman,<br />
PEE CENT BEAEINQ<br />
NO CHILDEEN.<br />
Parents<br />
full hlood,<br />
same<br />
tribe.<br />
7.3<br />
10.3<br />
7.6<br />
3.9<br />
7.9<br />
9.3<br />
17. S<br />
Parents<br />
mixed<br />
(white<br />
<strong>and</strong><br />
<strong>Indian</strong>).<br />
AVESAOE NUMBEB<br />
OF CHILDBEN<br />
BOBNE.<br />
Parents<br />
full blood.<br />
tribe.<br />
3.7<br />
3.7<br />
4.1<br />
4.S<br />
3.7<br />
3.5<br />
2.-2<br />
Parents<br />
mixed<br />
(white<br />
<strong>and</strong><br />
<strong>Indian</strong>).<br />
3.5<br />
4.6<br />
4.1<br />
1 Number too small for computation.<br />
PER CENT SUBVrVmo<br />
OF TOTAL<br />
CHILDREN BORNE.<br />
Parents<br />
full blood,<br />
same<br />
tribe.<br />
71.8<br />
64.2<br />
56.4<br />
56.6<br />
69.4<br />
85.9<br />
81.3<br />
Parents<br />
mixed<br />
(white<br />
<strong>and</strong><br />
<strong>Indian</strong>).<br />
82.0<br />
72.7<br />
77.6<br />
, The most strik<strong>in</strong>g po<strong>in</strong>ts brought out by this table are: (1) That<br />
<strong>the</strong> tribes (ma<strong>in</strong>ly belong<strong>in</strong>g to <strong>the</strong> Salishan stock) of western<br />
Waah<strong>in</strong>gton show <strong>the</strong> smallest proportion of sterility, <strong>and</strong> <strong>the</strong> largest<br />
average number of children borne, but at <strong>the</strong> same time <strong>the</strong> next<br />
to <strong>the</strong> smallest proportion surviv<strong>in</strong>g, at least <strong>in</strong> <strong>the</strong> case of <strong>the</strong> full-<br />
bloods; (2) that <strong>the</strong> Yuman tribes of Arizona <strong>and</strong> sou<strong>the</strong>rn California<br />
show <strong>the</strong> largest proportion of steriHly <strong>and</strong> <strong>the</strong> smallest average<br />
number of children borne, but at <strong>the</strong> same time have next to <strong>the</strong><br />
largest proportion surviv<strong>in</strong>g; (3) <strong>the</strong> general agreement between <strong>the</strong><br />
full-bloods of <strong>the</strong> Sioux <strong>and</strong> Cherokee (of Oklahoma only) <strong>in</strong> per<br />
centage of sterility <strong>and</strong> average number of children borne, but<br />
<strong>the</strong>ir difference <strong>in</strong> favor of <strong>the</strong> latter <strong>in</strong> regard to <strong>the</strong> proportion of<br />
children surviv<strong>in</strong>g; <strong>and</strong> (4) that <strong>in</strong> <strong>the</strong> case of <strong>the</strong> Sioux, <strong>the</strong> usual<br />
<strong>in</strong>crease <strong>in</strong> <strong>the</strong> average number of children borne as shown by<br />
<strong>the</strong> mixed-bloods does not occur.<br />
These <strong>and</strong> o<strong>the</strong>r differences apparent on a study of <strong>the</strong> figures<br />
for <strong>in</strong>dividual tribes are <strong>in</strong> many ways suggestive both of economic<br />
<strong>and</strong> possible environmental <strong>in</strong>fluences or of actual differences between<br />
different stocks. It is, for example, possibly significant that<br />
<strong>the</strong> smallest average number of children borne <strong>and</strong> <strong>the</strong> largest pro-<br />
portion of sterility occur <strong>in</strong> <strong>the</strong> arid region of <strong>the</strong> southwest,<br />
whereas <strong>the</strong> largest number of children borne <strong>and</strong> smallest proportion<br />
of sterility are <strong>in</strong> <strong>the</strong> moist coastal regplon of western Wash<strong>in</strong>g-<br />
ton, <strong>the</strong> drier but not arid region of <strong>the</strong> pla<strong>in</strong>s (represented by <strong>the</strong><br />
Sioux <strong>and</strong> Cherokees) fall<strong>in</strong>g between <strong>the</strong>se two extremes. Somewhat<br />
similarly, <strong>the</strong> Southwest shows <strong>the</strong> largest proportion of children<br />
surviv<strong>in</strong>g, <strong>the</strong> region of western Wash<strong>in</strong>gton <strong>the</strong> smallest, with<br />
<strong>the</strong> pla<strong>in</strong>s averag<strong>in</strong>g somewhere <strong>in</strong> between. These statements are<br />
true only, of course, <strong>in</strong> a general way, but it is possible that a hot <strong>and</strong><br />
arid region of ra<strong>the</strong>r deficient food supply, ma<strong>in</strong>ly of vegetable ori-<br />
g<strong>in</strong>, tends to reduce <strong>the</strong> number of children borne, although it is<br />
favorable to <strong>the</strong> survival of those children who are bom; whereas,<br />
an equable, moist area,' of abundant food supply (<strong>in</strong>clud<strong>in</strong>g much<br />
fish, toge<strong>the</strong>r with game <strong>and</strong> vegetable products) may tend to a<br />
greater fertility on <strong>the</strong> part of <strong>the</strong> women, but be at <strong>the</strong> same time<br />
less favorable to <strong>the</strong> survival of <strong>the</strong> larger number of children borne.<br />
Economic factors are, however, of such weight that much more<br />
abundant materials would be needed before def<strong>in</strong>ite conclusions<br />
could be drawn.
The statistics here given have reference to <strong>the</strong><br />
marital status of <strong>the</strong> <strong>Indian</strong> <strong>population</strong> at <strong>the</strong> time<br />
when <strong>the</strong> census was taken, so that a person, for<br />
<strong>in</strong>stance, who had been widowed or divorced, but had<br />
been remarried, would be reported as married.<br />
AU ages.—Table 59 shows, for <strong>the</strong> <strong>United</strong> <strong>States</strong><br />
<strong>and</strong> for <strong>Alaska</strong>, <strong>the</strong> marital condition of <strong>the</strong> <strong>Indian</strong><br />
<strong>population</strong>, by sex, as reported at <strong>the</strong> census of <strong>1910</strong>.<br />
Table 59<br />
MARITAL CONDITION.
162 INDIANS IN THE UNITED STATES.<br />
The marital condition of <strong>the</strong> <strong>Indian</strong> <strong>population</strong> 15<br />
years of age <strong>and</strong> over <strong>in</strong> <strong>1910</strong> is shown for <strong>the</strong> <strong>United</strong><br />
<strong>States</strong>, by divisions <strong>and</strong> states, <strong>in</strong> Table 65 (p. 164)<br />
<strong>and</strong> for each stock <strong>and</strong> tribe hav<strong>in</strong>g at least 200<br />
Table 62<br />
members <strong>in</strong> Table 66 (p. 165). A summary of <strong>the</strong><br />
statistics of marital condition for each pr<strong>in</strong>cipal stock<br />
<strong>in</strong> <strong>the</strong> <strong>United</strong> <strong>States</strong> <strong>and</strong> <strong>in</strong> <strong>Alaska</strong> is given <strong>in</strong><br />
Table 62.
Table 63<br />
AGE FEEIOD.<br />
<strong>United</strong> <strong>States</strong>..<br />
Under 15 years<br />
15 years <strong>and</strong> over<br />
15 to 19 years<br />
20 to 24 years<br />
25 to 29 years<br />
30 to 34 years<br />
35 to 44 years<br />
45 to 54 years<br />
55 to 64 years<br />
65 years <strong>and</strong> over<br />
Age unknown<br />
<strong>Alaska</strong>..<br />
.<br />
Total.<br />
Number.<br />
S<strong>in</strong>gle.<br />
Per<br />
cent.<br />
MARITAL CONDITION. 163<br />
INDIAN males: <strong>1910</strong>.<br />
Married.<br />
Number.<br />
Per<br />
cent.<br />
Widowed.<br />
Number.<br />
Per<br />
cent.<br />
5-sfe<br />
Total.<br />
Nmnber.<br />
S<strong>in</strong>gle.<br />
Per<br />
cent.<br />
INDIAN females: <strong>1910</strong>.<br />
Married.<br />
Number.<br />
Per<br />
cent.<br />
Widowed.<br />
135,133 82,133 60.8 46, 162 34.2 5,319 3.9 679 840 130,550 9,850 53.5 49, 134 37.6 10,074 7.7 533<br />
54,750<br />
80,383<br />
14,612<br />
11,265<br />
9,237<br />
7,756<br />
13,847<br />
10,017<br />
7,038<br />
6,130<br />
481<br />
12,995<br />
Under 15 years 4,901<br />
15 years <strong>and</strong> over.<br />
IS to 19 years<br />
20 to 24 years<br />
25 to 29 years<br />
30 to 34 years<br />
85 to 44 years<br />
45 to 54 years<br />
55 to 64 years<br />
65 years <strong>and</strong> over.<br />
Age unknown<br />
8,094<br />
1,285<br />
1,138<br />
1,090<br />
929<br />
1,614<br />
1,040<br />
543<br />
377<br />
78<br />
54,742<br />
27,391<br />
13,922<br />
7,160<br />
2,712<br />
1,258<br />
1,210<br />
540<br />
291<br />
207<br />
91<br />
7,296<br />
4,901<br />
2,395<br />
1,192<br />
687<br />
275<br />
104<br />
79<br />
22<br />
8<br />
7<br />
21<br />
100.0<br />
34.1<br />
95.3<br />
63.6<br />
29.4<br />
16.2<br />
8.7<br />
5.4<br />
4.1<br />
3.4<br />
18.9<br />
56.1<br />
100.0<br />
29.6<br />
92.8<br />
60.4<br />
25.2<br />
11.2<br />
4.9<br />
2.1<br />
1.5<br />
1.9<br />
26.9<br />
8<br />
46,154<br />
413<br />
3,754<br />
6,102<br />
6,032<br />
11,572<br />
8,370<br />
5,580<br />
4,149<br />
182<br />
5,037<br />
5,037<br />
49<br />
420<br />
765<br />
759<br />
1,411<br />
898<br />
428<br />
259<br />
48<br />
(')<br />
57.4<br />
2.8<br />
33.3<br />
66.1<br />
77.8<br />
83.6<br />
83.6<br />
79.3<br />
67.7<br />
37.8<br />
38. i<br />
62.2<br />
3.8<br />
36.9<br />
70.2<br />
81.7<br />
87.4<br />
86.3<br />
78.8<br />
68.7<br />
61.5<br />
5,319<br />
13<br />
141<br />
269<br />
336<br />
832<br />
953<br />
1,076<br />
1,673<br />
26<br />
528<br />
528<br />
1<br />
10<br />
32<br />
54<br />
108<br />
109<br />
104<br />
104<br />
The per cent distribution of <strong>Indian</strong>s <strong>in</strong> each age<br />
group accord<strong>in</strong>g to marital condition is compared<br />
with a similar distribution for whites <strong>and</strong> Negroes <strong>in</strong><br />
<strong>the</strong> <strong>United</strong> <strong>States</strong> <strong>in</strong> <strong>1910</strong> <strong>in</strong> Table 64.<br />
Table 64<br />
6.6<br />
0.1<br />
1.3<br />
2.9<br />
4.3<br />
6.0<br />
9.6<br />
15.3<br />
27.3<br />
5.4<br />
4.1<br />
6.5<br />
0.1<br />
0.9<br />
2.9<br />
5.8<br />
6.7<br />
10.5<br />
19.2<br />
27.6<br />
7.7<br />
679<br />
12<br />
60<br />
96<br />
100<br />
184<br />
112<br />
61<br />
53<br />
1<br />
57<br />
840<br />
252<br />
150<br />
58<br />
30<br />
49<br />
42<br />
30<br />
48<br />
181<br />
77<br />
1 Less than one-tenth of 1 per cent.<br />
53,568<br />
76,982<br />
13,874<br />
10,579<br />
8,900<br />
7,487<br />
12,948<br />
9,213<br />
6,657<br />
6,856<br />
12,336<br />
4,636<br />
7,700<br />
1,212<br />
1,187<br />
1,014<br />
946<br />
1,467<br />
896<br />
652<br />
340<br />
86<br />
53,526<br />
16,324<br />
10,789<br />
3,229<br />
1,008<br />
422<br />
368<br />
184<br />
125<br />
146<br />
5,557<br />
4,631<br />
926<br />
670<br />
137<br />
46<br />
23<br />
22<br />
6<br />
4<br />
2<br />
16<br />
99.9<br />
21.2<br />
77.8<br />
30.5<br />
11.3<br />
5.6<br />
2.8<br />
2.0<br />
1.9<br />
2.1<br />
13.6<br />
45.0<br />
99.9<br />
12.0<br />
55.3<br />
11.5<br />
4.6<br />
2.4<br />
1.5<br />
0.7<br />
0.7<br />
0.6<br />
18.6<br />
49,095<br />
2,723<br />
6,827<br />
7,351<br />
6,477<br />
11,286<br />
7,346<br />
4,303<br />
2,568<br />
224<br />
5,S<br />
5<br />
5,587<br />
507<br />
1,003<br />
907<br />
846<br />
1,254<br />
644<br />
275<br />
99<br />
52<br />
0.1<br />
63.8<br />
19.8<br />
64.5<br />
82.6<br />
86.5<br />
87.2<br />
79.7<br />
64.6<br />
37.3<br />
47.9<br />
45.3<br />
0.1<br />
72.6<br />
41.8<br />
84.5<br />
89.4<br />
89.4<br />
85.5<br />
71.9<br />
49.8<br />
29.1<br />
60.5<br />
Number.<br />
3<br />
10,071<br />
99<br />
305<br />
365<br />
443<br />
1,094<br />
1,640<br />
2,113<br />
4,038<br />
74<br />
1,078<br />
1,078<br />
15<br />
36<br />
45<br />
65<br />
167<br />
234<br />
268<br />
239<br />
Per<br />
cent.<br />
(')<br />
13.1<br />
0.7<br />
2.9<br />
4.1<br />
5.9<br />
8.4<br />
16.7<br />
31.7<br />
58.9<br />
15.8<br />
8.7<br />
14.0<br />
1.2<br />
3.0<br />
4.4<br />
6.9<br />
11.4<br />
26.1<br />
48.6<br />
70.3<br />
10.5<br />
65<br />
158<br />
147<br />
127<br />
187<br />
118<br />
88<br />
64<br />
5<br />
70<br />
533<br />
198<br />
60<br />
29<br />
18<br />
23<br />
25<br />
28<br />
50<br />
102<br />
39<br />
39<br />
15<br />
4<br />
1<br />
1<br />
2<br />
5<br />
2
"t<br />
164 INDIANS IN THE UNITED STATES.<br />
MARITAL CONDITION OF THE INDIAN POPULATION 15 YEARS OP AGE AND OVER, BY DIVISIONS AND<br />
STATES: <strong>1910</strong>.<br />
Table 65
MARITAL CONDITION. 165<br />
MARITAL CONDITION OF THE INDIAN POPULATION 15 YEARS OF AGE AND OVER IN THE UNITED STATES BY<br />
PRINCIPAL STOCKS AND TRIBES: <strong>1910</strong>.<br />
Table 66<br />
[This table shows each stock <strong>and</strong> tribe hav<strong>in</strong>g 200 or more <strong>Indian</strong>s <strong>in</strong> <strong>1910</strong>. Per cent not shown where base is less than 50.]
166 INDIANS IN THE UNITED STATES.<br />
MAKITAL CONDITION OP THE INDIAN POPULATION 15 YEARS OF AGE AND OVER IN THE UNITED STATES, BY<br />
PRINCIPAL STOCKS AND TRIBES: 19ia-Contmued.<br />
Table 6e-Contd.<br />
IThis table shows each stock <strong>and</strong> tribe hav<strong>in</strong>g 200 or more <strong>Indian</strong>s <strong>in</strong> <strong>1910</strong>. Per cent not shown where base is less than 60.]
MARITAL CONDITION. 167<br />
MARITAL CONDITION OF THE INDIAN POPULATION 15 YEAES OP AGE AND OVER IN THE UNITED STATES, BY<br />
PRINCIPAL STOCKS AND TRIBES: igiO-Cont<strong>in</strong>ued.<br />
Table 66—Contd.<br />
[Tliis table shows each stock <strong>and</strong> tribe hav<strong>in</strong>g 200 or jpore <strong>Indian</strong>a <strong>in</strong> <strong>1910</strong>. Per cent not shown where base is less than 50.]
168 INDIANS IN THE UNITED STATES.<br />
MARITAL CONDITION OF THE INDIAN POPLTLATION 15 YEARS OF AGE AND OVER, CLASSIFIED BY AGE PERIODS,<br />
FOR 22 SELECTED STATES: <strong>1910</strong>.<br />
Table 67<br />
[Per cent not shown where base is less than SO.]
MARITAL CONDITION. 169<br />
MARITAL CONDITION OF THE INDIAN POPULATION 15 YEARS OP AGE AND OVER, CLASSIFIED BY AGE PERIODS,<br />
FOR 22 SELECTED STATES: <strong>1910</strong>—Cont<strong>in</strong>ued.<br />
Table 67—Contd.<br />
[Per cent not shown where base is less thaifL 50.]
170 INDIANS IN THE UNITED STATES.<br />
MARITAL CONDITION OF THE INDIAN POPULATION 15 YEARS OF AGE AND OVER, CLASSIFIED BY AGE PERIODS,<br />
FOR 22 SELECTED STATES: <strong>1910</strong>—Contmued.<br />
Table 67—Contd.<br />
[Per cent not shown where base is less than 50.]
MARITAL CONDITION. 171<br />
MARITAL CONDITION OF THE INDIAN POPULATION 15 YEARS OF AGE AND OVER IN THE UNITED STATES AND<br />
ALASKA, CLASSIFIED BY AGE PERIODS, BY PRINCIPAL STOCKS: <strong>1910</strong>.<br />
Table 68<br />
[This table shows each stock hav<strong>in</strong>g 200 or more <strong>Indian</strong>s tn <strong>1910</strong>. Per cent not shown where base is less than 50.]
172 INDIANS IN THE UNITED STATES.<br />
MARITAL CONDITION OF THE INDIAN POPULATION 15 YEARS OF AGE AND OVER IN THE UNITED STATES AND<br />
ALASKA, CLASSIFIED BY AGE PERIODS, BY PRINCIPAL STOCKS: 191(>-ContLQued.<br />
Table 68—Cont<strong>in</strong>ued.<br />
STOCK AND AGE FEBIOD.<br />
[TUs table shows each stock hav<strong>in</strong>g 200 or more <strong>Indian</strong>s In <strong>1910</strong>. Per cent not shown where base is less than 60.]<br />
Total.<br />
nroUN MALES 15 TEAKS OF AGE AND OVER: <strong>1910</strong>.<br />
Staigle.<br />
Number.<br />
Per<br />
cent.<br />
Married.<br />
Number.<br />
Per<br />
cent.<br />
Widowed.<br />
Divorced.<br />
Marital<br />
condition<br />
not reported.<br />
UNITED STATES—Cont<strong>in</strong>ued.<br />
Total.<br />
INDIAN FEMALES 15 TEAKS OP AGE AND OVER: <strong>1910</strong>.<br />
Number.<br />
S<strong>in</strong>gle.<br />
Per<br />
cent.<br />
Married.<br />
Number.<br />
Per<br />
cent.<br />
Widowed.<br />
Divorced.<br />
Marital<br />
condition<br />
not reported.
MARITAL CONDITION. 173<br />
MARITAL CONDITION OF THE INDIAN POPULATION 15 YEARS OF AGE AND OVER IN THE UNITED STATES AND<br />
ALASKA, CLASSIFIED BY AGE PERIODS, BY PRINCIPAL STOCKS: <strong>1910</strong>-Cont<strong>in</strong>ued.<br />
Table 68—Cont<strong>in</strong>ued.<br />
'<br />
[This table shows each stock hav<strong>in</strong>g 200 or more <strong>Indian</strong>s <strong>in</strong> <strong>1910</strong>. Per cent not shown where hase is less than 60.]
174 INDIANS IN THE UNITED STATES.<br />
MARITAL CONDITION OF THE INDIAN POPULATION 15 YEARS OP AGE AND OVER IN THE UNITED STATES AND<br />
ALASKA, CLASSIFIED BY AGE PERIODS, BY PRINCIPAL STOCKS: <strong>1910</strong>—Cont<strong>in</strong>ued.<br />
Table 68 —Cont<strong>in</strong>ued.<br />
[This table shows each stock hav<strong>in</strong>g 200 or more <strong>Indian</strong>s In <strong>1910</strong>. Per cent not shown where base is less than SO.]
MARITAL CONDITION. 175<br />
MARITAL CONDITION OF THE INDIAN POPULATION 15 YEARS OP AGE AND OVER IN THE UNITED STATES,<br />
CLASSIFIED BY AGE PERIODS, BY PRINCIPAL TRIBES AND PRINCIPAL STATES: <strong>1910</strong>.<br />
Table 69<br />
[This table shows each tribe hav<strong>in</strong>g 350 or more <strong>Indian</strong>s <strong>in</strong> <strong>1910</strong>.]
176 INDIANS IN THE UNITED STATES.<br />
MARITAL CONDITION OF THE INDIAN POPULATION 15 YEARS OF AGE AND OVER IN THE UNITED STATES,<br />
CLASSIFIED BY AGE PERIODS, BY PRINCIPAL TRIBES AND PRINCIPAL STATES: <strong>1910</strong>—Cont<strong>in</strong>ued.<br />
Table 69—Cont<strong>in</strong>ued.<br />
[This table shows each tribe hav<strong>in</strong>g 350 or more <strong>Indian</strong>s <strong>in</strong> <strong>1910</strong>.]
MARITAL CONDITION. 177<br />
MARITAL CONDITION OF THE INDIAN POPULATION 15 YEARS OF AGE AND OVER IN THE UNITED STATES,<br />
CLASSIFIED BY AGE PERIODS, BY PRINCIPAL TRIBES AND PRINCIPAL STATES: <strong>1910</strong>—Cont<strong>in</strong>ued.<br />
Table 69—Cont<strong>in</strong>ued.<br />
[This table shows each tribe hav<strong>in</strong>g 350 or more <strong>Indian</strong>s <strong>in</strong> <strong>1910</strong>.]
178 INDIANS IN THE UNITED STATES.<br />
MARITAL CONDITION OF THE INDIAN POPULATION 15 YEARS OF AGE AND OVER IN THE UNITED STATES,<br />
CLASSIFIED BY AGE PERIODS, BY PRINCIPAL TRIBES AND PRINCIPAL STATES: <strong>1910</strong>—Cont<strong>in</strong>ued.<br />
Table 69—Cont<strong>in</strong>ued.<br />
[This table shows each tribe hav<strong>in</strong>g 350 or more <strong>Indian</strong>s <strong>in</strong> <strong>1910</strong>.]
MARITAL CONDITION. 179<br />
MARITAL CONDITION OP THE INDIAN POPULATION 15 YEARS OF AGE AND OVER IN THE UNITED STATES,<br />
CLASSIFIED BY AGE PERIODS, BY PRINCIPAL TRIBES AND PRINCIPAL STATES: <strong>1910</strong>-Coiiti<strong>in</strong>ied.<br />
Table 69—Cont<strong>in</strong>ued.<br />
[TWs table shows each tribe hav<strong>in</strong>g 360 or more <strong>Indian</strong>s <strong>in</strong> <strong>1910</strong>.]
180 INDIANS IN THE UNITED STATES.<br />
MARITAL CONDITION OP THE INDIAN POPULATION 15 YEARS OF AGE AND OVER IN THE UNITED STATES,<br />
CLASSIFIED BY AGE PERIODS, BY PRINCIPAL TRIBES AND PRINCIPAL STATES: <strong>1910</strong>—Cont<strong>in</strong>ued.<br />
Table 69—Cont<strong>in</strong>ued.<br />
[This table shows each tribe hav<strong>in</strong>g 350 or more <strong>Indian</strong>s <strong>in</strong> <strong>1910</strong>.]
MARITAL CONDITION.<br />
MARITAL CONDITION OF THE INDIAN POPULATION 15 YEARS OF AGE AND OVER IN THE UNITED STATES,<br />
CLASSIFIED BY AGE PERIODS, BY PRINCIPAL TRIBES AND PRINCIPAL STATES: <strong>1910</strong>—Cont<strong>in</strong>ued.<br />
181
182 INDIANS IN THE UNITED STATES.<br />
MARITAL CONDITION OP THE INDIAN POPULATION 15 YEARS OF AGE AND OVER IN THE UNITED STATES,<br />
CLASSIFIED BY AGE PERIODS, BY PRINCIPAL TRIBES AND PRINCIPAL STATES: <strong>1910</strong>—Cont<strong>in</strong>ued.<br />
Table 69—Cont<strong>in</strong>ued.<br />
[This table shows each tribe hav<strong>in</strong>g 350 or more <strong>Indian</strong>s In IBIO.]
MARITAL CONDITION. 183<br />
MARITAL CONDITION OP THE INDIAN POPULATION 15 YEARS OP AGE AND OVER IN THE UNITED STATES '<br />
CLASSIFIED BY AGE PERIODS, BY PRINCIPAL TRIBES AND PRINCIPAL STATES: <strong>1910</strong>-Oont<strong>in</strong>ued<br />
Table 69—Cont<strong>in</strong>ued.<br />
[This table shows each tribe hav<strong>in</strong>g 350 or more <strong>Indian</strong>s <strong>in</strong> <strong>1910</strong>.]
184 INDIANS IN THE UNITED STATES.<br />
MARITAL CONDITION OP THE INDIAN POPULATION 15 YEARS OF AGE AND OVER IN THE UNITED STATES,<br />
CLASSIFIED BY AGE PERIODS, BY PRINCIPAL TRIBES AND PRINCIPAL STATES: <strong>1910</strong>—Cont<strong>in</strong>ued.<br />
Table 6»—Cont<strong>in</strong>ued.<br />
[This table shows each tribe hav<strong>in</strong>g 350 or more <strong>Indian</strong>s <strong>in</strong> <strong>1910</strong>.]
MARITAL CONDITION. 185<br />
MAEITAL CONDITION OF THE INDIAN POPULATION 15 YEARS OP AGE AND OVER IN THE UNITED STATES<br />
CLASSIFIED BY AGE PERIODS, BY PRINCIPAL TRIBES AND PRINCIPAL STATES: <strong>1910</strong>-Cont<strong>in</strong>ued.<br />
Table 69—Cont<strong>in</strong>ued.<br />
[This table shows each tribe hav<strong>in</strong>g 350 or more <strong>Indian</strong>s <strong>in</strong> <strong>1910</strong>.]
186 INDIANS IN THE UNITED STATES.<br />
MARITAL CONDITION OF THE INDIAN POPULATION 15 YEARS OF AGE AND OVER IN THE UNITED STATES,<br />
CLASSIFIED BY AGE PERIODS, BY PRINCIPAL TRIBES AND PRINCIPAL STATES: <strong>1910</strong>—Cont<strong>in</strong>ued.<br />
Table 69—Cont<strong>in</strong>ued.<br />
[This table shows each tribe hav<strong>in</strong>g 350 or more <strong>Indian</strong>s <strong>in</strong> <strong>1910</strong>.]
MARITAL CONDITION. 187<br />
MARITAL CONDITION OF THE INDIAN POPULATION 15 YEARS OF AGE AND OVER IN THE UNITED STATES,<br />
CLASSIFIED BY AGE PERIODS, BY PRINCIPAL TRIBES AND PRINCIPAL STATES: <strong>1910</strong>—Cont<strong>in</strong>ued.<br />
'Table 6»—Cont<strong>in</strong>ued.<br />
[This table shows each tribe hav<strong>in</strong>g 350 or more <strong>Indian</strong>s <strong>in</strong> <strong>1910</strong>.]
188 INDIANS IN THE UNITED STATES.<br />
MARITAL CONDITION OP THE INDIAN POPULATION 15 YEARS OF AGE AND OVER IN THE UNITED STATES,<br />
CLASSIFIED BY AGE PERIODS, BY PRINCIPAL TRIBES AND PRINCIPAL STATES: <strong>1910</strong>—Cont<strong>in</strong>ued.<br />
Table 69—Cont<strong>in</strong>ued.<br />
[This table shows each tribe hav<strong>in</strong>g 350 or more <strong>Indian</strong>s <strong>in</strong> <strong>1910</strong>.]
MARITAL CONDITION. 189<br />
MARITAL CONDITION OF THE INDIAN POPULATION 15 YEARS OF AGE AND OVER IN THE UNITED STATES<br />
CLASSIFIED BY AGE PERIODS, BY PRINCIPAL TRIBES AND PRINCIPAL STATES: <strong>1910</strong>—Cont<strong>in</strong>ued.<br />
Table 69—Cont<strong>in</strong>ued.<br />
[This table slio^s each tribe hav<strong>in</strong>g 350 or more <strong>Indian</strong>s <strong>in</strong> <strong>1910</strong>.]
190 INDIANS IN THE UNITED STATES.<br />
MARITAL CONDITION OP THE INDIAN POPULATION 15 YEARS OP AGE AND OVER IN THE UNITED STATES,<br />
CLASSIFIED BY AGE PERIODS, BY PRINCIPAL TRIBES AND PRINCIPAL STATES: <strong>1910</strong>.—Cont<strong>in</strong>ued.<br />
Tatole 69—Cont<strong>in</strong>ued.<br />
[This table shows each tribe hav<strong>in</strong>g 360 or more <strong>Indian</strong>s <strong>in</strong> <strong>1910</strong>.]
MARITAL CONDITION. 191<br />
MARITAL CONDITION OF THE INDIAN POPULATION 15 YEARS OF AGE AND OVER IN THE UNITED STATES,<br />
CLASSIFIED BY AGE PERIODS, BY PRINCIPAL TRIBES AND PRINCIPAL STATES: <strong>1910</strong>—Contiiiued.<br />
Table 6»—Ck)nt<strong>in</strong>ued.<br />
[This table shows each tribe hav<strong>in</strong>g 350 or more <strong>Indian</strong>s <strong>in</strong> <strong>1910</strong>.]
192 INDIANS IN THE UNITED STATES.<br />
MARITAL CONDITION OF THE INDIAN POPULATION 15 YEARS OF AGE AND OVER IN THE UNITED STATES,<br />
CLASSIFIED BY AGE PERIODS, BY PRINCIPAL TRIBES AND PRINCIPAL STATES: <strong>1910</strong>—Cont<strong>in</strong>ued.<br />
Table 69—Cont<strong>in</strong>ued.<br />
[This table shows each tribe hav<strong>in</strong>g 350 or more <strong>Indian</strong>s <strong>in</strong> <strong>1910</strong>.]
MARITAL CONDITION. 193<br />
MARITAL CONDITION OF THE INDIAN POPULATION 15 YEARS OP AGE AND OVER IN THE UNITED STATES,<br />
CLASSIFIED BY AGE PERIODS, BY PRINCIPAL TRIBES AND PRINCIPAL STATES: <strong>1910</strong>—Contiaued.<br />
Table 69—Cont<strong>in</strong>ued.<br />
[This table shows each tribe hav<strong>in</strong>g 350 or more <strong>Indian</strong>s <strong>in</strong> <strong>1910</strong>.]
194 INDIANS IN THE UNITED STATES.<br />
MARITAL CONDITION OF THE INDIAN POPULATION 15 YEARS OF AGE AND OVER IN THE UNITED STATES,<br />
CLASSIFIED BY AGE PERIODS, BY PRINCIPAL TRIBES AND PRINCIPAL STATES: <strong>1910</strong>—Cont<strong>in</strong>ued.<br />
Table 69—Cont<strong>in</strong>ued.<br />
[This table sbows each tribe hav<strong>in</strong>g 350 or more <strong>Indian</strong>s <strong>in</strong> <strong>1910</strong>.]
One of <strong>the</strong> most <strong>in</strong>terest<strong>in</strong>g social phenomena <strong>in</strong><br />
American history is found <strong>in</strong> <strong>the</strong> development of <strong>the</strong><br />
system of <strong>Indian</strong> schools upon <strong>the</strong> part of <strong>the</strong> Government,<br />
<strong>and</strong> <strong>in</strong> <strong>the</strong> development of an appreciation<br />
of schooHng upon <strong>the</strong> part of <strong>the</strong> <strong>Indian</strong>. To secure<br />
a common language has been <strong>the</strong> first great object<br />
of <strong>the</strong> <strong>Indian</strong> school. Both races have profited<br />
through <strong>the</strong> mutual underst<strong>and</strong><strong>in</strong>g which a common<br />
language <strong>and</strong> culture br<strong>in</strong>g about. In <strong>the</strong>ir first<br />
report <strong>in</strong> 1869 <strong>the</strong> Board of <strong>Indian</strong> Commissioners dis-<br />
cussed at some length <strong>the</strong> barriers <strong>in</strong> <strong>the</strong> way of<br />
sympa<strong>the</strong>tic relations between <strong>the</strong> red <strong>and</strong> white races,<br />
<strong>and</strong> found <strong>the</strong>m <strong>in</strong> differences of race, custom, <strong>and</strong><br />
language. They went on to say that:<br />
By educat<strong>in</strong>g <strong>the</strong> children of <strong>the</strong>se tribes <strong>in</strong> <strong>the</strong> English language<br />
<strong>the</strong>se differences would have disappeared <strong>and</strong> civilization -would<br />
have followed at once. Noth<strong>in</strong>g <strong>the</strong>n would have been left but <strong>the</strong><br />
antipathy of race, <strong>and</strong> that, too, is always softened <strong>in</strong> <strong>the</strong> beams of a<br />
higher civilization. * * * In <strong>the</strong> difference of language to-day<br />
lies two-thirds of our troubles.<br />
Appropriations for <strong>Indian</strong> schools.—While <strong>the</strong> total<br />
<strong>Indian</strong> appropriations have <strong>in</strong>creased only slightly<br />
more than threefold s<strong>in</strong>ce 1877, <strong>the</strong> appropriations for<br />
<strong>Indian</strong> schools by <strong>the</strong> National Government have<br />
<strong>in</strong>creased one hundred <strong>and</strong> eighty-seven fold <strong>in</strong> <strong>the</strong><br />
same length of time, as shown by Table 70 prepared<br />
from <strong>the</strong> reports of <strong>the</strong> <strong>Indian</strong> Oflace, giv<strong>in</strong>g <strong>the</strong><br />
annual expenditures on account of <strong>Indian</strong> Affairs,<br />
exclusive of trust funds, from 1877 to <strong>1910</strong>, <strong>in</strong>clusive.<br />
It is practically true that an <strong>in</strong>creas<strong>in</strong>g proportion<br />
of national expenditures for <strong>Indian</strong>s goes each year<br />
<strong>in</strong>to <strong>Indian</strong> education. The apparent fall <strong>in</strong> <strong>the</strong> per-<br />
centage dur<strong>in</strong>g <strong>the</strong> last few years is caused by <strong>the</strong><br />
consistent fund<strong>in</strong>g of our treaty obUgations, only<br />
SCHOOL ATTENDANCE.<br />
<strong>the</strong> <strong>in</strong>terest on which has generally been provided<br />
<strong>in</strong> <strong>the</strong> past. With <strong>the</strong> fund<strong>in</strong>g nearly complete <strong>the</strong><br />
real progressive substitution of welfare for adm<strong>in</strong>istra-<br />
tive purposes will aga<strong>in</strong> become apparent.<br />
Table 70
196 INDIANS IN THE UNITED STATES.<br />
Table 72
Table 74 shows, for <strong>the</strong> <strong>United</strong> <strong>States</strong> <strong>and</strong> <strong>Alaska</strong>, by-<br />
sex <strong>and</strong> age periods, <strong>the</strong> number <strong>and</strong> proportion of<br />
<strong>Indian</strong>s attend<strong>in</strong>g school <strong>in</strong> <strong>1910</strong>.<br />
Table 74<br />
BEX AND AGE PERIOD.<br />
Both Sexes<br />
<strong>Indian</strong>s 6 to 19 years<br />
6to9years<br />
10 to 14 years<br />
15 to 19 years<br />
MALE.<br />
<strong>Indian</strong>s 6 to 19 yeais<br />
6 to 9 years<br />
10 to 14 years<br />
15 to 19 years<br />
FEMALE.<br />
<strong>Indian</strong>s 6 to 19 years<br />
6 to 9 years<br />
10 to 14 years<br />
15 to 19 years<br />
UNITED STATES.<br />
Total<br />
number:<br />
<strong>1910</strong>.<br />
88,786<br />
28,907<br />
31, 393<br />
28,486<br />
45,313<br />
14,502<br />
16,199<br />
14,612<br />
43,473<br />
14, 405<br />
15, 194<br />
13, 874<br />
Attend<strong>in</strong>g<br />
school.<br />
Num- Per<br />
ber. cent.<br />
50,115<br />
13,984<br />
22,446<br />
13,685<br />
25,835<br />
6,902<br />
11,666<br />
7,367<br />
24,280<br />
7,082<br />
10,880<br />
6,318<br />
»<br />
56.4<br />
48.4<br />
71.6<br />
48.0<br />
57.0<br />
47.6<br />
71.4<br />
50.4<br />
55.9<br />
49.<br />
71.6<br />
46.5<br />
SCHOOL ATTENDANCE. 197<br />
Total<br />
number:<br />
<strong>1910</strong>.<br />
7,167<br />
2,420<br />
2,250<br />
2,497<br />
3,722<br />
1,231<br />
1,206<br />
1,285<br />
3,446<br />
1,189<br />
1,044<br />
1,212<br />
Attend<strong>in</strong>g<br />
school.<br />
Num- Per<br />
ber. cent.<br />
3,030<br />
1,345<br />
701<br />
1,643<br />
496<br />
726<br />
422<br />
1,387<br />
620<br />
279<br />
42.3<br />
40.7<br />
69.8<br />
28.1<br />
44.1<br />
40.3<br />
60.1<br />
32.8<br />
40.3<br />
41.0<br />
69.4<br />
23.0<br />
The table shows, for <strong>the</strong> <strong>United</strong> <strong>States</strong>, that out of a<br />
total of 88,786 <strong>Indian</strong>s of both sexes 6 to 19 years of<br />
age <strong>in</strong> <strong>1910</strong>, <strong>the</strong>re were 50,115, or 56.4 per cent, who<br />
were attend<strong>in</strong>g school. For <strong>the</strong> males <strong>the</strong> percentage<br />
attend<strong>in</strong>g school, 57, was slightly larger than that for<br />
<strong>the</strong> females, 55.9.<br />
The encourag<strong>in</strong>g general average of attendance upon<br />
schools of aU Idnds does not tell <strong>in</strong> full <strong>the</strong> progressive<br />
Table 75<br />
hold those schools are gett<strong>in</strong>g ia <strong>Indian</strong> circles. The<br />
distribution of <strong>the</strong> whole number of <strong>Indian</strong> scholars<br />
6 to 19 years of age <strong>in</strong>to <strong>the</strong> three smaller age periods<br />
gives much more significant averages. The youth<br />
from 15 to 19 years—or many of <strong>the</strong>m— ^have been <strong>in</strong><br />
school <strong>and</strong> have completed aU <strong>the</strong> school<strong>in</strong>g <strong>the</strong>y can<br />
be expected to receive. Many of <strong>the</strong>m grew to older<br />
years before opportunity or custom brought <strong>the</strong>m<br />
withia <strong>the</strong> scholastic walls. Their average school<br />
attendance <strong>in</strong> <strong>1910</strong> was 48 per cent. The children<br />
from 6 to 9 years are bemg brought <strong>in</strong>to <strong>the</strong> schools<br />
<strong>in</strong> larger numbers every year, but many of <strong>the</strong>m still<br />
elude <strong>the</strong> school authorities, so that <strong>the</strong>ir average<br />
attendance was only 48.4 per cent; for <strong>the</strong> males <strong>in</strong><br />
this age group <strong>the</strong> percentage was 47.6, <strong>and</strong> for <strong>the</strong><br />
females it was 49.2. The real impress which <strong>the</strong><br />
schools are mak<strong>in</strong>g is represented, however, by <strong>the</strong><br />
average school attendance <strong>in</strong> <strong>the</strong> age group 10 to 14,<br />
namely, 71.5 per cent.<br />
As compared with <strong>the</strong> whites <strong>and</strong> Negroes <strong>in</strong> <strong>the</strong><br />
<strong>United</strong> <strong>States</strong>, it appears, as shown by Table 75, that<br />
<strong>the</strong> <strong>Indian</strong> youth between 6 <strong>and</strong> 9 years attended<br />
school <strong>in</strong> <strong>1910</strong> <strong>in</strong> smaller proportions than <strong>the</strong> children<br />
of ei<strong>the</strong>r <strong>the</strong> white or Negro race, that those between<br />
10 <strong>and</strong> 14 surpassed <strong>the</strong> Negro, <strong>and</strong> that those between<br />
15 <strong>and</strong> 19 outranked both <strong>the</strong> o<strong>the</strong>r races. This latter<br />
fact is <strong>the</strong> result <strong>in</strong> part of <strong>the</strong> more or less compulsory<br />
attendance upon many reservations of <strong>the</strong> youth up to<br />
18 years of age.
198 INDIANS IN THE UNITED STATES.<br />
The number of <strong>Indian</strong>s 6 to 19 yeara of age attend<strong>in</strong>g<br />
school, classified by sex <strong>and</strong> age periods, is shown, by<br />
divisions <strong>and</strong> states, <strong>in</strong> Table 77 (p. 199). The pro-<br />
portion of school attendance among <strong>the</strong> <strong>Indian</strong>s <strong>in</strong><br />
each of <strong>the</strong> 22 states for which more than 1,000 <strong>Indian</strong>s<br />
were reported <strong>in</strong> <strong>1910</strong> is given <strong>in</strong> Table 76, <strong>and</strong> <strong>the</strong><br />
proportion is also shown graphically, by states, <strong>in</strong><br />
<strong>the</strong> follow<strong>in</strong>g map<br />
PROPORTION OF INDIANS 6 TO 19 YEARS OF AGE ATTENDING<br />
SCHOOL: <strong>1910</strong>.<br />
1
ance was reported, namely, Lutuamian, 81.3 per cent;<br />
Caddoan, 78.4 per cent; Wafcashan, 74.8 per cent;<br />
<strong>and</strong> Ch<strong>in</strong>ookan, 71.5 per cent. Of <strong>the</strong> larger stocks,<br />
<strong>the</strong> Iroquoian had 9,921, or 68.6 per cent, attend<strong>in</strong>g<br />
school, out of a total of 14,457 persons of school age.<br />
The Cherokee tribe of this stock had 11,756 persons<br />
of school age, of whom 8,036, or 68.4 per cent, attended<br />
school. The Algonquian stock, with 13,764 persons<br />
of school age, showed 8,875, or 64.5 per cent, attend<strong>in</strong>g<br />
school, while <strong>the</strong> Chippewa tribe alone showed<br />
SCHOOL ATTENDANCE. 199<br />
4,776, or 67.7 per cent, attend<strong>in</strong>g school, out of a total<br />
of 7,055 persons of school age. The Siouan, with<br />
10,022 persons of school age, had 6,401, or 63.9 per<br />
cent, attend<strong>in</strong>g school, <strong>and</strong> <strong>the</strong> Muskhogean, with<br />
10,428 persons of school age, 6,372, or 61.1 per cent.<br />
The Athapaskan stock, with 10,792 persons of school<br />
age, showed, on <strong>the</strong> o<strong>the</strong>r h<strong>and</strong>, only 1,890, or 17.5<br />
per c'ent, attend<strong>in</strong>g school, <strong>the</strong> Navajo tribe, with<br />
8,440 persons of school age, hav<strong>in</strong>g only 753, or 8.9<br />
per cent, at school;<br />
SCHOOL ATTENDANCE OF INDIAN POPULATION 6 TO 19 YEARS OF AGE, BY DIVISIONS AND STATES: <strong>1910</strong>.<br />
Table 77<br />
DIVISION AND STATE.<br />
<strong>United</strong> <strong>States</strong>.<br />
Qeogbathic divisions:<br />
NewEnglaad<br />
Middle Atlantic<br />
East North Central.<br />
West North Central.<br />
South Atlantic<br />
East South Central.<br />
West South Central.<br />
Mounta<strong>in</strong><br />
Fadflc<br />
Nev Engl<strong>and</strong>:<br />
Ma<strong>in</strong>e<br />
200 INDIANS IN THE UNITED STATES.<br />
In <strong>Alaska</strong>, as shown by Table 81 (p. 203), <strong>the</strong>Haidan<br />
stock, with 170 persons of school age, showed <strong>the</strong> larg-<br />
est proportion of school attendance, 78.2 per cent.<br />
The Eskimauan, with 3,814 persons of school age,<br />
reported 32 per cent attend<strong>in</strong>g school, <strong>and</strong> <strong>the</strong> Atha-<br />
paskan, with 1,082 persons of school age, 37.1 per cent.<br />
<strong>Indian</strong>s 6 to 19 years of age enumerated on <strong>the</strong><br />
general <strong>population</strong> schedule, <strong>and</strong> <strong>the</strong>refore without<br />
tribal designation, numbered 6,498. Of <strong>the</strong>se 3,944,<br />
or 60.7 per cent, attended school. Table 78 shows<br />
<strong>the</strong> school attendance for <strong>the</strong> 17 states hav<strong>in</strong>g 100 or<br />
more such <strong>Indian</strong>s of school age.<br />
Table 78
SCHOOL ATTENDANCE. 201<br />
SCHOOL ATTENDANCE OF INDIANS 6 TO 19 YEARS OF AGE IN EACH PRINCIPAL STOCK, BY PRINCIPAL TRIBES AND<br />
PRINCIPAL STATES, FOR THE UNITED STATES AND ALASKA: <strong>1910</strong>.<br />
[This table shows each stock hav<strong>in</strong>g 200 or more <strong>Indian</strong>s <strong>in</strong> <strong>1910</strong>, <strong>and</strong> lor each stock <strong>the</strong> tribe hav<strong>in</strong>g 100 or more. Per cent not shown where base is less than 50.]<br />
Table 81
202 INDIANS IN THE UNITED STATES.<br />
SCHOOL ATTENDANCE OP INDIANS 6 TO 19 YEARS OF AGE IN EACH PRINCIPAL STOCK, BY PRINCIPAL TRIBES AND<br />
PRINCIPAL STATES, FOR THE UNITED STATES AND ALASKA: <strong>1910</strong>—Cont<strong>in</strong>ued.<br />
[This table shows each stock hav<strong>in</strong>g 200 or more <strong>Indian</strong>s In <strong>1910</strong>, <strong>and</strong> for each stock <strong>the</strong> tribe hav<strong>in</strong>g 100 or more. Per cent not shown where base Is less than 60.]<br />
Table 8 1—Cont<strong>in</strong>ued.
SCHOOL ATTENDANCE. 203<br />
SCHOOL ATTENDANCE OF INDIANS 6 TO 19 YEARS OF AGE IN EACH PRINCIPAL STOCK, BY PRINCIPAL TRIBES AND<br />
PRINCIPAL STATES, FOR THE UNITED STATES AND ALASKA: <strong>1910</strong>—Cont<strong>in</strong>ued.<br />
[This table shows each stock hav<strong>in</strong>g 200 or more <strong>Indian</strong>s <strong>in</strong> <strong>1910</strong>, <strong>and</strong> for each stock <strong>the</strong> tribe hav<strong>in</strong>g 100 or more. Per cent not shown where base is less tlian 50.]<br />
Table 81-Cont<strong>in</strong>ued.
204 INDIANS IN THE UNITED STATES.<br />
SCHOOL ATTENDANCE OF INDIANS 6 TO 19 YEARS OP AGE IN EACH PRINCIPAL STOCK, BY SEX AND AGE PERIODS,<br />
FOR THE UNITED STATES AND ALASKA: <strong>1910</strong>.<br />
Table 82<br />
[Per cent not shown where base Is less than 50.]
SCHOOL ATTENDANCE. 205<br />
SCHOOL ATTENDANCE OP INDIANS 6 TO 19 YEARS OF AGE, BY STOCK, TRIBE, AND PRINCIPAL STATES,<br />
CLASSIFIED BY SEX AND AGE PERIODS, FOR THE UNITED STATES AND ALASKA: <strong>1910</strong>.<br />
[A few small stocks for whloli no soholastio <strong>population</strong> was reported are omitted from this talile, as follows: <strong>United</strong> <strong>States</strong>—Takelman, Tarasoan, <strong>and</strong> Zapoteoan; <strong>Alaska</strong>—<br />
Algonquian. Tlie table shows each tribe hav<strong>in</strong>g 100 or more <strong>Indian</strong>s <strong>in</strong> <strong>1910</strong>.]<br />
Table 83
206 INDIANS IN THE UNITED STATES.<br />
SCHOOL ATTENDANCE OF INDIANS 6 TO 19 YEABS OP AGE, BY STOCK, TRIBE, AND PRINCIPAL STATES,<br />
CLASSIFIED BY SEX AND AGE PERIODS, FOR THE UNITED STATES AND ALASKA: <strong>1910</strong>—Cont<strong>in</strong>ued.<br />
[A few small stocks for which do scholastic <strong>population</strong> was reported are omitted from this table, as follows: <strong>United</strong> <strong>States</strong>—Takebnan, Tara^oan, <strong>and</strong> Zapotecan; <strong>Alaska</strong>—<br />
JUgonquian. The table shows each tribe hav<strong>in</strong>g 100 or more <strong>Indian</strong>s <strong>in</strong> <strong>1910</strong>.]<br />
Table 83—Cont<strong>in</strong>ued.
SCHOOL ATTENDANCE. 207<br />
SCHOOL ATTENDANCE OF INDIANS 6 TO 19 YEARS OF AGE, BY STOCK, TRIBE, AND PRINCIPAL STATES,<br />
CLASSIFIED BY SEX AND AGE PERIODS, FOR THE UNITED STATES AND ALASKA: <strong>1910</strong>—Cont<strong>in</strong>ued.<br />
[A few small stocks tot which no scholastic <strong>population</strong> was reported are omitted from this table, as follows: <strong>United</strong> <strong>States</strong>— ^Takelman, Tarascan, <strong>and</strong> Zapotecan; <strong>Alaska</strong>—<br />
Algonquian. The table shows each tribe hav<strong>in</strong>g 100 or more <strong>Indian</strong>s In <strong>1910</strong>.]<br />
Table 83—Cont<strong>in</strong>ued.
208 INDIANS IN THE UNITED STATES.<br />
SCHOOL ATTENDANCE OF INDIANS 6 TO 19 YEARS OF AGE, BY STOCK, TRIBE, AND PRINCIPAL STATES,<br />
CLASSIFIED BY SEX AND AGE PERIODS, FOR THE UNITED STATES AND AfiASKA: <strong>1910</strong>—Cont<strong>in</strong>ued.
SCHOOL ATTENDANCE. 209<br />
SCHOOL ATTENDANCE OF INDIANS 6 TO 19 YEARS OF AGE, BY STOCK, TRIBE, AND PRINCIPAL STATES,<br />
CLASSIFIED BY SEX AND AGE PERIODS. FOR THE UNITED STATES AND ALASKA: <strong>1910</strong>—Cont<strong>in</strong>ued.<br />
(A few small stocks for which no scholastic <strong>population</strong> was reported are omitted from this table, as follows: <strong>United</strong> <strong>States</strong>—Takelman, Tarascan, <strong>and</strong> Zapotecon; <strong>Alaska</strong>—<br />
Algonquian. The table shows each tribe hav<strong>in</strong>g 100 or more <strong>Indian</strong>s <strong>in</strong> <strong>1910</strong>.]<br />
Table 83—Cont<strong>in</strong>ued.
210 INDIANS IN THE UNITED STATES.<br />
SCHOOL ATTENDANCE OF INDIANS 6 TO 19 YEARS OF AGE, BY STOCK, TRIBE, AND PRINCIPAL STATES,<br />
CLASSIFIED BY SEX AND AGE PERIODS, FOR THE UNITED STATES AND ALASKA.: <strong>1910</strong>—Cont<strong>in</strong>ued.<br />
[A Ifew small stoclis for which no soholastio <strong>population</strong> was reported are omitted from this table, as follows: TTnited <strong>States</strong>—Tatelmaa, Tarascan, <strong>and</strong> Zapotecan; <strong>Alaska</strong>—<br />
Algonquian. The table shows each tribe hav<strong>in</strong>g 100 or more <strong>Indian</strong>s <strong>in</strong> <strong>1910</strong>.]<br />
Table 83—Gonthiaed.
SCHOOL ATTENDANCE. 211<br />
SCHOOL ATTENDANCE OF INDIANS 6 TO 19 'YEARS OF AGE, BY STOCK, TRIBE, AND PRINCIPAL STATES,<br />
CLASSIFIED BY SEX AND AGE PERIODS, FOR THE UNITED STATES AND ALASKA: <strong>1910</strong>-Coiitmued.<br />
[A tev small stocks for -wWoli no scholastic <strong>population</strong> was reported are omitted from this table, as follows: <strong>United</strong> <strong>States</strong>—Takelman, Tarascan, <strong>and</strong> Zapotecan; <strong>Alaska</strong>—<br />
Algonquian. The table shows each tribe hav<strong>in</strong>g 100 or more <strong>Indian</strong>s <strong>in</strong> <strong>1910</strong>.]<br />
Table 83—Cont<strong>in</strong>ued.
At <strong>the</strong> census of <strong>1910</strong>, as at several preced<strong>in</strong>g cen-<br />
suses, <strong>in</strong>quiry was made, on both <strong>the</strong> general popula-<br />
tion <strong>and</strong> special <strong>Indian</strong> schedules, as to whe<strong>the</strong>r <strong>the</strong><br />
person enumerated was able to read <strong>and</strong> as to whe<strong>the</strong>r,<br />
he was able to write <strong>in</strong> any language, not necessarily<br />
English. Answers to <strong>the</strong>se questions were required<br />
only for persons 10 years of age <strong>and</strong> over. For this<br />
report, as for <strong>the</strong> general reports on <strong>population</strong>, <strong>the</strong><br />
Bureau of <strong>the</strong> Census has classified as illiterate all<br />
persons imable to write, regardless of abiUty to read.<br />
What constitutes abihty to read <strong>and</strong> write is partially<br />
a matter of judgment, <strong>and</strong> <strong>the</strong>re is undoubtedly a cer-<br />
ta<strong>in</strong> marg<strong>in</strong> of error <strong>in</strong> <strong>the</strong> returns, particularly with<br />
respect to <strong>Indian</strong>s. Never<strong>the</strong>less, <strong>the</strong> returns are<br />
probably <strong>the</strong> most accurate so far made, <strong>and</strong> may be<br />
accepted <strong>in</strong> fair comparison with o<strong>the</strong>r data <strong>and</strong> as<br />
between tribe <strong>and</strong> tribe or group <strong>and</strong> group, as <strong>the</strong><br />
case may be.<br />
Illiteracy, <strong>1910</strong> avd 1900.—^At <strong>the</strong> census of <strong>1910</strong><br />
<strong>the</strong>re were 188,758 <strong>Indian</strong>s 10 years of age <strong>and</strong> over,<br />
<strong>and</strong> of this number 85,445, or 45.3 per cent, were iUit- •<br />
erate. Of <strong>the</strong> 171,552 <strong>Indian</strong>s 10 years of age <strong>and</strong><br />
over at <strong>the</strong> preced<strong>in</strong>g census, that of 1900, <strong>the</strong> illiterates<br />
numbered 96,347, or 56.2 per cent. . These figures<br />
show, <strong>the</strong>refore, not only an absolute decrease of<br />
10,902 <strong>in</strong> <strong>the</strong> number of illiterate <strong>Indian</strong>s, but a pro-<br />
portional decrease of nearly 11 per cent—45.3 <strong>in</strong> <strong>1910</strong><br />
as compared with 56.2 <strong>in</strong> 1-900.<br />
Table 84<br />
ILLITERACY.
difference between <strong>the</strong> sexes is particularly noticeable<br />
among <strong>Indian</strong>s 20 years of age <strong>and</strong> over. For <strong>the</strong><br />
<strong>United</strong> <strong>States</strong> <strong>in</strong> <strong>1910</strong>, as shown by Table 86, <strong>the</strong> percentage<br />
of illiterates among females 20 years of age <strong>and</strong><br />
over was 61.4 as compared with 50.8 for males, while<br />
for <strong>Alaska</strong> <strong>in</strong> <strong>1910</strong> <strong>the</strong> percentage for females of this<br />
class was 85.5 as aga<strong>in</strong>st 78.1 for males. The proportion<br />
of illiterates <strong>in</strong> <strong>1910</strong> among <strong>the</strong> <strong>Indian</strong> youth<br />
those from 10 to 19 years of age—<strong>in</strong> <strong>the</strong> <strong>United</strong> <strong>States</strong><br />
was, on <strong>the</strong> o<strong>the</strong>r h<strong>and</strong>, only slightly larger for<br />
females than for males, or 22.8 as compared with 21.7<br />
per cent, but <strong>in</strong> <strong>Alaska</strong> <strong>the</strong> difference was considerable,<br />
<strong>the</strong> percentages be<strong>in</strong>g 45.3 for females as agaiast 39.8<br />
for males.<br />
Table 86<br />
—<br />
ILLITERACY. 213
214 INDIANS IN THE UNITED STATES.<br />
ILLITERATES AMONG INDIANS 10 YEARS OF AGE AND OVER, 10 TO 19 YEARS OF AGE, AND 20 YEARS OF AGE AND<br />
OVER, RESPECTIVELY, IN 22 SELECTED STATES: <strong>1910</strong> AND 1900.<br />
Table 87<br />
Arizona<br />
California<br />
Colorado<br />
Idaho<br />
Kansas<br />
<strong>United</strong> <strong>States</strong>...<br />
Michigan »<br />
M<strong>in</strong>nesota<br />
Mississippi<br />
Montana<br />
Nebraska<br />
Nevada<br />
New Mexico<br />
New York<br />
North Carol<strong>in</strong>a<br />
North Dakota<br />
Oklahoma<br />
Oregon<br />
South Dakota<br />
Utah<br />
Wash<strong>in</strong>gton<br />
Wisconsm<br />
Wyom<strong>in</strong>g<br />
Total lor 22 states.<br />
All o<strong>the</strong>r states<br />
<strong>Indian</strong>s 10 years of age<br />
<strong>and</strong> over.<br />
Total<br />
number.<br />
188,758<br />
12,606<br />
1,070<br />
2,704<br />
1,926<br />
5,702<br />
6,608<br />
861<br />
7,939<br />
2,600<br />
4,190<br />
14,101<br />
4,568<br />
5,324<br />
4,654<br />
48,886<br />
3,904<br />
14,345<br />
2,290<br />
8,101<br />
7,366<br />
1,098<br />
181,231<br />
7,527<br />
Illiterate.<br />
Number.<br />
85,445<br />
14,939<br />
6,174<br />
620<br />
1,607<br />
360<br />
1,964<br />
2,614<br />
680<br />
4,432<br />
3,005<br />
11,519<br />
1,273<br />
2,511<br />
2,142<br />
12,297<br />
1,430<br />
6,529<br />
1,901<br />
3,708<br />
2,482<br />
562<br />
83,571<br />
1,874<br />
Per<br />
cent.<br />
45.3<br />
72.9<br />
49.0<br />
48.6<br />
59.4<br />
18.7<br />
34.4<br />
40.2<br />
79.0<br />
55.8<br />
35.5<br />
71.7<br />
81.7<br />
27.9<br />
47.2<br />
46.0<br />
26.2<br />
36.6<br />
45.5<br />
83.0<br />
46.8<br />
33.7<br />
51.2<br />
46.1<br />
24.9<br />
<strong>1910</strong><br />
<strong>Indian</strong>s 10 to 19 years<br />
of age.<br />
Total<br />
number.<br />
69,879<br />
6,676<br />
3,665<br />
425<br />
675<br />
861<br />
1,6(J7<br />
2,112<br />
280<br />
2,188<br />
. 872<br />
1,004<br />
4,362<br />
1,269<br />
1,789<br />
1,539<br />
17,737<br />
1,241<br />
3,771<br />
574<br />
2,159<br />
2,317<br />
279<br />
57,182<br />
2,697<br />
Illiterate.<br />
Number.<br />
13,311<br />
3,609<br />
646<br />
81<br />
107<br />
25<br />
149<br />
245<br />
183<br />
646<br />
102<br />
407<br />
2,801<br />
88<br />
457<br />
222<br />
1,979<br />
57<br />
423<br />
378<br />
346<br />
216<br />
22<br />
12,889<br />
422<br />
Per<br />
cent.<br />
22.2<br />
52.6<br />
15.4<br />
19.1<br />
18.6<br />
2.9<br />
11.6<br />
65.4<br />
25.0<br />
11.7<br />
40.5<br />
64.2<br />
7.0<br />
25.5<br />
14.4<br />
11.2<br />
4.6<br />
11.2<br />
16.0<br />
9.3<br />
7.9<br />
22.5<br />
15.6<br />
<strong>Indian</strong>s 20 years of age<br />
<strong>and</strong> over.<br />
Total<br />
number.<br />
128,879<br />
13,812<br />
9,061<br />
646<br />
2,129<br />
1,065<br />
4,095<br />
4,396<br />
681<br />
6,751<br />
1,728<br />
3,186<br />
9,739<br />
3,309<br />
3,636<br />
3,115<br />
31,149<br />
2,663<br />
10,674<br />
1,716<br />
5,942<br />
6,049<br />
819<br />
124,049<br />
4,830<br />
Illiterate.<br />
Number.<br />
72,134<br />
11, 430<br />
6,628<br />
439<br />
1,500<br />
335<br />
1,815<br />
2,369<br />
497<br />
3,886<br />
2,598<br />
8,718<br />
1,185<br />
2,054<br />
1,920<br />
10,318<br />
1,373<br />
6,106<br />
1,523<br />
3,362<br />
2,266<br />
540<br />
70,682<br />
1,452<br />
Per<br />
cent.<br />
62.2<br />
68.1<br />
70.6<br />
31.5<br />
44.3<br />
63.9<br />
85.5<br />
67.6<br />
47.5<br />
81.5<br />
89.6<br />
36.8<br />
58.1<br />
61.6<br />
33.1<br />
51.6<br />
57.7<br />
88.8<br />
66.6<br />
44.9<br />
65.9<br />
57.0<br />
30.1<br />
<strong>Indian</strong>s 10 years of age<br />
<strong>and</strong> over.<br />
Total<br />
number.<br />
171,562<br />
19,312<br />
11,799<br />
1,102<br />
3,190<br />
1,683<br />
4,794<br />
6,342<br />
1,550<br />
8,310<br />
2,475<br />
4,108<br />
9,664<br />
3,892<br />
4,016<br />
5,028<br />
43,767<br />
3,737<br />
14,751<br />
2,011<br />
7,675<br />
6,169<br />
1,200<br />
166,275<br />
5,277<br />
Illiterate.<br />
Number.<br />
96,347<br />
16,049<br />
7,700<br />
697<br />
2,426<br />
607<br />
2,329<br />
4,095<br />
1,244<br />
6,627<br />
697<br />
3,419<br />
7,721<br />
1,438<br />
2,197<br />
3,142<br />
15,404<br />
1,888<br />
7,717<br />
1,630<br />
4,774<br />
3,089<br />
845<br />
94,636<br />
1,712<br />
Per<br />
cent.<br />
56.2<br />
83.1<br />
65.3<br />
63.2<br />
76.1<br />
32.0<br />
48.6<br />
64.6<br />
80.3<br />
67.7<br />
28.2<br />
83.2<br />
80.7<br />
36.9<br />
64.7<br />
62.5<br />
35.2<br />
50.5<br />
52.3<br />
81.1<br />
63.0<br />
50.1<br />
70.4<br />
66.9<br />
32.4<br />
1900<br />
<strong>Indian</strong>s 10 to 19 years<br />
of age.<br />
Total<br />
number.<br />
52,135<br />
5,638<br />
2,816<br />
489<br />
606<br />
719<br />
1,330<br />
1,914<br />
647<br />
2,192<br />
832<br />
887<br />
3,021<br />
1,027<br />
1,360<br />
1,445<br />
15,981<br />
1,080<br />
3,705<br />
1,716<br />
1,776<br />
314<br />
49,881<br />
2,254<br />
Illiterate.<br />
Number.<br />
15,727<br />
3,436<br />
807<br />
146<br />
213<br />
83<br />
729<br />
431<br />
603<br />
83<br />
525<br />
1,607<br />
203<br />
557<br />
402<br />
3,474<br />
157<br />
344<br />
331<br />
429<br />
376<br />
91<br />
16,322<br />
405<br />
Per<br />
cent.<br />
0.2<br />
60.9<br />
28.7<br />
29.9<br />
35.1<br />
11.5<br />
22.3<br />
38.1<br />
78.8<br />
27.5<br />
10.0<br />
69.2<br />
63.2<br />
19.8<br />
41.0<br />
27.8<br />
21.7<br />
14.5<br />
68.1<br />
25.0<br />
21.2<br />
29.0<br />
30.7<br />
18.0<br />
<strong>Indian</strong>s 20 years ol age<br />
<strong>and</strong> over.<br />
Total<br />
number.<br />
119,417<br />
13,674<br />
8,983<br />
613<br />
2,684<br />
864<br />
3,464<br />
4,428<br />
1,003<br />
6,118<br />
1,643<br />
3,221<br />
6,643<br />
2,865<br />
2,656<br />
3,583<br />
27, 786<br />
2,667<br />
11,046<br />
1,525<br />
5,859<br />
4,393<br />
116,394<br />
3,023<br />
Illiteiste.<br />
ILLITERATES AMONG INDIAN MALES AND FEMALES 10 YEARS OF AGE AND OVER, 10 TO 19 YEARS OP AGE, AND 20<br />
YEARS OF AGE AND OVER, RESPECTIVELY, IN 22 SELECTED STATES: <strong>1910</strong>.<br />
Table 88<br />
Arizona<br />
Calilbmla<br />
Colorado<br />
Idaho<br />
Kansas...<br />
<strong>United</strong> <strong>States</strong>...<br />
Michigan. ....^<br />
M<strong>in</strong>nesota<br />
MlssissippL<br />
Montana<br />
Nebraska<br />
Nevada<br />
New Mexico<br />
New York<br />
North Carol<strong>in</strong>a<br />
North Dakota<br />
Oklahoma<br />
Oregon<br />
South Dakota<br />
Utah<br />
Wash<strong>in</strong>gton<br />
Wiscons<strong>in</strong><br />
Wyom<strong>in</strong>g<br />
...<br />
Total fi>r 22 states.<br />
AU o<strong>the</strong>r states<br />
INDIAN MALES 10<br />
TEABS OF AGE AND<br />
OVEK.<br />
Total<br />
number.<br />
96,582<br />
10,625<br />
6,458<br />
609<br />
1,355<br />
1,111<br />
3,028<br />
3,290<br />
470<br />
3,978<br />
1,317<br />
2,120<br />
7,240<br />
2,359<br />
2,698<br />
2,366<br />
24,580<br />
1,954<br />
7,166<br />
1,232<br />
4,066<br />
3,866<br />
575<br />
92,463<br />
4,119<br />
Illiterate.<br />
Number.<br />
40,104<br />
7,269<br />
2,932<br />
255<br />
753<br />
911<br />
1,162<br />
340<br />
2,072<br />
390<br />
1,425<br />
5,685<br />
660<br />
1,168<br />
1,031<br />
5,399<br />
581<br />
2,795<br />
1,610<br />
1,207<br />
261<br />
39,103<br />
1,001<br />
Per<br />
cent.<br />
41.5<br />
68.4<br />
45.4<br />
41.9<br />
56.6<br />
18.7<br />
30.1<br />
36.3<br />
72.3<br />
52.1<br />
67.2<br />
78.5<br />
28.0<br />
43.3<br />
43.6<br />
22.0<br />
29.7<br />
39.0<br />
80.3<br />
39.6<br />
31.2<br />
46.4<br />
42.3<br />
24.3<br />
INDIAN MALES 10 TO<br />
19 YEAB3 OF AGE.<br />
Total<br />
number.<br />
30,811<br />
3,634<br />
1,804<br />
264<br />
288<br />
460<br />
825<br />
1,123<br />
166<br />
1,119<br />
442<br />
518<br />
2,206<br />
602<br />
915<br />
776<br />
8,997<br />
665<br />
1,962<br />
306<br />
1,126<br />
1,177<br />
143<br />
29,397<br />
1,414<br />
Illiterate.<br />
Number.<br />
1,737<br />
268<br />
46<br />
58<br />
17<br />
76<br />
138<br />
94<br />
282<br />
54<br />
195<br />
1,338<br />
52<br />
240<br />
107<br />
1,016<br />
33<br />
212<br />
202<br />
181<br />
114<br />
11<br />
6,470<br />
222<br />
Per<br />
cent.<br />
21.7<br />
49.2<br />
14.9<br />
17.0<br />
20.1<br />
9.2<br />
12.3<br />
60.6<br />
25.2<br />
12.2<br />
37.6<br />
60.7<br />
8.6<br />
26.2<br />
13.8<br />
11.3<br />
5.0<br />
10.8<br />
66.0<br />
16.1<br />
9.7<br />
7.7<br />
22.0<br />
15.7<br />
INDIAN MALES 20<br />
YEABa OF AGE AND<br />
OVEB.<br />
Total<br />
number.<br />
66,771<br />
7,091<br />
4,654<br />
346<br />
1,067<br />
661<br />
2,203<br />
2,167<br />
316<br />
2,859<br />
875<br />
1,602<br />
5,034<br />
1,767<br />
1,783<br />
1,590<br />
15,583<br />
1,289<br />
5,204<br />
2,940<br />
2,689<br />
63,066<br />
2,705<br />
Among <strong>the</strong> <strong>Indian</strong>s 20 years of age <strong>and</strong> over, as<br />
shown by Table 88, <strong>the</strong> proportion of illiterate femaleswas<br />
larger than that for illiterate males <strong>in</strong> each of<br />
<strong>the</strong> 22 states, but among <strong>the</strong> <strong>Indian</strong> youth 10 to 19<br />
years of age <strong>the</strong> proportion for females was larger<br />
niiteiate.<br />
Number.<br />
33,412<br />
5,632<br />
2,664<br />
210<br />
696<br />
191<br />
836<br />
1,024<br />
246<br />
1,790<br />
336<br />
1,230<br />
4,347<br />
924<br />
4,383<br />
548<br />
2,583<br />
787<br />
1,429<br />
1,093<br />
250<br />
32,633<br />
779<br />
Per<br />
cent.<br />
50.8<br />
78.0<br />
67.2<br />
60.9<br />
66.1<br />
28.9<br />
37.9<br />
47.3<br />
78.1<br />
62.6<br />
38.4<br />
76.8<br />
86.4<br />
34.6<br />
52.0<br />
58.1<br />
28.1<br />
42.5<br />
86.0<br />
48.6<br />
40.6<br />
57.9<br />
51.7<br />
INDIAN FEMALES 10<br />
YEABS OF AGE AND<br />
OVER.<br />
Total<br />
number.<br />
92, 176<br />
9,863<br />
6,148<br />
451<br />
1,349<br />
815<br />
2,674<br />
3,218<br />
391<br />
3,961<br />
1,283<br />
2,070<br />
6,861<br />
2,209<br />
2,626<br />
2,288<br />
24,306<br />
1,950<br />
7,179<br />
1,068<br />
4,035<br />
3,500<br />
88,768<br />
3,408<br />
Illiterate.<br />
Number.<br />
46,341<br />
7,670<br />
3,242<br />
265<br />
854<br />
152<br />
1,053<br />
1,452<br />
340<br />
2,360<br />
532<br />
1,580<br />
5,834<br />
613<br />
1,343<br />
1,111<br />
6,898<br />
849<br />
3,734<br />
912<br />
2,098<br />
1,275<br />
301<br />
44,468<br />
873<br />
Per<br />
cent.<br />
49.2<br />
77.8<br />
52.7<br />
57.5<br />
63.3<br />
18.7<br />
39.4<br />
45.1<br />
87.0<br />
59.6<br />
41.5<br />
76.3<br />
86.0<br />
27.8<br />
51.1<br />
48.6<br />
28.4<br />
43.5<br />
52.0<br />
86.2<br />
52.0<br />
36.4<br />
67.6<br />
60.1<br />
25.6<br />
tNDIAN FEMALES 10<br />
TO 19 YEABS OF AGE.<br />
Total<br />
number.<br />
29,068<br />
3,142<br />
1,751<br />
161<br />
287<br />
411<br />
782<br />
989<br />
125<br />
1,069<br />
430<br />
2,156<br />
657<br />
874<br />
763<br />
8,740<br />
676<br />
1,809<br />
268<br />
1,033<br />
1,140<br />
136<br />
27,785<br />
1,283<br />
nuterate.<br />
Number.<br />
6,619<br />
1,772<br />
278<br />
36<br />
49<br />
73<br />
107<br />
264<br />
212<br />
:,463<br />
36<br />
217<br />
115<br />
963<br />
24<br />
211<br />
176<br />
165<br />
102<br />
11<br />
6,419<br />
200<br />
Per<br />
cent.<br />
22.8<br />
56.4<br />
16.9<br />
22.4<br />
17.1<br />
1.9<br />
10.8<br />
71.2<br />
24.7<br />
U.2<br />
43.6<br />
67.9<br />
5.5<br />
24.8<br />
15.1<br />
U.0<br />
4.2<br />
11.7<br />
65.7<br />
16.0<br />
8.9<br />
8.1<br />
23.1<br />
15.6<br />
Number.<br />
80,620<br />
12,614<br />
6,893<br />
661<br />
2,213<br />
424<br />
2,033<br />
3,366<br />
813<br />
5,024<br />
614<br />
2,894<br />
6,114<br />
1,235<br />
1,640<br />
2,740<br />
11,930<br />
1,731<br />
7,373<br />
1,299<br />
4,345<br />
2,713<br />
754<br />
79,313<br />
1,307<br />
Per<br />
cent.<br />
67.6<br />
92.2<br />
76.7<br />
89.9<br />
85.6<br />
49.1<br />
58.7<br />
76.0<br />
81.1<br />
82.1.<br />
37.4<br />
89.8<br />
93.4<br />
43.1<br />
61.7<br />
76.5<br />
42.9<br />
65.1<br />
66.7<br />
85.2<br />
74.2<br />
61.8<br />
85.1<br />
68.1<br />
43.2<br />
mDIAN FEMALES 20<br />
YEABS OF AGE AND<br />
OVEB.<br />
Total<br />
number.<br />
63,108<br />
6,721<br />
4,397<br />
300<br />
1,062<br />
404<br />
1,892<br />
2,229<br />
266<br />
2,892<br />
853<br />
1,584<br />
4,705<br />
1,562<br />
1,752<br />
1,626<br />
16,666<br />
1,374<br />
5,370<br />
•790<br />
3,002<br />
2,360<br />
387<br />
60,983<br />
2,126<br />
Illiterate.<br />
Numner.<br />
38,722<br />
5,898<br />
2,964<br />
229<br />
805<br />
144<br />
1,345<br />
251<br />
2/096<br />
484<br />
1,368<br />
4,371<br />
577<br />
1,126<br />
5,935<br />
826<br />
3,523<br />
736<br />
1,933<br />
1,173<br />
290<br />
38,049<br />
673<br />
Per<br />
cent.<br />
61.4<br />
87.8<br />
67.4<br />
76.3<br />
75.8<br />
35.6<br />
61.8<br />
60.3<br />
94.4<br />
72,5<br />
56.7<br />
86,4<br />
92,9<br />
37,2<br />
64,3<br />
65,3<br />
38,1<br />
60.0<br />
65,6<br />
93,2<br />
64,4<br />
49,7<br />
74,9<br />
62.4<br />
31.7<br />
than that for males <strong>in</strong> only 10 of <strong>the</strong> selected states,<br />
although <strong>in</strong> some of <strong>the</strong>se states <strong>the</strong> difference<br />
<strong>in</strong> <strong>the</strong> proportion was very large, particularly <strong>in</strong><br />
Arizona, Colorado, Mississippi, Nevada, <strong>and</strong> New<br />
Mexico.
ILLITERACY. 215<br />
ILLITERATE INDIAN MALES AND FEMALES 10 YEARS OF AGE AND OVER, CLASSIFIED BY AGE PERIODS, BY<br />
DIVISIONS AND STATES: <strong>1910</strong>.<br />
Table 89<br />
DIVI3I0N AND STATE.<br />
<strong>United</strong> <strong>States</strong>.,<br />
Oeoqbathic divisions:<br />
New Engl<strong>and</strong><br />
Middle Atlantic<br />
East North Central.<br />
'<br />
"West North Central<br />
.<br />
South Atlantic<br />
East South Central..<br />
West South Central..<br />
Mounta<strong>in</strong><br />
Pacific<br />
New Engl<strong>and</strong>:<br />
Ma<strong>in</strong>e<br />
New Hampshire.<br />
Vermont<br />
Massachusetts...<br />
Bhode Isl<strong>and</strong><br />
Connecticut<br />
Middle Atlantic:<br />
New York<br />
New Jersey<br />
FennsylTania..<br />
East Nobth Centbal:<br />
Ohio<br />
<strong>Indian</strong>a<br />
Ill<strong>in</strong>ois<br />
Michigan<br />
Wiscons<strong>in</strong><br />
West North Central:<br />
M<strong>in</strong>nesota<br />
Iowa<br />
Missouri<br />
North Dakota<br />
South Dakota<br />
Nebraska<br />
Kansas..........<br />
BouiB Atlantic:<br />
Delaware<br />
Maryl<strong>and</strong><br />
Dislxlct of Columbia.<br />
Virg<strong>in</strong>ia<br />
West Virg<strong>in</strong>ia<br />
North Carol<strong>in</strong>a<br />
South Carol<strong>in</strong>a<br />
Georgia<br />
Florida<br />
East Soute Central:<br />
Kentucky<br />
Alabama...<br />
Mississippi..<br />
West South Central:<br />
Louisiana..<br />
Oklahoma.<br />
Texas<br />
UotmTAnc<br />
Montana,.<br />
Idaho..<br />
Wyom<strong>in</strong>g...<br />
CoIoFado<br />
New Mexico.<br />
Arizona......<br />
rtah<br />
Nevada<br />
fAcmc:<br />
Wash<strong>in</strong>gton.<br />
Oregon<br />
Calilomia....<br />
.<br />
Total<br />
number.<br />
96,582<br />
869<br />
3,3S2<br />
7,157<br />
15,625<br />
3,155<br />
915<br />
25,297<br />
27,734<br />
12,478<br />
INDIAN MALES 10 TEAES OP AGE AND OVER: <strong>1910</strong>.<br />
14<br />
11<br />
290<br />
108<br />
60<br />
2,359<br />
107<br />
59<br />
120<br />
84<br />
3,028<br />
3,866<br />
3,290<br />
259<br />
116<br />
2,366<br />
7,166<br />
1,317<br />
Ijlll<br />
4<br />
18<br />
35<br />
208<br />
14<br />
2,698<br />
112<br />
33<br />
33<br />
85<br />
73<br />
287<br />
470<br />
143<br />
271<br />
24,580<br />
303<br />
3,978<br />
1,355<br />
575<br />
609<br />
7,240<br />
10,625<br />
1,232<br />
2,120<br />
4,066<br />
1,954<br />
6,458<br />
Total.l<br />
40,104<br />
130<br />
684<br />
2,147<br />
6,730<br />
1,305<br />
529<br />
5,747<br />
18,709<br />
5,123<br />
107<br />
2<br />
1<br />
9<br />
4<br />
7<br />
5<br />
16<br />
8<br />
911<br />
1,207<br />
1,162<br />
129<br />
15<br />
1,031<br />
2,795<br />
390<br />
3<br />
4<br />
54<br />
1<br />
1,168<br />
48<br />
13<br />
14<br />
45<br />
25<br />
119<br />
340<br />
20<br />
203<br />
125<br />
2,072<br />
753<br />
261<br />
255<br />
6,685<br />
7,269<br />
989<br />
1,425<br />
1,610<br />
681<br />
2,932<br />
Illiterate.<br />
10 to 14 15 to 19<br />
years years<br />
of age. of age.<br />
3,523<br />
2<br />
16<br />
91<br />
289<br />
142<br />
79<br />
558<br />
2,100<br />
246<br />
65<br />
78<br />
1<br />
2<br />
53<br />
118<br />
27<br />
10<br />
10<br />
126<br />
i<br />
3<br />
2<br />
40<br />
605<br />
11<br />
176<br />
28<br />
7<br />
24<br />
707<br />
938<br />
107<br />
113<br />
97<br />
16<br />
133<br />
3,169<br />
104<br />
248<br />
123<br />
81<br />
567<br />
1,768<br />
236<br />
39<br />
115<br />
1<br />
42<br />
611<br />
14<br />
106<br />
'30<br />
4<br />
21<br />
631<br />
799<br />
95<br />
84<br />
17<br />
135<br />
20 to 29<br />
years<br />
of age.<br />
6,335<br />
13<br />
110<br />
254<br />
679<br />
314<br />
126<br />
1,072<br />
3,182<br />
585<br />
108<br />
1<br />
1<br />
123<br />
130<br />
161<br />
76<br />
3<br />
130<br />
222<br />
58<br />
29<br />
16<br />
277<br />
11<br />
4<br />
6<br />
85<br />
6<br />
30<br />
1,005<br />
32<br />
213<br />
61<br />
27<br />
39<br />
1,192<br />
1,236<br />
185<br />
229<br />
181<br />
47<br />
357<br />
30 to 39<br />
years<br />
of age.<br />
6,467<br />
12<br />
118<br />
312<br />
828<br />
205<br />
83<br />
896<br />
3,286<br />
727<br />
11<br />
109<br />
8<br />
1<br />
4<br />
1<br />
149<br />
158<br />
200<br />
24<br />
2<br />
148<br />
348<br />
68<br />
38<br />
178<br />
11<br />
2<br />
2<br />
856<br />
11<br />
125<br />
65<br />
48<br />
1,062<br />
1,211<br />
164<br />
255<br />
217<br />
51<br />
459<br />
40 years<br />
of age<br />
<strong>and</strong><br />
over.<br />
20,328<br />
397<br />
1,373<br />
3,671<br />
518<br />
160<br />
2,586<br />
8,232<br />
3,292<br />
387<br />
7<br />
3<br />
8<br />
7<br />
561<br />
794<br />
7<br />
643<br />
2,002<br />
210<br />
123<br />
11<br />
1<br />
470<br />
21<br />
4<br />
6<br />
107<br />
12<br />
61<br />
2,460<br />
S3<br />
1,210<br />
497<br />
167<br />
122<br />
2,084<br />
3,025<br />
419<br />
708<br />
1,022<br />
449<br />
1,821<br />
1 Totals <strong>in</strong>clude illiterates of unknown age.<br />
Total<br />
number.<br />
DTDliN FEMALES 10 TEARS OP AGE AND OVER: <strong>1910</strong>.<br />
92,176<br />
791<br />
2,816<br />
6,405<br />
15,019<br />
3,036<br />
839<br />
24,991<br />
26,146<br />
12,133<br />
332<br />
13<br />
8<br />
258<br />
119<br />
61<br />
2,209<br />
47<br />
660<br />
49<br />
102<br />
80<br />
2,674<br />
3,500<br />
3,218<br />
114<br />
122<br />
2,288<br />
7,179<br />
1,283<br />
815<br />
1<br />
32<br />
26<br />
180<br />
12<br />
2,626<br />
105<br />
33<br />
21<br />
70<br />
86<br />
292<br />
391<br />
185<br />
262<br />
24,306<br />
3,961<br />
1,349<br />
523<br />
461<br />
6,861<br />
9,863<br />
1,058<br />
2,070<br />
4,035<br />
1,950<br />
6,148<br />
Total.i<br />
45,341<br />
148<br />
627<br />
2,354<br />
7,047<br />
1,449<br />
528<br />
7,223<br />
19,776<br />
6„189<br />
121<br />
4<br />
613<br />
11<br />
6<br />
14<br />
6<br />
1,053<br />
1,275<br />
1,452<br />
45<br />
21<br />
1,111<br />
3,734<br />
532<br />
152<br />
35<br />
117<br />
340<br />
24<br />
191<br />
6,898<br />
110<br />
2,360<br />
854<br />
301<br />
265<br />
6,834<br />
7,670<br />
912<br />
1,580<br />
2,098<br />
849<br />
3,242<br />
10 to 14<br />
years<br />
of age.<br />
3,275<br />
14<br />
85<br />
264<br />
111<br />
79<br />
485<br />
2,001<br />
233<br />
44<br />
6<br />
1<br />
68<br />
121<br />
23<br />
1<br />
1<br />
47<br />
430<br />
7<br />
162<br />
21<br />
6<br />
17<br />
701<br />
933<br />
83<br />
15<br />
135<br />
Illiterate.<br />
15 to 19<br />
years<br />
of age.<br />
3,344<br />
4<br />
24<br />
91<br />
237<br />
132<br />
62<br />
578<br />
20 to 29<br />
years<br />
of age.<br />
7,321<br />
14<br />
118<br />
227<br />
726<br />
338<br />
129<br />
1,430<br />
3,675<br />
664<br />
24 117<br />
1<br />
121<br />
3<br />
112<br />
28<br />
6<br />
19<br />
762<br />
839<br />
87<br />
130<br />
9<br />
143<br />
116<br />
110<br />
216<br />
6<br />
1<br />
126<br />
264<br />
85<br />
28<br />
319<br />
11<br />
1<br />
48<br />
1,366<br />
17<br />
246<br />
79<br />
41<br />
60<br />
1,295<br />
1,505<br />
171<br />
278<br />
234<br />
57<br />
373<br />
30 to 39<br />
years<br />
of age.<br />
8,065<br />
30<br />
103<br />
369<br />
1,134<br />
238<br />
93<br />
1,378<br />
3,740<br />
101<br />
2<br />
1<br />
1<br />
2<br />
157<br />
208<br />
269<br />
6<br />
6<br />
160<br />
600<br />
74<br />
20<br />
222<br />
2<br />
21<br />
1,329<br />
405<br />
141<br />
66<br />
64<br />
1,128<br />
1,424<br />
191<br />
321<br />
322<br />
92<br />
566<br />
40 years<br />
ofage<br />
<strong>and</strong><br />
over.<br />
22,992<br />
95<br />
365<br />
1,570<br />
4,663<br />
629<br />
165<br />
3,284<br />
8,234<br />
3,987<br />
81<br />
356<br />
7<br />
2<br />
4<br />
12<br />
4<br />
703<br />
847<br />
859<br />
23<br />
12<br />
706<br />
2,647<br />
323<br />
93<br />
14<br />
1<br />
684<br />
18<br />
6<br />
13<br />
13<br />
41<br />
14<br />
46<br />
3,175<br />
1,437<br />
665<br />
182<br />
105<br />
1,935<br />
2,915<br />
360<br />
735<br />
1,336<br />
670<br />
1,981
216 INDIANS IN THE UNITED STATED.<br />
Illiteracy, hy stocks <strong>and</strong> tribes.—Table 92 (p. 219)<br />
shows, by stocks <strong>and</strong> by pr<strong>in</strong>cipal tribes <strong>and</strong> states,<br />
<strong>the</strong> number of illiterate <strong>Indian</strong>s <strong>in</strong> <strong>the</strong> <strong>United</strong> <strong>States</strong><br />
<strong>and</strong> <strong>Alaska</strong> <strong>in</strong> <strong>1910</strong>, distributed accord<strong>in</strong>g to sex <strong>and</strong><br />
age periods, <strong>and</strong> Table 93 (p. 226) shows, for each<br />
pr<strong>in</strong>cipal stock by pr<strong>in</strong>cipal tribes <strong>and</strong> by pr<strong>in</strong>cipal<br />
states, <strong>the</strong> number <strong>and</strong> proportion of ilUterates among<br />
<strong>Indian</strong> males <strong>and</strong> females 10 years of age <strong>and</strong> over<br />
<strong>in</strong> <strong>1910</strong>, <strong>and</strong> among <strong>Indian</strong>s lOto 19 years of age <strong>and</strong><br />
20 years of age <strong>and</strong> over, respectively. These sta-<br />
tistics are summarized for each stock hav<strong>in</strong>g 200<br />
or more members, by sex, <strong>in</strong> Table 90. The propor-<br />
tion of illiterates among <strong>Indian</strong>s 10 to 19 years of<br />
age <strong>and</strong> 20 years of age <strong>and</strong> over <strong>in</strong> <strong>the</strong> pr<strong>in</strong>cipal<br />
tribes is also shown graphically <strong>in</strong> <strong>the</strong> diagram on<br />
page 218.<br />
ILLITERATES AMONG INDIAN MALES AND FEMALES 10 YEARS OP AGE AND OVER, 10 TO 19 YEARS OF AGE, AND<br />
20 YEARS OF AGE AND OVER, RESPECTIVELY, BY PRINCIPAL STOCKS: <strong>1910</strong>.<br />
Table 90
Athapaskan males <strong>and</strong> females <strong>and</strong> also for <strong>the</strong> Eskimauan<br />
females. Of <strong>the</strong> Eskimauan youth <strong>in</strong> <strong>1910</strong>,<br />
over 50 per cent were illiterate—51 for males <strong>and</strong> 58.1<br />
for females— -while for <strong>the</strong> Athapaskan <strong>the</strong> percentages<br />
for each sex were very nearly as large.<br />
Table 91 shows illiteracy among <strong>the</strong> <strong>Indian</strong>s <strong>in</strong> <strong>the</strong><br />
<strong>United</strong> <strong>States</strong> who were enumerated on <strong>the</strong> general<br />
<strong>population</strong> schedule, <strong>and</strong> <strong>the</strong>refore without tribal<br />
Table 91<br />
ILLITERACY. 217<br />
designation, for <strong>the</strong> 32 states hav<strong>in</strong>g 100 or more<br />
such <strong>Indian</strong>s 10 years of age <strong>and</strong> over <strong>in</strong> <strong>1910</strong>. The<br />
table shows that of <strong>the</strong> 9,013 <strong>Indian</strong>s 20 years of<br />
age <strong>and</strong> over who were enumerated on <strong>the</strong> general<br />
<strong>population</strong> schedule, 2,144, or 23.8 per cent, were<br />
illiterate, but of <strong>the</strong> 4,689 such <strong>Indian</strong>s 10 to 19<br />
years of age, <strong>the</strong> munber illiterate was only 459, or<br />
9.8 per cent.
218 INDIANS IN THE UNITED STATES.<br />
PERCENTAGE OF ILLITERATES AMONG INDIANS 10 TO 19 YEARS OP AGE AND 20 YEARS OF<br />
AGE AND OVER, IN EACH PRINCIPAL TRIBE: <strong>1910</strong>.<br />
NAVAJO<br />
ZUNI<br />
UTE<br />
MONO<br />
PAPAGO<br />
SHOSHONI<br />
APACHE<br />
PAVIOTSO<br />
LAQUNA<br />
HOPI<br />
CROW<br />
PIMA<br />
CHEYENNE<br />
COMANCHE<br />
PIEGAN<br />
YANKTONAI SIOUX<br />
YAKIMA<br />
ASSINIBOIN<br />
MOHAVE<br />
KIOWA<br />
TETON SIOUX<br />
SEMINOLE<br />
ST. REGIS<br />
CROATAN<br />
ARAPAHO<br />
WINNEBAGO<br />
YANKTON SIOUX<br />
OMAHA<br />
NEZ PERCES<br />
MAIDU<br />
CHIPPEWA<br />
MENOMINEE<br />
SISSETON SIOUX<br />
CREEK<br />
OTTAWA<br />
POTAWATOMI<br />
CHOCTAW<br />
ONEIDA<br />
SHAWNEE<br />
SANTEE SIOUX<br />
SENECA<br />
OSAGE<br />
CHEROKEE<br />
CHICKASAW<br />
m<br />
SO»K«KO:«Kfi«e»!»&««»«^ K^SIKIKOKffOK^KfSOQO^I5«0»^<br />
m ^ZZZZZZZZL '/f/zt ^uZ,<br />
mm. IZZZZZZZZZi<br />
iZZZZL7ZZ/Z2ZZZZZl<br />
Y//UM/y.ZZL<br />
K«Ae^«««MG«O5O»V>5««!OSOS«K0Va«a^ia9»^»&9^<br />
IZZZS. ^OBS.<br />
WR<br />
^<br />
^^ wr<br />
^^^^<br />
^<br />
Hi ^m<br />
^^<br />
^<br />
^^f<br />
^^^<br />
mit.<br />
Iffl<br />
^^<br />
BB IS m m<br />
»KlK('iiKlKICG5«95(S^iK^K««iVfiQfi«^V.iOQOSlK^OS^^<br />
wm^B<br />
im<br />
WB. WR<br />
TzzzziiZn<br />
'r/z/y. r/^j^//<br />
'ZZZZaTnZZk.ZZZZZZ^<br />
WA wt<br />
as<br />
»<br />
If<br />
ZZZZZlTZZZZl<br />
I W YEARS AND OVIR .<br />
C-^yyi 10 TO 10 VBARt
ILLITERACY. 219<br />
ILLITERATE INDIAN MALES AND FEMALES 10 YEARS OF AGE AND OVER, CLASSIFIED BY AGE PERIODS, BY<br />
STOCKS, PRINCIPAL TRIBES, AND PRINCIPAL STATES: <strong>1910</strong>.<br />
Table 92<br />
[TWs table shows each tribe hav<strong>in</strong>g 100 or more <strong>Indian</strong>s <strong>in</strong> <strong>1910</strong>.]
220 INDIANS IN THE UNITED STATES.<br />
ILLITERATE INDIAN MALES AND FEMALES 10 YEARS OP AGE AND OVER, CLASSIFIED BY AGE PERIODS. BY<br />
STOCKS, PRINCIPAL TRIBES, AND PRINCIPAL STATES: <strong>1910</strong>—Cont<strong>in</strong>ued.<br />
Table 9a—Cont<strong>in</strong>ued.<br />
[Tliis table shows each tribe hav<strong>in</strong>g 100 or more <strong>Indian</strong>s <strong>in</strong> <strong>1910</strong>.]
ILLITERACY. 221<br />
ILLITERATE INDIAN MALES AND FEMALES 10 YEARS OF AGE AND OVER, CLASSIFIED BY AGE PERIODS BY<br />
STOCKS, PRINCIPAL TRIBES, AND PRINCIPAL STATES: <strong>1910</strong>-Coiitmued.<br />
Table 92—Cont<strong>in</strong>ued.<br />
(This table shows each tribe hav<strong>in</strong>g 100 or more <strong>Indian</strong>s <strong>in</strong> <strong>1910</strong>.]
222 INDIANS IN THE UNITED STATES.<br />
ILLITERATE INDIAN MALES AND FEMALES 10 YEARS OP " AGE AND OVER, CLASSIFIED BY AGE PERIODS, BY<br />
STOCKS, PRINCIPAL TRIBES, AND PRINCIPAL STATES: <strong>1910</strong>—Cont<strong>in</strong>ued.<br />
Table 92—Cont<strong>in</strong>ued.<br />
[This table shows each tribe hav<strong>in</strong>g 100 or more <strong>Indian</strong>s <strong>in</strong> <strong>1910</strong>.]
ILLITERACY. 223<br />
ILLITERATE INDIAN MALES AND FEMALES 10 YEARS OP AGE AND OVER, CLASSIFIED BY AGE PERIODS, BY<br />
STOCKS, PRINCIPAL TRIBES, AND PRINCIPAL STATES: <strong>1910</strong>—Cont<strong>in</strong>ued.<br />
Table 92—Cont<strong>in</strong>ued.<br />
[This table shows each tribe hav<strong>in</strong>g 100 or more <strong>Indian</strong>s <strong>in</strong> <strong>1910</strong>.]
224 INDIANS IN THE UNITED STATES.<br />
ILLITERATE INDIAN MALES AND FEMALES 10 YEARS OF AGE AND OVER, CLASSIFIED BY AGE PERIODS, BY<br />
STOCKS, PRINCIPAL TRIBES, AND PRINCIPAL STATES: <strong>1910</strong>—Cont<strong>in</strong>ued.<br />
Table 92—Cont<strong>in</strong>ued.<br />
[This table shows each tribe hav<strong>in</strong>g 100 or more <strong>Indian</strong>s <strong>in</strong> <strong>1910</strong>.] _
ILLITERACY. 225<br />
ILLITERATE INDIAN MALES AND FEMALES 10 YEARS OF AGE AND OVER, CLASSIFIED BY AGE PERIODS, BY<br />
STOCKS, PRINCIPAL TRIBES, AND PRINCIPAL STATES: <strong>1910</strong>—Cont<strong>in</strong>ued.<br />
Table 92—Cont<strong>in</strong>ued.<br />
[This table shows each tribe hav<strong>in</strong>g 100 or more <strong>Indian</strong>s <strong>in</strong> <strong>1910</strong>.]
226 INDIANS IN THE UNITED STATES.<br />
ILLITERATES AMONG INDIANS 10 YEARS OF AGE AND OVER, CLASSIFIED BY SEX, AND AMONG INDIANS<br />
10 TO 19 YEARS OP AGE AND 20 YEARS OF AGE AND OVER, RESPECTIVELY, FOR EACH PRINCIPAL STOCK,<br />
BY PRINCIPAL TRIBES AND BY PRINCIPAL STATES: <strong>1910</strong>.<br />
[This table shows each stoct hav<strong>in</strong>g 200 or more <strong>Indian</strong>s <strong>in</strong> <strong>1910</strong> <strong>and</strong> tor each stook <strong>the</strong> tribe havijig 100 or more. Per cent not shown where base is less than 50.]<br />
Table 93
ILLITERACY. 227<br />
ILLITEKATES AMONG INDIANS 10 YEAES OF AGE AND OVER, CLASSIFIED BY SEX, AND AMONG INDIANS<br />
10 TO 19 YEARS OF AGE AND 20 YEARS OF AGE AND OVER, RESPECTIVELY, FOR EACH PRINCIPAL STOCK,<br />
BY PRINCIPAL TRIBES AND BY PRINCIPAL STATES: <strong>1910</strong>—Cont<strong>in</strong>ued.<br />
[This table shows each stock hay<strong>in</strong>g 230 or more <strong>Indian</strong>s <strong>in</strong> <strong>1910</strong> <strong>and</strong> for each stock <strong>the</strong> tribe hay<strong>in</strong>g 100 or more. Per cent not shown where base is less than 50.]<br />
Table 9S—Cont<strong>in</strong>ued.
228 INDIANS IN THE UNITED STATES.<br />
ILLITERATES AMONG INDIANS 10 YEARS OP AGE AND OVER, CLASSIFIED BY SEX, AND AMONG INDIANS<br />
10 TO 19 YEARS OF AGE AND 20 YEARS OP AGE AND OVER, RESPECTIVELY, FOR EACH PRINCIPAL STOCK,<br />
BY PRINCIPAL TRIBES AND BY PRINCIPAL STATES: <strong>1910</strong>—Cont<strong>in</strong>ued.<br />
[This table shows each stock hav<strong>in</strong>g 200 or more <strong>Indian</strong>s <strong>in</strong> <strong>1910</strong> <strong>and</strong> for each stoclc <strong>the</strong> tribe hay<strong>in</strong>g 100 or more. Per cent not shown where base Is less than SO.]<br />
Table 93—Cont<strong>in</strong>ued.
ILLITERACY.<br />
ILLITERATES AMONG INDIANS 10 YEARS OF AGE AND OVER, CLASSIFIED BY SEX, AND AMONG INDIANS<br />
10 TO 19 YEARS OF AGE AND 20 YEARS OF AGE AND OVER, RESPECTIVELY, FOR EACH PRINCIPAL STOCK,<br />
BY PRINCIPAL TRIBES AND BY PRINCIPAL STATES: <strong>1910</strong>—Cont<strong>in</strong>ued.<br />
[This table shows each stock hav<strong>in</strong>g 200 or more <strong>Indian</strong>s <strong>in</strong> <strong>1910</strong> <strong>and</strong> for each stock <strong>the</strong> tribe hav<strong>in</strong>g 100 or more. Per cent not shown where base is less than 50.]<br />
Table 93—Cont<strong>in</strong>ued.<br />
229
230 INDIANS IN THE UNITED STATES.<br />
ILLITERATES AMONG INDIANS 10 YEARS OF AGE AND OVER, CLASSIFIED BY SEX, AND AMONG INDIANS<br />
10 TO 19 YEARS OF AGE AND 20 YEARS OF AGE AND OVER, RESPECTIVELY, FOR EACH PRINCIPAL STOCK,<br />
' BY PRINCIPAL TRIBES AND BY PRINCIPAL STATES: <strong>1910</strong>—Cont<strong>in</strong>ued.<br />
(This table shows each stock hav<strong>in</strong>g 200 or more <strong>Indian</strong>s <strong>in</strong> <strong>1910</strong> <strong>and</strong> for each slock <strong>the</strong> tribe haviilg 100 or more. Per cent not shown where base is less than 60.]<br />
Table 93—Cont<strong>in</strong>ued.
ILLITERACY. 231<br />
ILLITEBATES AMONG INDIANS 10 YBABS OF AGE AND OVER, CLASSIFIED BY SEX, AND AMONG INDIANS<br />
10 TO 19 YEARS OF AGE AND 20 YEARS OF AGE AND OVER, RESPECTIVELY, FOR EACH PRINCIPAL STOCK,<br />
BY PRINCIPAL TRIBES AND BY PRINCIPAL STATES: <strong>1910</strong>—Cont<strong>in</strong>ued.<br />
[This table shows each stock hav<strong>in</strong>g 200 or more <strong>Indian</strong>s <strong>in</strong> <strong>1910</strong> <strong>and</strong> for each stock <strong>the</strong> tribe hav<strong>in</strong>g 100 or more. Per cent not shown where base is less than 50.]<br />
Table 93—Cont<strong>in</strong>ued:
Information as to ability to speak English was<br />
sought <strong>in</strong> <strong>the</strong> Federal census for <strong>the</strong> first time <strong>in</strong> 1890,<br />
but separate tabulation of <strong>Indian</strong>s <strong>in</strong> this particular<br />
was not made until 1900. The iaquiry at each census<br />
was limited to persons 10 years of age <strong>and</strong> over.<br />
Inability to speak English,, <strong>1910</strong> <strong>and</strong> 1900.—Table 94<br />
shows, for <strong>the</strong> <strong>United</strong> <strong>States</strong> <strong>in</strong> <strong>1910</strong> <strong>and</strong> 1900 <strong>and</strong> for<br />
<strong>Alaska</strong> ia <strong>1910</strong> only, <strong>the</strong> number <strong>and</strong> proportion of<br />
all <strong>Indian</strong>s 10 years of age <strong>and</strong> over who were reported<br />
as unable to speak English, <strong>and</strong> separately for those<br />
10 to 19 years of age <strong>and</strong> 20 years of age <strong>and</strong> over.<br />
Table 94<br />
INABILITY TO SPEAK ENGLISH.
Of <strong>the</strong> 22 selected states, as skown by Table 95, New<br />
Mexico bad <strong>in</strong> <strong>1910</strong> tbe largest proportion of <strong>Indian</strong>s<br />
who were unable to speak English, represent<strong>in</strong>g 74.8<br />
per cent of aU <strong>the</strong> <strong>Indian</strong> males 10 years of age <strong>and</strong><br />
over <strong>and</strong> 81.1 per cent of all <strong>the</strong> <strong>Indian</strong> females of that<br />
age. Arizona <strong>and</strong> Utah also showed large proportions<br />
<strong>in</strong> <strong>1910</strong>, represent<strong>in</strong>g <strong>in</strong> <strong>the</strong> case of males more than<br />
three-fifths <strong>and</strong> <strong>in</strong> <strong>the</strong> case of females more than seven-<br />
tenths of <strong>the</strong> entire number 10 years of age <strong>and</strong> over.<br />
The sftiallest proportions of <strong>Indian</strong>s <strong>in</strong> <strong>1910</strong> who could<br />
INABILITY TO SPEAK ENGLISH. 233<br />
not speak Enghsh are shown for 'New York, North<br />
Carol<strong>in</strong>a, <strong>and</strong> Kansas, for which, except <strong>in</strong> <strong>the</strong> case of<br />
females for New York, less than 10 per cent were so<br />
reported. With few exceptions <strong>the</strong> proportions unable<br />
to speak English <strong>in</strong> <strong>1910</strong> were much less than <strong>in</strong> 1900.<br />
Table 96 shows, for <strong>the</strong> 22 selected states, <strong>the</strong> number<br />
<strong>and</strong> proportion of <strong>Indian</strong> males <strong>and</strong> females 10 to 19<br />
years of age <strong>and</strong> 20 years of age <strong>and</strong> over, respec-<br />
tively, unable to speak Enghsh, as reported at <strong>the</strong><br />
census of <strong>1910</strong>.<br />
INDIAN MALES AND FEMALES 10 TO 19 YEARS OF AGE AND 20 YEARS OF AGE AND OVER, RESPECTIVELY,<br />
UNABLE TO SPEAK ENGLISH, FOR 22 SELECTED STATES: <strong>1910</strong>.<br />
Table 96
234 INDIANS IN THE UNITED STATES.<br />
INDIAN MALES AND FEMALES 10 YEARS OF AGE AND OVER, 10 TO 19 YEARS OF AGE AND 20 YEARS OF AGE<br />
AND OVER, RESPECTIVELY, UNABLE TO SPEAK ENGLISH, BY PRINCIPAL STOCKS: <strong>1910</strong>.<br />
Table 97
INABILITY TO SPEAK ENGLISH. 235<br />
PER CENT UNABLE TO SPEAK ENGLISH AMONG INDIANS 10 TO 19 YEARS OF AGE AND 20 YEARS OF AGE AND<br />
OVER, IN EACH PRINCIPAL TRIBE: <strong>1910</strong>.<br />
NAVAJO<br />
ZUNI<br />
P/!t>AQO<br />
APACHE<br />
LAGUNA<br />
HOPI<br />
CROW<br />
PIMA<br />
UTE<br />
CHEYENNE<br />
PIEGAN<br />
ASSINIBOrN<br />
YANKTONAI SIOUX<br />
TETON SrOUX<br />
KIOWA<br />
YANKTON SrOUX<br />
COMANCHE<br />
SHOSHONI<br />
SEMINOLE<br />
ARAPAHO<br />
YAKIMA<br />
WINNEBAGO<br />
MOHAVE<br />
SISSETON SIOUX<br />
CHIPPEWA<br />
OMAHA<br />
CREEK<br />
NEZ PERCES<br />
ST. REGIS<br />
CHOCTAW<br />
MONO<br />
MENOMINEE<br />
PAVIOTSO<br />
OTTAWA<br />
SANTEE SIOUX<br />
SHAWNEE<br />
POTAWATOMI<br />
OSAGE<br />
CHEROKEE<br />
ONEIDA<br />
SENECA<br />
CHICKASAW<br />
MAIDU<br />
/y:«iy!y.»vxyy;/!:^SA/vs(SOvy:AK»:xx;wKA«/yy;«AC^KX^»>v:«ff^<br />
PER CENT<br />
60<br />
»»K!»!X^^C^»S«ie«IS««»^^M;««^^KO»»^^»X»5«aQ«»!»K<br />
MKA«K«^ffOK«e««SeffffffAW«OSeAeeff»:«»JA9A^^^Ce0509'i«Kfi^l<br />
XV»W&>»»V9K^OQ»KOV:OS#'»!y!K»A»QOK«!<br />
g?a ijMrn)}<br />
m<br />
»K«»VV!»!MV!:KMiUQOM»»«!»M«&IUSe«K»S09HySOSlM#SOQa<br />
r//>»»!K«ic»v:«»»&«oxvyy%n»s«mffA«A^»s«m-.A»K<br />
VZZZ2<br />
»»»»WM»5B««5l!OM««l»i«»^^»M05MIK<br />
TZZZZi^ZZZZ<br />
/y//// y/y^<br />
^i<br />
m<br />
B!<br />
!»<br />
IB<br />
90 YEARS OF AQE AND OVER<br />
Xr/7///^ 10 TO 19 YEARS OF AOe
236 INDIANS IN THE UNITED STATES.<br />
INDIAN MALES AND FEMALES 10 YEARS OF AGE AND OVER UNABLE TO SPEAK ENGLISH, CLASSIFIED BY<br />
AGE PERIODS, BY DIVISIONS AND STATES: <strong>1910</strong> AND 1900.<br />
Table 98
INABILITY TO SPEAK ENGLISH. 237<br />
INDIAN MALES AND FEMALES 10 YEARS OF AGE AND OVER UNABLE TO SPEAK ENGLISH, CLASSIFIED BY AGE<br />
PERIODS, BY STOCKS, PRINCIPAL TRIBES, AND PRINCIPAL STATES: <strong>1910</strong>.<br />
Table 99<br />
[This table shows each tribe hav<strong>in</strong>g XOO or more <strong>Indian</strong>s <strong>in</strong> <strong>1910</strong>.]
238 INDIANS IN THE UNITED STATES.<br />
INDIAN MALES AND FEMALES 10 YEARS OF AGE AND OVER UNABLE TO SPEAK ENGLISH, CLASSIFIED BY AGE<br />
PERIODS, BY STOCKS, PRINCIPAL TRIBES, AND PRINCIPAL STATES: igiO-Cont<strong>in</strong>ued.<br />
Table 99—Cont<strong>in</strong>ued.<br />
(This table shows each tribe bay<strong>in</strong>g 100 or more <strong>Indian</strong>s <strong>in</strong> <strong>1910</strong>.]
INABILITY TO SPEAK ENGLISH. 239<br />
INDIAN MALES AND FEMALES 10 YEARS OP AGE AND OVER UNABLE TO SPEAK ENGLISH, CLASSIFIED BY AGE<br />
PERIODS, BY STOCKS, PRINCIPAL TRIBES, AND PRINCIPAL STATES: IQIO-Cont<strong>in</strong>ued.<br />
Table 99—Cont<strong>in</strong>ued.<br />
[This table shows each tribe hav<strong>in</strong>g 100 or more <strong>Indian</strong>s <strong>in</strong> <strong>1910</strong>.]
240 INDIANS IN THE UNITED STATES.<br />
INDIAN MALES AND FEMALES 10 YEARS OF AGE AND OVER UNABLE TO SPEAK ENGLISH, CLASSIFIED BY AGE<br />
PERIODS, BY STOCKS, PRINCIPAL TRIBES, AND PRINCIPAL STATES: 19ia-Cont<strong>in</strong>ued.<br />
Table 99—Cont<strong>in</strong>ued.<br />
[This table shows each tribe hav<strong>in</strong>g 100 or more <strong>Indian</strong>s <strong>in</strong> <strong>1910</strong>.]
INABILITY TO SPEAK ENGLISH. 241<br />
INDIAN MALES AND FEMALES 10 YEARS OF AGE AND OVER UNABLE TO SPEAK ENGLISH, CLASSIFIED BY AGE<br />
PERIODS, BY STOCKS, PRINCIPAL TRIBES, AND PRINCIPAL STATES: <strong>1910</strong>—Cont<strong>in</strong>ued.<br />
Table 99—Cont<strong>in</strong>ued.<br />
[This table shows each tribe hay<strong>in</strong>g 100 or more <strong>Indian</strong>s <strong>in</strong> <strong>1910</strong>.]
242 INDIANS IN THE UNITED STATES.<br />
INDIAN MALES AND FEMALES 10 YEARS OF AGE AND OYER UNABLE TO SPEAK ENGLISH, CLASSIFIED BY AGE<br />
PERIODS, BY STOCKS, PRINCIPAL TRIBES, AND PRINCIPAL STATES: <strong>1910</strong>—Cont<strong>in</strong>ued.<br />
Table 99—Cont<strong>in</strong>ued.<br />
[This table shows each tribe hav<strong>in</strong>g 100 or more <strong>Indian</strong>s In <strong>1910</strong>.]
INABILITY TO SPEAK ENGLISH. 243<br />
INDIAN MALES AND FEMALES 10 YEARS OP AGE AND OVER UNABLE TO SPEAK ENGLISH, CLASSIFIED BY AGE<br />
PERIODS, BY STOCKS, PRINCIPAL TRIBES, AND PRINCIPAL STATES: <strong>1910</strong>—Cont<strong>in</strong>ued.<br />
Table 99—Cont<strong>in</strong>ued.<br />
[This table shows each tribe hav<strong>in</strong>g 100 or more iBdians <strong>in</strong> <strong>1910</strong>.)
244 INDIANS IN THE UNITED STATES.<br />
INDIANS 10 YEARS OF AGE AND OVER, CLASSIFIED BY SEX, AND INDIANS 10 TO 19 YEARS OP AGE AND 20<br />
• PRINCIPAL<br />
YEARS OF AGE AND OVER, RESPECTIVELY, UNABLE TO SPEAK ENGLISH, FOR EACH PRINCIPAL STOCK, BY<br />
TRIBES AND BY PRINCIPAL STATES: <strong>1910</strong>.<br />
[This table shows each stock hav<strong>in</strong>g 200 or more <strong>Indian</strong>s <strong>in</strong> <strong>1910</strong>, <strong>and</strong> for each stock <strong>the</strong> tribe hav<strong>in</strong>g 100 or more. Per cent not shown where base is less than SO.]<br />
Table 100
INABILITY TO SPEAK ENGLISH. 245<br />
INDIANS 10 YEARS OF AGE AND OVER, CLASSIFIED BY SEX, AND INDIANS 10 TO 19 YEARS OP AGE AND 20<br />
YEARS OF AGE AND OVER^ RESPECTIVELY, UNABLE TO SPEAK ENGLISH, FOR EACH PRINCIPAL STOCK,<br />
BY PRINCIPAL TRIBES AND BY PRINCIPAL STATES: <strong>1910</strong>—Cont<strong>in</strong>ued.<br />
[This table shpws each stock bav<strong>in</strong>g 200 oi more <strong>Indian</strong>s <strong>in</strong> <strong>1910</strong>, <strong>and</strong> for each stock <strong>the</strong> tribe hay<strong>in</strong>g 100 or more. Per cent not shown where base is less than 50.]<br />
Table 100—Cont<strong>in</strong>ued.
246 INDIANS IN THE UNITED STATES.<br />
INDIANS 10 YEARS OF AGE AND OVER, CLASSIFIED BY SEX, AND INDIANS 10 TO 19 YEAES OP AGE AND 20<br />
YEARS OP AGE AND OVER, RESPECTIVELY, UNABLE TO SPEAK ENGLISH, FOR EACH PRINCIPAL STOCK,<br />
BY PRINCIPAL TRIBES AND BY PRINCIPAL STATES: <strong>1910</strong>—Cont<strong>in</strong>ued.<br />
[This table shows each stock hav<strong>in</strong>g 200 or more <strong>Indian</strong>s <strong>in</strong> <strong>1910</strong>, <strong>and</strong> for each stock <strong>the</strong> tribe hav<strong>in</strong>g 100 or more. Per cent not shown where base ialess than 50.)<br />
Table 100—Cont<strong>in</strong>ued.
INABILITY TO SPEAK ENGLISH. 247<br />
INDIANS 10 YEARS OP AGE AND OVER, CLASSIFIED BY SEX, AND INDIANS 10 TO 19 YEARS OF AGE AND 20<br />
YEARS OF AGE AND OVER, RESPECTIVELY, UNABLE TO SPEAK ENGLISH, FOR EACH PRINCIPAL STOCK, BY<br />
PRINCIPAL TRIBES.AND BY PRINCIPAL STATES: <strong>1910</strong>—Cont<strong>in</strong>ued.<br />
[TUs table shows each stock hav<strong>in</strong>g 200 or more <strong>Indian</strong>s <strong>in</strong> <strong>1910</strong>, <strong>and</strong> for each stock <strong>the</strong> tribe hay<strong>in</strong>g 100 or more. Per cent not shown where base is less than 60,]<br />
Table 100—Cont<strong>in</strong>ued.
248 INDIANS IN THE UNITED STATES.<br />
INDIANS 10 YEARS OF AGE AND OVER, CLASSIFIED BY SEX, AND INDIANS 10 TO 19 YEARS OF AGE AND 20<br />
YEARS OF AGE AND OVER, RESPECTIVELY, UNABLE TO SPEAK ENGLISH, FOR EACH PRINCIPAL STOCK, BY<br />
PRINCIPAL TRIBES AND BY PRINCIPAL STATES: <strong>1910</strong>—Cont<strong>in</strong>ued.<br />
[This table shows each stock hav<strong>in</strong>g 200 or more <strong>Indian</strong>s In <strong>1910</strong>, <strong>and</strong> for each stock <strong>the</strong> tribe hav<strong>in</strong>g 100 or more. Per cent not shown where base Is less than 50.)<br />
Table lOO-Cont<strong>in</strong>ued.
INABILITY TO SPEAK ENGLISH. 249<br />
INDIANS 10 YEARS OF AGE AND OVER, CLASSIFIED BY SEX, AND INDIANS 10 TO 19 YEARS OF AGE AND 20<br />
YEARS OF AGE AND OVER, RESPECTIVELY, UNABLE TO SPEAK ENGLISH, FOR EACH PRINCIPAL STOCK, BY<br />
PRINCIPAL TRIBES AND BY PRINCIPAL STATES: <strong>1910</strong>—Cont<strong>in</strong>ued.<br />
[This table shows each stock hav<strong>in</strong>g 200 or more <strong>Indian</strong>s <strong>in</strong> <strong>1910</strong>, <strong>and</strong> for each stock <strong>the</strong> tribe hav<strong>in</strong>g 100 or more. Per cent not shown where base is less than 50.]<br />
Table lOO—Cont<strong>in</strong>ued.
"<strong>the</strong> <strong>in</strong>quiry with, respect to occupations at <strong>the</strong><br />
Thirteenth Census called for a statement as to <strong>the</strong><br />
"trade or profession of, or particular k<strong>in</strong>d of work<br />
done" by each person engaged <strong>in</strong> ga<strong>in</strong>ful labor, <strong>and</strong><br />
also as to <strong>the</strong> "general nature of <strong>in</strong>dustry, bus<strong>in</strong>ess, or<br />
establishment" <strong>in</strong> which <strong>the</strong> person worked. The<br />
statistics of <strong>the</strong> occupations of <strong>Indian</strong>s reported <strong>in</strong><br />
this volume are limited to ga<strong>in</strong>ful workers 10 years of<br />
age <strong>and</strong> upward. The term "ga<strong>in</strong>ful workers," as<br />
used <strong>in</strong> <strong>the</strong> pr<strong>in</strong>ted <strong>in</strong>structions to enumerators <strong>and</strong><br />
<strong>in</strong> this report, <strong>in</strong>cludes all workers, except women<br />
do<strong>in</strong>g housework <strong>in</strong> <strong>the</strong>ir own homes, without salary<br />
or wages, <strong>and</strong> hav<strong>in</strong>g no o<strong>the</strong>r employment, <strong>and</strong><br />
children work<strong>in</strong>g at home, merely on general household<br />
work, on chores, or at odd times on o<strong>the</strong>r work.<br />
Sufficiency oj <strong>the</strong> occupation returns.—In general, <strong>the</strong><br />
occupations of <strong>the</strong> <strong>Indian</strong>s were not so carefully retm-ned<br />
by <strong>the</strong> enumerators as were <strong>the</strong> occupations<br />
of <strong>the</strong> whites. No doubt this was due largely to <strong>the</strong><br />
greater difficulty of <strong>the</strong> task, but <strong>in</strong> some cases, pos-<br />
sibly, it was due to <strong>the</strong> <strong>in</strong>efficiency or carelessness of<br />
<strong>the</strong> enumerators. In <strong>Alaska</strong> <strong>the</strong> enumeration was <strong>in</strong><br />
<strong>the</strong> w<strong>in</strong>ter. In some of <strong>the</strong> outly<strong>in</strong>g sparsely populated<br />
districts it was necessary to use as enumerators<br />
persons of very limited educational qualifications.<br />
Moreover, <strong>the</strong> <strong>Indian</strong> <strong>population</strong> of <strong>Alaska</strong> is <strong>in</strong> large<br />
part illiterate. Under <strong>the</strong>se conditions enumeration<br />
was at best difficult. But, because of <strong>the</strong> fact that <strong>the</strong><br />
<strong>Alaska</strong> <strong>Indian</strong>s are ma<strong>in</strong>ly hunt'ers, trappers, fishermen,<br />
<strong>and</strong> deer herders <strong>and</strong> keepers, <strong>the</strong>re was little<br />
danger of <strong>the</strong> enumerators confus<strong>in</strong>g occupations.<br />
However, some of <strong>the</strong>se <strong>Indian</strong>s may have been missed<br />
entirely, <strong>and</strong> probably o-<strong>the</strong>rs were returned as ga<strong>in</strong>fully<br />
occupied when <strong>the</strong>y should not have been. In<br />
edit<strong>in</strong>g <strong>the</strong> returns both for <strong>the</strong> <strong>United</strong> <strong>States</strong> proper<br />
<strong>and</strong> for <strong>Alaska</strong> <strong>the</strong> most improbable cases of <strong>Indian</strong>s<br />
returned as ga<strong>in</strong>fully occupied were rejected; but,<br />
notwithst<strong>and</strong><strong>in</strong>g this, it is probable that too many of<br />
<strong>the</strong> <strong>Indian</strong>s are reported as ga<strong>in</strong>ful workers. This is<br />
certa<strong>in</strong>ly true <strong>in</strong> <strong>the</strong> case of particular tribes, where<br />
<strong>the</strong> proportion ga<strong>in</strong>fully employed exceeds 60 per<br />
cent.<br />
Number <strong>and</strong> 'proportion occupied.—Table 101 shows,<br />
for <strong>the</strong> <strong>United</strong> <strong>States</strong> <strong>and</strong> for <strong>Alaska</strong>, <strong>the</strong> number of<br />
<strong>Indian</strong>s engaged <strong>in</strong> ga<strong>in</strong>ful occupations <strong>in</strong> comparison<br />
with <strong>the</strong> total <strong>Indian</strong> <strong>population</strong> <strong>and</strong> with <strong>the</strong> <strong>Indian</strong><br />
<strong>population</strong> 10 years of age <strong>and</strong> over, for both sexes<br />
<strong>and</strong> for each sex separately, at <strong>the</strong> censuses of <strong>1910</strong><br />
<strong>and</strong> 1900, respectively.<br />
(250)<br />
OCCUPATIONS.<br />
Tab
For <strong>the</strong> male <strong>Indian</strong> <strong>population</strong> 10 years of age <strong>and</strong><br />
over <strong>the</strong> "proportion ga<strong>in</strong>fidly occupied <strong>in</strong>creased from<br />
59.2 per cent <strong>in</strong> 1900 to 61.3 per cent <strong>in</strong> <strong>1910</strong>, while for<br />
<strong>the</strong> female <strong>Indian</strong> <strong>population</strong> 10 years of age <strong>and</strong><br />
over <strong>the</strong> proportion ga<strong>in</strong>fully occupied <strong>in</strong>creased from<br />
13.8 per cent <strong>in</strong> 1900 to 16 per cent <strong>in</strong> <strong>1910</strong>.<br />
In <strong>Alaska</strong> <strong>the</strong> proportion of <strong>the</strong> total <strong>Indian</strong> <strong>population</strong><br />
engaged <strong>in</strong> ga<strong>in</strong>ful occupations decreased from<br />
43.1 per cent <strong>in</strong> 1900 to 32.1 per cent <strong>in</strong> <strong>1910</strong>, while<br />
<strong>the</strong> proportion of <strong>the</strong> <strong>population</strong> 10 years of age <strong>and</strong><br />
over engaged <strong>in</strong> ga<strong>in</strong>ful occupations decreased from<br />
55.2 per cent <strong>in</strong> 1900 to 45 per cent <strong>in</strong> <strong>1910</strong>. This<br />
great decl<strong>in</strong>e was conf<strong>in</strong>ed ma<strong>in</strong>ly to females, <strong>the</strong> pro-<br />
portion ga<strong>in</strong>fully employed be<strong>in</strong>g 22.1 per cent <strong>in</strong><br />
1900, as compared with 6.1 per cent <strong>in</strong> <strong>1910</strong>, for <strong>the</strong><br />
total female <strong>Indian</strong> <strong>population</strong>, <strong>and</strong> 28.2 per cent <strong>in</strong><br />
1900, as compared with 8.7 per cent <strong>in</strong> <strong>1910</strong>, for <strong>the</strong><br />
female <strong>Indian</strong> <strong>population</strong> 10 years of age <strong>and</strong> over'.<br />
This decl<strong>in</strong>e, moreover, was conf<strong>in</strong>ed pr<strong>in</strong>cipally to a<br />
few occupations. The number of female <strong>Indian</strong>s<br />
returned as fishermen, or fish curers <strong>and</strong>, packers,<br />
decreased from 1,349 <strong>in</strong> 1900 to 298 <strong>in</strong> <strong>1910</strong>; <strong>the</strong> number<br />
returned as hunters, trappers, or guides decreased<br />
from 1,271 <strong>in</strong> 1900 to 46 <strong>in</strong> <strong>1910</strong>; <strong>and</strong> <strong>the</strong> nimiber<br />
returned as basket makers decreased from 274 <strong>in</strong> 1900<br />
to 93 <strong>in</strong> <strong>1910</strong>. These decreases, amoimt<strong>in</strong>g to 2,457,<br />
more than equal <strong>the</strong> decrease from 1900 to <strong>1910</strong> <strong>in</strong> <strong>the</strong><br />
number of female <strong>Indian</strong>s ga<strong>in</strong>fully employed <strong>in</strong><br />
<strong>Alaska</strong>. It is impossible to determ<strong>in</strong>e from <strong>the</strong> figures<br />
to what extent <strong>the</strong>se great decreases were real <strong>and</strong> to<br />
what extent <strong>the</strong>y were apparent only <strong>and</strong> due to<br />
<strong>in</strong>accuracies <strong>in</strong> enumeration at <strong>the</strong> two censuses; but<br />
a comparison with <strong>the</strong> statistics show<strong>in</strong>g <strong>the</strong> proportion<br />
of <strong>the</strong> female <strong>Indian</strong>s of <strong>the</strong> <strong>United</strong> <strong>States</strong> proper<br />
engaged <strong>in</strong> ga<strong>in</strong>ful occupations <strong>in</strong> 1900 <strong>and</strong> <strong>in</strong> <strong>1910</strong>,<br />
OCCUPATIONS. 251<br />
respectively (Table 101), <strong>in</strong>dicates that <strong>the</strong> proportion<br />
reported for <strong>the</strong> female <strong>Indian</strong>s of <strong>Alaska</strong> probably<br />
was too large for 1900 <strong>and</strong> too smaU for <strong>1910</strong>.<br />
Table 102 shows, for each of 22 selected states, <strong>the</strong><br />
number <strong>and</strong> proportion of males <strong>and</strong> females 10 years<br />
of age <strong>and</strong> over engaged <strong>in</strong> ga<strong>in</strong>ful occupations <strong>in</strong><br />
<strong>1910</strong>, while similar statistics are presented for each<br />
pr<strong>in</strong>cipal stock <strong>and</strong> tribe <strong>in</strong> <strong>the</strong> <strong>United</strong> <strong>States</strong> <strong>and</strong><br />
<strong>Alaska</strong> <strong>in</strong> Table 103 (p. 253). The proportion of each<br />
sex engaged <strong>in</strong> ga<strong>in</strong>ful occupations <strong>in</strong> each pr<strong>in</strong>cipal<br />
tribe is also shown graphically <strong>in</strong> <strong>the</strong> diagram on<br />
page 252.<br />
Table 102
252 INDIANS IN THE UNITED STATES.<br />
PERCENTAGE OF INDIAN MALES AND FEMALES 10 YEARS OF AGE AND OVER ENGAGED IN<br />
GAINFUL OCCUPATIONS, IN EACH PRINCIPAL TRIBE: <strong>1910</strong>.<br />
CROATAN<br />
ONEIDA<br />
ZUNr<br />
MAIDU<br />
OTTAWA<br />
PAPAGO<br />
MONO<br />
NAVAJO<br />
LAQUNA<br />
ST. REQIS<br />
SHOSHONI<br />
CHEROKEE<br />
SHAWNEE<br />
APACHE<br />
SANTEE SIOUX<br />
MOHAVE<br />
CHIPPEWA<br />
CHOCTAW<br />
SENECA<br />
MENOMINEE<br />
PIMA<br />
CROW<br />
SEMINOLE<br />
HOPI<br />
POTAWATOMI<br />
CREEK<br />
OMAHA<br />
NEZ PERCES<br />
CHICKASAW<br />
YANKTONAI SIOUX<br />
PAVIOTSO<br />
CHEYENNE<br />
ARAPAHO<br />
YANKTON SIOUX<br />
UTE<br />
SISSETON SIOUX<br />
KIOWA<br />
COMANCHE<br />
PIEQAN<br />
.TETON SIOUX<br />
ASSINIBOIN<br />
WINNEBAQO<br />
OSAQE<br />
YAKIMA<br />
^<br />
wr.XM^'^K^/:^^/:^^^^ k«»:k ^vvxoyvx^ ^»^iv^r^^avK loui^OBKKXi I<br />
9<br />
BH<br />
mA\<br />
wAm<br />
!H "ZZZx<br />
mt<br />
w<br />
«!<br />
M<br />
BB<br />
^^^<br />
S^Z<br />
^mm<br />
m^m.<br />
w<br />
^<br />
w m<br />
w<br />
w<br />
•ZZZZZ ZZZZZi c2<br />
5«a<br />
HB<br />
im a<br />
I Ml<br />
^P<br />
m\<br />
Z//£Z/,UZ£Z. zzzzziz.<br />
^^S ^^S ^^S i<br />
mi<br />
2ZZZZ1 ZZZZZZ<br />
tmm<br />
m.m e us<br />
W/////\ FEMALES
OCCUPATIONS. 253<br />
NUMBER AND PROPORTION OP INDIANS OF EACH SEX 10 YEARS OF AGE AND OVER ENGAGED IN GAINFUL<br />
OCCUPATIONS, FOR PRINCIPAL STOCKS AND TRIBES: <strong>1910</strong>.<br />
Table 103<br />
[This table shows each stock <strong>and</strong> tribe hav<strong>in</strong>g 200 or more <strong>Indian</strong>s <strong>in</strong> <strong>1910</strong>.]
254 INDIANS IN THE UNITED STATES.<br />
NUMBER AND PROPORTION OF INDIANS OP EACH SEX 10 YEARS OF AGE AND OVER ENGAGED IN GAINFUL<br />
OCCUPATIONS, FOR PRINCIPAL STOCKS AND TRIBES: <strong>1910</strong>—Cont<strong>in</strong>ued.<br />
Table 103—Cont<strong>in</strong>ued.<br />
[This table shows each stock <strong>and</strong> tribe hav<strong>in</strong>g 200 or more <strong>Indian</strong>s <strong>in</strong> <strong>1910</strong>.]
Number <strong>and</strong> proportion <strong>in</strong> <strong>the</strong> general divisions of<br />
occupations.—Table 104 shows, for both sexes <strong>and</strong> for<br />
each sex separately, <strong>the</strong> number of ga<strong>in</strong>fully occupied<br />
<strong>Indian</strong>s <strong>in</strong> <strong>the</strong> <strong>United</strong> <strong>States</strong> <strong>in</strong> <strong>1910</strong>, distributed by<br />
general divisions of occupations.<br />
Table 104<br />
SEX AND GENERAL DIVISION OF OCCUPATIONS.<br />
All occupations.<br />
Both Sexes.<br />
Agriculture, forestry, <strong>and</strong> animal husb<strong>and</strong>ry.<br />
Ertraction of m<strong>in</strong>erals<br />
Manufactur<strong>in</strong>g <strong>and</strong> mechanical <strong>in</strong>dustries<br />
Transportation<br />
Trade<br />
Public service (not elsewhere classified)<br />
.•<br />
Professional service<br />
Domestic <strong>and</strong> personal service<br />
Clerical occupations<br />
All occupations<br />
.<br />
MALE.<br />
Agriculture, forestry, <strong>and</strong> animal husb<strong>and</strong>ry.<br />
Extraction of m<strong>in</strong>erals<br />
Manufactur<strong>in</strong>g <strong>and</strong> mechanical <strong>in</strong>dustries<br />
Transportation<br />
Trade<br />
Public service (not elsewhere classified)<br />
Professional service<br />
Domestic <strong>and</strong> personal service<br />
Clerical occupations<br />
All occupations.<br />
FEMALE.<br />
Agriculture, forestry, <strong>and</strong> animal husb<strong>and</strong>ry.<br />
Extraction of m<strong>in</strong>erals<br />
Manufacturmg <strong>and</strong> mechanical <strong>in</strong>dustries<br />
Transportation<br />
Trade<br />
Public service (not elsewhere classified)<br />
Professional service<br />
Domestic <strong>and</strong> personal service<br />
Clerical occupations<br />
Number:<br />
<strong>1910</strong>.<br />
73,916<br />
51,070<br />
S63<br />
11,960<br />
1,930<br />
1,385<br />
752<br />
1,260<br />
4,609<br />
387<br />
59,206<br />
OCCUPATIONS. 255<br />
46,621<br />
553<br />
6,799<br />
1,909<br />
1,269<br />
733<br />
902<br />
1,118<br />
302<br />
14,710<br />
4,449<br />
10<br />
6.161<br />
21<br />
116<br />
19<br />
358<br />
3,491<br />
Per cent<br />
distribution.<br />
100.0<br />
69.1<br />
0.8<br />
16.2<br />
2.6<br />
1.9<br />
1.0<br />
1.7<br />
6.2<br />
0.5<br />
100.0<br />
7a 7<br />
0.9<br />
9.8<br />
3.2<br />
2,1<br />
1.2<br />
1.5<br />
1.9<br />
0.5<br />
100.0<br />
30.2<br />
0.1<br />
41.9<br />
0.1<br />
0.8<br />
0.1<br />
2.4<br />
23,7<br />
0,6<br />
Accord<strong>in</strong>g to Table 104, almost seven-tenths (69.1<br />
per cent) of <strong>the</strong> ga<strong>in</strong>fully occupied <strong>Indian</strong>s <strong>in</strong> <strong>the</strong><br />
<strong>United</strong> <strong>States</strong> <strong>in</strong> <strong>1910</strong> were engaged <strong>in</strong> agriculture,<br />
forestry, <strong>and</strong> animal husb<strong>and</strong>ry; <strong>and</strong> almost onesixth<br />
(16.2 per cent) of <strong>the</strong>m were engaged <strong>in</strong> manufactur<strong>in</strong>g<br />
<strong>and</strong> mechanical <strong>in</strong>dustries. Thus 85.3 per<br />
cent of <strong>the</strong> ga<strong>in</strong>fully occupied <strong>Indian</strong>s were engaged<br />
<strong>in</strong> <strong>the</strong>se two general divisions of occupations. Transportation<br />
gave employment to 2.6 per cent of <strong>the</strong> total,<br />
<strong>and</strong> domestic <strong>and</strong> personal service to 6.2 per cent, no<br />
o<strong>the</strong>r general division of occupations giv<strong>in</strong>g employment<br />
to as many as 2 per cent of <strong>the</strong> <strong>Indian</strong> workers.<br />
For <strong>the</strong> males, as for both sexes comb<strong>in</strong>ed, agriculture,<br />
forestry, <strong>and</strong> animal husb<strong>and</strong>ry gave employment<br />
to <strong>the</strong> largest proportion of <strong>the</strong> <strong>Indian</strong>s, 78.7 per<br />
cent, <strong>and</strong> manufactur<strong>in</strong>g <strong>and</strong> mechanical <strong>in</strong>dustries<br />
ranked second, with 9.8 per cent. Manufactur<strong>in</strong>g <strong>and</strong><br />
mechanical <strong>in</strong>dustries were <strong>the</strong> most important field<br />
of employment for <strong>the</strong> female <strong>Indian</strong> workers <strong>in</strong> <strong>1910</strong>,<br />
41.9 per cent of <strong>the</strong>m be<strong>in</strong>g engaged <strong>in</strong> this branch of<br />
occupations, as compared with 30.2 per cent <strong>in</strong> agri-<br />
culture, forestry, <strong>and</strong> animal husb<strong>and</strong>ry, <strong>and</strong> 23.7<br />
per cent <strong>in</strong> domestic <strong>and</strong> personal service.<br />
Occupations, by sex.— ^Table 105 shows, for <strong>the</strong><br />
<strong>United</strong> <strong>States</strong> <strong>and</strong> for <strong>Alaska</strong>, <strong>the</strong> number <strong>and</strong> sex of<br />
<strong>the</strong> <strong>Indian</strong>s 10 years of age <strong>and</strong> over engaged <strong>in</strong><br />
specified occupations <strong>and</strong> occupation groups <strong>in</strong> <strong>1910</strong>.<br />
Table 105 shows that <strong>in</strong> <strong>1910</strong> <strong>the</strong> <strong>Indian</strong>s of <strong>the</strong><br />
<strong>United</strong> <strong>States</strong> were employed <strong>in</strong> a ra<strong>the</strong>r large number<br />
of occupations. Their occupations also were quite<br />
diversified, rang<strong>in</strong>g all <strong>the</strong> way from unskilled labor to<br />
some of <strong>the</strong> highest proprietary, official, skilled, <strong>and</strong><br />
professional pursuits, such as manufacturers, bankers,<br />
<strong>United</strong> <strong>States</strong> officials, mechanical eng<strong>in</strong>eers, locomotive<br />
eng<strong>in</strong>eers, telegraph operators, actors, artists,<br />
clergymen, college professors, lawyers, <strong>and</strong> physicians<br />
<strong>and</strong> surgeons. But notwithst<strong>and</strong><strong>in</strong>g this diversity<br />
of <strong>the</strong> <strong>Indian</strong> occupations, it is never<strong>the</strong>less true that<br />
<strong>the</strong> great mass of <strong>the</strong> <strong>Indian</strong> workers <strong>in</strong> <strong>the</strong> <strong>United</strong><br />
<strong>States</strong> were engaged <strong>in</strong> a comparatively small num-<br />
ber of occupations. Almost 7 out of every 10<br />
(69.1 per cent) of <strong>the</strong> ga<strong>in</strong>fully occupied <strong>Indian</strong>s <strong>in</strong><br />
<strong>1910</strong> were engaged <strong>in</strong> agriculture, forestry, <strong>and</strong> animal<br />
husbanchy. Of <strong>the</strong> 225 occupations <strong>and</strong> occupation<br />
groups shown <strong>in</strong> Table 105, <strong>the</strong>re were only 39 that<br />
were pursued by lOf or more <strong>Indian</strong>s. Ten of <strong>the</strong>se<br />
occupations gave employment to 82.3 per cent of <strong>the</strong><br />
<strong>Indian</strong>s <strong>in</strong> ga<strong>in</strong>ful occupations, <strong>and</strong> 85.4 per cent of<br />
<strong>the</strong> total were employed <strong>in</strong> one of seven different large<br />
occupation groups: Agricultural laborers (35.5 per<br />
cent), farmers <strong>and</strong> stock raisers (29.2 per cent), lumbermen,<br />
raftsmen, <strong>and</strong> woodchoppers (2.4 per cent),<br />
laborers <strong>in</strong> manufactur<strong>in</strong>g <strong>and</strong> transportation (6.3<br />
per cent), basket makers <strong>and</strong> weavers (7.4 per cent),<br />
launderers <strong>and</strong> laundresses (1.9 per cent), <strong>and</strong> servants<br />
<strong>and</strong> waiters (2.6 per cent).<br />
For <strong>Alaska</strong>, Table 105 shows that while <strong>the</strong> ga<strong>in</strong>-<br />
fully occupied <strong>Indian</strong>s <strong>in</strong> <strong>1910</strong> were engaged <strong>in</strong> 85<br />
different occupations <strong>and</strong> occupation groups, rang<strong>in</strong>g<br />
all <strong>the</strong> way from fishermen <strong>and</strong> hunters to manufac-<br />
turers, Federal officials, clergymen, <strong>and</strong> school teachers,<br />
9 out of every 10 (90.1 per cent) were engaged<br />
<strong>in</strong> one of n<strong>in</strong>e different occupations <strong>and</strong> occupa-<br />
tion groups: Fishermen (24.1 per cent), re<strong>in</strong>deer<br />
herders <strong>and</strong> keepers (2.7 per cent), gold <strong>and</strong> silver<br />
m<strong>in</strong>e operatives (2.2 per. cent), laborers <strong>in</strong> <strong>the</strong> build<strong>in</strong>g<br />
'<strong>and</strong> h<strong>and</strong> trades (3.2 per cent), laborers <strong>and</strong><br />
semiskilled operatives <strong>in</strong> fish cur<strong>in</strong>g <strong>and</strong> pack<strong>in</strong>g (5.2<br />
per cent), basket <strong>and</strong> moccas<strong>in</strong> makers (1.5 per<br />
cent), retail dealers (1.5 per cent), hunters, trappers,<br />
<strong>and</strong> guides (47.8 per cent), <strong>and</strong> servants (1.9 per<br />
cent). Thus <strong>in</strong> <strong>1910</strong> fish<strong>in</strong>g, hunt<strong>in</strong>g, trapp<strong>in</strong>g, <strong>and</strong><br />
guid<strong>in</strong>g still gave employment to over seven-tenths<br />
(71.9 per cent) of <strong>the</strong> ga<strong>in</strong>fully employed <strong>Indian</strong>s of<br />
<strong>Alaska</strong>.
256 INDIANS IN THE UNITED STATES.<br />
NUMBER OF INDIANS 10 YEARS OF AGE AND OVER ENGAGED IN GAINFUL OCCUPATIONS, CLASSIFIED BY<br />
SEX: <strong>1910</strong>.<br />
Table 105<br />
All occupations.<br />
OCCUPATION. Total. Male. Female OCCUPATION. Total. Male. Female.<br />
Agriculture, forestry, <strong>and</strong> animal husb<strong>and</strong>ry.<br />
Dairy farm laborers<br />
Dairy fanners<br />
Farm, dairy farm, <strong>and</strong> orchard foremen<br />
Farm laborers<br />
Fanners<br />
Fishermen <strong>and</strong> oystermen<br />
Foresters<br />
Garden, orchard, <strong>and</strong> nursery laborers<br />
Gardeners, florists, fruit growers, <strong>and</strong> nurserymen .<br />
Lumbermen, raftsmen, <strong>and</strong> woodchoppers<br />
Owners <strong>and</strong> managers of log <strong>and</strong> timber camps<br />
Stock herders, drovers, <strong>and</strong> feeders<br />
Stock raisers<br />
O<strong>the</strong>r agricultural pursuits<br />
Extraction of m<strong>in</strong>erals<br />
Foremen <strong>and</strong> overseers<br />
Operators<br />
Coal m<strong>in</strong>e operatives<br />
Copper m<strong>in</strong>e operatives<br />
Gold <strong>and</strong> silver m<strong>in</strong>e operatives.<br />
Lead <strong>and</strong> z<strong>in</strong>c m<strong>in</strong>e operatives. .<br />
All o<strong>the</strong>r m<strong>in</strong>e operatives<br />
Quarry operatives<br />
Oil, gas, <strong>and</strong> salt well operatives.<br />
Manufactur<strong>in</strong>g <strong>and</strong> mechanical <strong>in</strong>dustries.<br />
Apprentices<br />
Bakers<br />
Blacksmiths<br />
Boiler makers<br />
Brick <strong>and</strong> stone masons<br />
Builders <strong>and</strong> build<strong>in</strong>g contractors<br />
Butchers (slaughterhouse)<br />
Cab<strong>in</strong>etmakers<br />
Carpenters<br />
Compositors, l<strong>in</strong>otypers, <strong>and</strong> typesetters<br />
Coopers<br />
Dressmakers <strong>and</strong> seamstresses (not In factory). .<br />
Dyers.<br />
Electricians <strong>and</strong> electrical eng<strong>in</strong>eers<br />
Electrotypers, stereotypers, <strong>and</strong> lithographers<br />
Eng<strong>in</strong>eers (mechanical)<br />
Eng<strong>in</strong>eers (stationary)<br />
Filers, gr<strong>in</strong>ders, buffers, <strong>and</strong> polishers (metal)<br />
Firemen (except locomotive <strong>and</strong> fire department) .<br />
Foremen <strong>and</strong> overseers (manufactur<strong>in</strong>g)<br />
Furnace men, smelter men, heaters, pourers, etc<br />
Jewelers, watchmakers^ goldsmiths, <strong>and</strong> silversmiths<br />
Iiaborers (n. o. s.i):<br />
Brick, tile, <strong>and</strong> terra.cotta factories<br />
Build<strong>in</strong>e <strong>and</strong> h<strong>and</strong> trades<br />
Chemical <strong>in</strong>dustries<br />
Copper factories<br />
Electric light <strong>and</strong> power plants<br />
Food <strong>in</strong>dustries<br />
Iron <strong>and</strong> steel <strong>in</strong>dustries<br />
Lime, cement, <strong>and</strong> gypsum factories.<br />
.<br />
.<br />
Lumber <strong>and</strong> furniture <strong>in</strong>dustries<br />
—<br />
Saw <strong>and</strong> plan<strong>in</strong>g mills<br />
O<strong>the</strong>r woodwork<strong>in</strong>g factories<br />
Paper <strong>and</strong> pulp mills<br />
Potteries<br />
Shoe factories<br />
Textile <strong>in</strong>dustries<br />
O<strong>the</strong>r <strong>in</strong>dustries<br />
Mach<strong>in</strong>ists, millwrights, <strong>and</strong> toolmakers<br />
Managers <strong>and</strong> super<strong>in</strong>tendents (manufactur<strong>in</strong>g)<br />
Manufacturers<br />
Mechanics (n. o. s.'):<br />
Gunsmiths, locksmiths, <strong>and</strong> bellhangers<br />
Wheelwrights<br />
O<strong>the</strong>r medianlcs<br />
Millers (gra<strong>in</strong>, flour, feed, etc.)<br />
Mill<strong>in</strong>ers <strong>and</strong> mill<strong>in</strong>ery dealers<br />
Molders (iron)<br />
Oilers of mach<strong>in</strong>ery<br />
Pafaiters, glaziers, vamlshers, enamelers, etc<br />
Paper hangers<br />
Pattern <strong>and</strong> model makers<br />
Plasterers<br />
Plumbers <strong>and</strong> gas <strong>and</strong> steam fitters<br />
Pressmen (pr<strong>in</strong>t<strong>in</strong>g)<br />
Eoofers.<br />
Sawyers<br />
Semiskilled operatives (n. o. s.)<br />
Hostlers <strong>and</strong> stable h<strong>and</strong>s<br />
Inspectors (steam railroad)<br />
Laborers (n. o. s.'):<br />
Boad <strong>and</strong> street build<strong>in</strong>g <strong>and</strong> repair<strong>in</strong>g<br />
Steam railroad<br />
Street cleanhig<br />
Street railroad<br />
O<strong>the</strong>r transportation<br />
Livery stable keepers <strong>and</strong> managers<br />
Locomotive eng<strong>in</strong>eers<br />
Locomotive firemen<br />
Longshoremen <strong>and</strong> stevedores<br />
Mail carriers<br />
Motormen<br />
Proprietors of transfer companies<br />
Proprietors, officials, <strong>and</strong> managers (telegraph <strong>and</strong><br />
telephone companies)<br />
Sailors <strong>and</strong> deck n<strong>and</strong>s<br />
Switchmen <strong>and</strong> flagmen (steam railroad)<br />
Telegraph <strong>and</strong> telephone l<strong>in</strong>emen<br />
Telegraph messengers<br />
Telegraph operators<br />
Telephone operators<br />
Ticket <strong>and</strong> station agents ,<br />
O<strong>the</strong>r occupations (semiskilled) ,<br />
Trade.<br />
I Not o<strong>the</strong>rwise specified.<br />
Bankers, brokers, <strong>and</strong> money lenders<br />
Clerks <strong>in</strong> stores<br />
Commercial travelers<br />
Decorators, drapers, <strong>and</strong> w<strong>in</strong>dow dressers<br />
Delivery men<br />
Inspectors, gangers, <strong>and</strong> samplers<br />
Insurance agents <strong>and</strong> officials<br />
Laborers <strong>in</strong> coal <strong>and</strong> lumber yards, warehouses, etc.;<br />
Coal yards<br />
Lumberyards<br />
Warehouses, etc<br />
Laborers, porters, <strong>and</strong> helpers <strong>in</strong> stores<br />
Newsboys<br />
Proprietors, officials, <strong>and</strong> managers (n. o. s. >)<br />
Beal estate agents <strong>and</strong> oflicials<br />
Retail dealers<br />
Salesmen <strong>and</strong> saleswomen (stores)<br />
Undertakers<br />
Wholesale dealers<br />
O<strong>the</strong>r pursuits (semiskilled)<br />
Public service (not elsewhere classified)<br />
Firemen (fire department)<br />
Guards, watchmen, <strong>and</strong> doorkeepers.<br />
Laborers (public service)<br />
Life-savers<br />
Lighthouse keepers<br />
.<br />
1,348<br />
102<br />
41<br />
4<br />
161<br />
17<br />
65<br />
4,148<br />
29<br />
162<br />
27<br />
41<br />
1,930<br />
8<br />
17<br />
23<br />
23<br />
3<br />
2<br />
412<br />
1<br />
12<br />
2<br />
1<br />
66<br />
6<br />
247<br />
769<br />
1<br />
4<br />
32<br />
46<br />
5<br />
11<br />
67<br />
51<br />
1,385<br />
64<br />
120<br />
9<br />
2<br />
68<br />
S<br />
13<br />
16<br />
95<br />
6<br />
46<br />
7<br />
6<br />
153<br />
616<br />
254<br />
3<br />
4<br />
10<br />
762<br />
126<br />
100<br />
32<br />
3<br />
1<br />
12<br />
5<br />
120<br />
15<br />
61<br />
2<br />
40<br />
1<br />
3<br />
20<br />
3<br />
56<br />
7<br />
1<br />
1,909<br />
8<br />
17<br />
23<br />
23<br />
3<br />
2<br />
412<br />
1<br />
11<br />
2<br />
1<br />
66<br />
6<br />
247<br />
762<br />
1<br />
4<br />
32<br />
46<br />
6<br />
11<br />
67<br />
49<br />
»<br />
2<br />
68<br />
6<br />
12<br />
IS<br />
95<br />
6<br />
44<br />
7<br />
6<br />
149<br />
478<br />
209<br />
3<br />
4<br />
7<br />
733<br />
1,223<br />
2<br />
9<br />
1<br />
160<br />
6<br />
60<br />
4,028<br />
14<br />
101<br />
25<br />
1<br />
116<br />
2<br />
21<br />
4<br />
38<br />
46
OCCUPATIONS. 257<br />
NUMBER OP INDIANS 10 YEARS OP AGE AND OVER ENGAGED IN GAINFUL OCCUPATIONS, CLASSIFIED BY<br />
SEX: <strong>1910</strong>—Cont<strong>in</strong>ued.<br />
Table 105—Con. OCCUPATION. Total. Male. Female OCCUPATION'. Total. Male. Temale.<br />
Fublio service (not elsewhere classified)—Con.<br />
Marshals, sherifls, detectives, etc<br />
Officials <strong>and</strong> <strong>in</strong>spectors (city <strong>and</strong> county)<br />
Officials <strong>and</strong> <strong>in</strong>spectors (state <strong>and</strong> <strong>United</strong> <strong>States</strong>) .<br />
Policemen ,<br />
Soldiers, sailors, <strong>and</strong> mar<strong>in</strong>es<br />
Ottier occupations<br />
Frotessiohal service<br />
Abstractors, notaries, <strong>and</strong> justices of peace . .<br />
.<br />
. .<br />
Actors<br />
Artists <strong>and</strong> teachers of art<br />
Attendants <strong>and</strong> helpers (professional service).<br />
Authors, editors, <strong>and</strong> reporters<br />
Chemists, assayers, <strong>and</strong> metalluiglsts<br />
ClvU <strong>and</strong> m<strong>in</strong><strong>in</strong>g eng<strong>in</strong>eers <strong>and</strong> surveyors<br />
Clergymen<br />
.<br />
College presidents <strong>and</strong> professors<br />
•<br />
Dentists<br />
Fortune tellers, hypnotists, spiritualists, etc.<br />
Healers (except physicians <strong>and</strong> surgeons)<br />
Keepers of charitable <strong>and</strong> penal <strong>in</strong>stitutions.<br />
Lawyers<br />
Musicians <strong>and</strong> teachers of music<br />
Officials of lodges, societies, etc<br />
Photographers<br />
Physicians <strong>and</strong> surgeons<br />
Religious <strong>and</strong> charity workers<br />
. Showmen<br />
Teachers (school)<br />
Theatrical owners, managers, <strong>and</strong> officials<br />
Tra<strong>in</strong>ed nurses 1<br />
Veter<strong>in</strong>ary surgeons<br />
O<strong>the</strong>r occupations<br />
—<br />
.<br />
40<br />
44<br />
46<br />
379<br />
80<br />
10<br />
1,260<br />
10<br />
34<br />
17<br />
13<br />
5<br />
1<br />
25<br />
130<br />
3<br />
3<br />
10<br />
65<br />
7<br />
87<br />
73<br />
8<br />
5<br />
98<br />
35<br />
138<br />
355<br />
5<br />
20<br />
TTNITBD STATES—Cont<strong>in</strong>ued.<br />
40<br />
41<br />
33<br />
379<br />
80<br />
903<br />
10<br />
121<br />
110<br />
4<br />
4<br />
3<br />
105<br />
13<br />
368
258 INDIANS IN THE UNITED STATES.<br />
Of <strong>the</strong> 13,702 <strong>Indian</strong>s 10 years of age <strong>and</strong> over <strong>in</strong><br />
<strong>the</strong> <strong>United</strong> <strong>States</strong> <strong>in</strong> <strong>1910</strong> who were enumerated on<br />
<strong>the</strong> general <strong>population</strong> schedule, <strong>and</strong> <strong>the</strong>refore without<br />
tribal designation, <strong>the</strong>re were 5,229 males <strong>and</strong> 1,853<br />
females who were ga<strong>in</strong>fully occupied. Table 1 06 shows<br />
<strong>the</strong> occupations <strong>in</strong> which such <strong>Indian</strong>s were engaged.<br />
OCCUPATIONS OP INDIAN MALES AND FEMALES IN THE UNITED STATES 10 YEARS OP AGE AND OVER<br />
ENUMERATED ON THE GENERAL POPULATION SCHEDULE, OF UNKNOWN STOCK OR TRIBE: <strong>1910</strong>.<br />
Table 106<br />
SEX AJJD OCCUPATION.<br />
Males<br />
Agriculture, forestry, <strong>and</strong> animal husb<strong>and</strong>ry<br />
Dairy lann laborers<br />
Farm, dairy farm, <strong>and</strong> orchard foremen<br />
Farm laborers<br />
Farmers<br />
Fishermen <strong>and</strong> oystermen<br />
Garden, orchard, <strong>and</strong> nursery laborers<br />
Gardeners, floriste, fruit growers, <strong>and</strong> nurserymen<br />
Lumbermen, raftsmen, <strong>and</strong> woodchoppers<br />
Stock herders, drovers, <strong>and</strong> feeders<br />
Stock raisers<br />
o<strong>the</strong>r agricultural pursuits<br />
Extraction of m<strong>in</strong>erals<br />
Coal m<strong>in</strong>e operatives<br />
Gold <strong>and</strong> silver m<strong>in</strong>e operatives<br />
All o<strong>the</strong>r m<strong>in</strong>e operatives<br />
Quarry operatives<br />
O<strong>the</strong>r occupations<br />
Manufactur<strong>in</strong>g <strong>and</strong> mechanical <strong>in</strong>dustries.<br />
Blacksmiths<br />
Brick <strong>and</strong> stone masons<br />
Carpenters<br />
Compositors, l<strong>in</strong>otypers, <strong>and</strong> typesetters<br />
Engmeers (stationary)<br />
Firemen (except locomotive <strong>and</strong> fire department)<br />
Laborers (n. o. s. i):<br />
Build<strong>in</strong>g <strong>and</strong> h<strong>and</strong> trades<br />
Iron <strong>and</strong> steel <strong>in</strong>dustries<br />
Saw <strong>and</strong> plan<strong>in</strong>g mills<br />
O<strong>the</strong>r <strong>in</strong>dustries<br />
Mach<strong>in</strong>ists, millwrights, <strong>and</strong> toolmakers<br />
Pa<strong>in</strong>ters, glaziers, <strong>and</strong> varnishers<br />
Sawyers<br />
Semiskilled operatives (n. o. s.i):<br />
Basket makers<br />
Iron <strong>and</strong> steel <strong>in</strong>dustries<br />
Saw <strong>and</strong> plan<strong>in</strong>g mills<br />
Shoe factories<br />
O<strong>the</strong>r <strong>in</strong>dustries<br />
Shoemakers <strong>and</strong> cobblers (not <strong>in</strong> factory)<br />
Tailors<br />
O<strong>the</strong>r occupations<br />
Transportation<br />
Chaufleurs<br />
Braymen, teamsters, <strong>and</strong> expressmen<br />
Hostlers <strong>and</strong> stable h<strong>and</strong>s<br />
Laborers (n. o. s.i):<br />
Road <strong>and</strong> street build<strong>in</strong>g <strong>and</strong> repair<strong>in</strong>g. .<br />
Steam railroad<br />
O<strong>the</strong>r transportation<br />
Mail carriers<br />
Sailors <strong>and</strong> deck h<strong>and</strong>s<br />
O<strong>the</strong>r occupations<br />
.<br />
Number:<br />
<strong>1910</strong>.<br />
5,229<br />
2,755<br />
IS<br />
10<br />
1,545<br />
640<br />
42<br />
22<br />
16<br />
249<br />
146<br />
46<br />
21<br />
94<br />
1,016<br />
32<br />
25<br />
83<br />
21<br />
35<br />
19<br />
342<br />
11<br />
98<br />
65<br />
13<br />
25<br />
14<br />
11<br />
16<br />
17<br />
10<br />
40<br />
12<br />
25<br />
102<br />
470<br />
12<br />
105<br />
16<br />
34<br />
198<br />
16<br />
U<br />
14<br />
64<br />
SEX AND OCCUPATION.<br />
Males—Cont<strong>in</strong>ued.<br />
Trade<br />
Bankers, brokers, <strong>and</strong> money lenders<br />
Clerks <strong>in</strong> stores<br />
Deliverymen<br />
Laborers <strong>in</strong> coal <strong>and</strong> lumber yards <strong>and</strong> warehouses<br />
Laborers, porters, <strong>and</strong> helpers <strong>in</strong> stores<br />
Real estate agents <strong>and</strong> officials ,<br />
Retail dealers<br />
Salesmen<br />
O<strong>the</strong>r pursuits<br />
Public service (not elsewhere classified)<br />
Guards, watchmen, <strong>and</strong> doorkeepers<br />
Laborers (public service)<br />
Marshals, sheriffs, detectives, etc<br />
Officials <strong>and</strong> Inspectors (state <strong>and</strong> <strong>United</strong><br />
<strong>States</strong>)<br />
Soldiers, sailors, <strong>and</strong> mar<strong>in</strong>es<br />
O<strong>the</strong>r occupations<br />
Professional service<br />
Actors<br />
Artists <strong>and</strong> teachers of art<br />
Civil <strong>and</strong> m<strong>in</strong><strong>in</strong>g eng<strong>in</strong>eers <strong>and</strong> surveyors<br />
Clergymen<br />
Lawyers<br />
Musicians <strong>and</strong> teachers of music<br />
Physicians <strong>and</strong> surgeons<br />
Showmen<br />
Teachers (school)<br />
O<strong>the</strong>r occupations<br />
Domestic <strong>and</strong> personal service<br />
Barbers <strong>and</strong> hairdressers ,<br />
Bathhouse keepers <strong>and</strong> attendants<br />
Hunters, trappers, <strong>and</strong> guides<br />
Janitors ,<br />
Laborers ( domestic <strong>and</strong> professional service) . .<br />
Porters (except <strong>in</strong> stores)<br />
Restaurant, caf6, <strong>and</strong> lunch-room keepers<br />
Servants<br />
Waiters<br />
O<strong>the</strong>r occupations<br />
Clerical occupations<br />
Agents, canvassers^ <strong>and</strong> collectors<br />
Bookkeepers, cashiers, <strong>and</strong> accountant*<br />
Clerks (except clerks <strong>in</strong> stores)<br />
Messenger, bundle, <strong>and</strong> office boys<br />
Stenographers <strong>and</strong> typewriters<br />
Females<br />
Agriculture, forestry, <strong>and</strong> animal husb<strong>and</strong>ry<br />
Farm laborers<br />
Farmers<br />
O<strong>the</strong>r agricultural pursuits<br />
Selected occupati
Table 107<br />
AQE PEBIOD.<br />
UNITED STATES.<br />
10 years of age <strong>and</strong> over.<br />
10 to 14 years<br />
15 to 1 9 years<br />
20 to 24 years<br />
25 to 44 years<br />
45 years <strong>and</strong> over<br />
AgevmJoiowii<br />
.<br />
INDIAN HALES lOTEABS<br />
OF AGE AND OVEB;<br />
<strong>1910</strong>.<br />
Total<br />
number.<br />
96,582<br />
16, 199<br />
14, 612<br />
11, 265<br />
30, 840<br />
23,185<br />
481<br />
Engaged <strong>in</strong><br />
ga<strong>in</strong>ful<br />
occupations.<br />
Number.<br />
59,206<br />
2,076<br />
6,149<br />
8,327<br />
26,236<br />
16,234<br />
184<br />
Per<br />
cent.<br />
61.3<br />
12.8<br />
42.1<br />
73.9<br />
85.1<br />
70.0<br />
38.3<br />
OCCUPATIONS. 259<br />
<strong>in</strong>dian females 10<br />
teaks of age <strong>and</strong><br />
Ovek: <strong>1910</strong>.<br />
Total<br />
number.<br />
92,176<br />
15, 194<br />
13, 874<br />
10, 579<br />
29,335<br />
22, 726<br />
468<br />
Engaged ra<br />
ga<strong>in</strong>ful<br />
occupations.<br />
Number.<br />
14, 710<br />
2,208<br />
2,141<br />
5,752<br />
3,685<br />
64<br />
Per<br />
cent.<br />
16.0<br />
5.7<br />
15.9<br />
20.2<br />
19.6<br />
16.2<br />
13.7<br />
AGE PERIOD.<br />
ALASKA.<br />
10 years of age <strong>and</strong> over.<br />
10 to 14 years<br />
15 to 19 years<br />
20 to 24 years<br />
25 to 44 years<br />
45 years <strong>and</strong> over<br />
Age unkno^vn<br />
njDUN MALES 10 YEAE3<br />
OP AGE AND over:<br />
<strong>1910</strong>.<br />
Total<br />
number.<br />
9,300<br />
1,206<br />
1,285<br />
1,138<br />
3,833<br />
1,960<br />
78<br />
Engaged <strong>in</strong><br />
ga<strong>in</strong>ful<br />
occupations.<br />
Number.<br />
7,367<br />
123<br />
794<br />
1,037<br />
3,611<br />
1,742<br />
60<br />
Per<br />
cent.<br />
79.2<br />
10.2<br />
61.8<br />
91.1<br />
99.4<br />
88.9<br />
76.9<br />
<strong>in</strong>dian females 10<br />
yeaes of age <strong>and</strong><br />
ovek: <strong>1910</strong>.<br />
Total<br />
number.<br />
8,7*4<br />
1,044<br />
1,212<br />
1,187<br />
3,427<br />
1,788<br />
Engaged <strong>in</strong><br />
ga<strong>in</strong>ful<br />
occupations.<br />
NUMBER OF INDIAN MALES AND FEMALES ENGAGED IN SPECIFIED OCCUPATIONS, CLASSIFIED BY AGE<br />
PERIODS: <strong>1910</strong>.<br />
Table 108<br />
Number.<br />
757<br />
25<br />
101<br />
75<br />
298<br />
223<br />
35<br />
Per<br />
cent.<br />
2.4<br />
8.3<br />
6.3<br />
8.7<br />
12.5<br />
40.7
260 INDIANS IN THE UNITED STATES.<br />
NUMBER OF INDIAN MALES AND FEMALES ENGAGED IN SPECIFIED OCCUPATIONS, CLASSIFIED BY AGE PERIODS:<br />
<strong>1910</strong>—Cont<strong>in</strong>ued.<br />
Table 108—Ck)nt<strong>in</strong>ued.
OCCUPATIONS. 261<br />
NUMBER OF INDIAN MALES AND FEMALES ENGAGED IN SPECIFIED OCCUPATIONS, CLASSIFIED BY AGE PERIODS:<br />
<strong>1910</strong>—Cont<strong>in</strong>ued.<br />
Table 108—Cont<strong>in</strong>ued.
262 INDIANS IN THE UNITED STATES.<br />
NUMBER OF INDIAN MALES AND FEMALES IN EACH PRINCIPAL TRIBE AND PRINCIPAL STATE ENGAGED IN<br />
SELECTED OCCUPATIONS, CLASSIFIED BY AGE PERIODS: <strong>1910</strong>.<br />
Table 109<br />
[This table shows each tribe hay<strong>in</strong>g 100 or more <strong>Indian</strong>s <strong>in</strong> <strong>1910</strong>.]
OCCUPATIONS. 263<br />
NUMBER OF INDIAN MALES AND FEMALES IN EACH PRINCIPAL TRIBE AND PRINCIPAL STATE ENGAGED IN<br />
SELECTED OCCUPATIONS, CLASSIFIED BY AGE PERIODS: <strong>1910</strong>—Cont<strong>in</strong>ued.<br />
Table 109—Cont<strong>in</strong>ued.<br />
[This table shows each tribe hav<strong>in</strong>g 100 or more <strong>Indian</strong>s <strong>in</strong> <strong>1910</strong>.]
264 INDIANS IN THE UNITED STATES.<br />
NUMBER OF INDIAN MALES AND FEMALES IN EACH PRINCIPAL TRIBE AND PRINCIPAL STATE ENGAGED IN<br />
SELECTED OCCUPATIONS, CLASSIFIED BY AGE PERIODS: <strong>1910</strong>—Cont<strong>in</strong>ued.<br />
Table 109—Cont<strong>in</strong>ued.<br />
[This table shows each tribe hav<strong>in</strong>g 100 or more <strong>Indian</strong>s <strong>in</strong> <strong>1910</strong>.]
OCCUPATIONS. 265<br />
NUMBER OP INDIAN MALES AND FEMALES IN EACH PRINCIPAL TRIBE AND PRINCIPAL STATE ENGAGED IN<br />
SELECTED OCCUPATIONS, CLASSIFIED BY AGE PERIODS: <strong>1910</strong>—Cont<strong>in</strong>ued.<br />
Table 109—Cont<strong>in</strong>ued.<br />
[This ^able shows each tribe hav<strong>in</strong>g 100 or more <strong>Indian</strong>s <strong>in</strong> <strong>1910</strong>.]
266 INDIANS IN THE UNITED STATES.<br />
NUMBER OF INDIAN MALES AND FEMALES IN EACH PRINCIPAL TRIBE AND PRINCIPAL STATE ENGAGED IN<br />
SELECTED OCCUPATIONS, CLASSIFIED BY AGE PERIODS: <strong>1910</strong>—Cont<strong>in</strong>ued.<br />
Table 109—Cont<strong>in</strong>ued.<br />
[This table shows each tribe hav<strong>in</strong>g 100 or more <strong>Indian</strong>s i;i <strong>1910</strong>.]
OCCUPATIONS. 267<br />
NUMBER OP INDIAN MALES AND FEMALES IN EACH PRINCIPAL TRIBE AND PRINCIPAL STATE ENGAGED IN<br />
SELECTED OCCUPATIONS, CLASSIFIED BY AGE PERIODS: <strong>1910</strong>—Contimied.<br />
Vable 109—Cont<strong>in</strong>ued.<br />
[This table shows each tribe hav<strong>in</strong>g 100 or more <strong>Indian</strong>s <strong>in</strong> <strong>1910</strong>.]
268 INDIANS IN THE UNITED STATES.<br />
NUMBER OF INDIAN MALES AND FEMALES IN EACH PRINCIPAL TRIBE AND PRINCIPAL STATE ENGAGED IN<br />
SELECTED OCCUPATIONS, CLASSIFIED BY AGE PERIODS: 19ia-Cont<strong>in</strong>ued.<br />
Table 109—Cont<strong>in</strong>ued.<br />
[This table shows each tribe hav<strong>in</strong>g 100 or more <strong>Indian</strong>s <strong>in</strong> <strong>1910</strong>.]
OCCUPATIONS. 269<br />
NUMBER OF INDIAN MALES AND FEMALES IN EACH PRINCIPAL TRIBE AND PRINCIPAL STATE ENGAGED IN<br />
SELECTED OCCUPATIONS, CLASSIFIED BY AGE PERIODS: IGIO-Cont<strong>in</strong>ued.<br />
Table 109—CJont<strong>in</strong>ued.<br />
[This table shows each tribe hav<strong>in</strong>g 100 or more <strong>Indian</strong>s <strong>in</strong> <strong>1910</strong>.]
270 INDIANS IN THE UNITED STATES.<br />
NUMBER OP INDIAN MALES AND FEMALES IN EACH PRINCIPAL TRIBE AND PRINCIPAL STATE ENGAGED IN<br />
SELECTED OCCUPATIONS, CLASSIFIED BY AGE PERIODS: <strong>1910</strong>—Cont<strong>in</strong>ued.<br />
Table 109—Ck)nttoued.<br />
[This table shows each tribe hav<strong>in</strong>g 100 or more <strong>Indian</strong>s <strong>in</strong> <strong>1910</strong>.]
OCCUPATIONS. 271<br />
NUMBER OF INDIAN MALES AND FEMALES IN EACH PRINCIPAL TRIBE AND PRINCIPAL STATE ENGAGED IN<br />
SELECTED OCCUPATIONS, CLASSIFIED BY AGE PERIODS: <strong>1910</strong>—Cont<strong>in</strong>ued.<br />
Table lOD—Cont<strong>in</strong>ued.<br />
[This table shows each tribe hav<strong>in</strong>g 100 oi more <strong>Indian</strong>s <strong>in</strong> <strong>1910</strong>.]
272 INDIANS IN THE UNITED STATES.<br />
NUMBER OF INDIAN MALES AND FEMALES IN EACH PRINCIPAL TRIBE AND PRINCIPAL STATE ENGAGED IN<br />
SELECTED OCCUPATIONS, CLASSIFIED BY AGE PERIODS: <strong>1910</strong>—Cont<strong>in</strong>ued.<br />
Table 109—Cont<strong>in</strong>ued.<br />
[This table shows each tribe hav<strong>in</strong>g 100 or more <strong>Indian</strong>s <strong>in</strong> <strong>1910</strong>.]
OCCUPATIONS.<br />
NUMBER OF INDIAN MALES AND FEMALES IN EACH PRINCIPAL TRIBE AND PRINCIPAL STATE ENGAGED IN<br />
SELECTED OCCUPATIONS, CLASSIFIED BY AGE PERIODS: 191(>-Contmue(i.<br />
Table 109—Gont<strong>in</strong>ned.<br />
[This table shows each tribe hav<strong>in</strong>g 100 or more <strong>Indian</strong>s <strong>in</strong> <strong>1910</strong>.]<br />
273
274 INDIANS IN THE UNITED STATES.<br />
NUMBER OF INDIAN MALES AND FEMALES IN EACH PRINCIPAL TRIBE AND PRINCIPAL STATE ENGAGED IN<br />
SELECTED OCCUPATIONS, CLASSIFIED BY AGE PERIODS: <strong>1910</strong>—Cont<strong>in</strong>ued.<br />
Tabic 109—Cont<strong>in</strong>ued.<br />
(This table shows each tribe hav<strong>in</strong>g 100 or more <strong>Indian</strong>s <strong>in</strong> <strong>1910</strong>.]
OCCUPATIONS. 275<br />
NUMBER OF INDIAN MALES AND FEMALES IN EACH PRINCIPAL TRIBE AND PRINCIPAL STATE ENGAGED IN<br />
SELECTED OCCUPATIONS, CLASSIFIED BY AGE PERIODS: <strong>1910</strong>—Cont<strong>in</strong>ued.<br />
Table 109—Cont<strong>in</strong>ued.<br />
[This table shows each tribe hav<strong>in</strong>g 100 or more <strong>Indian</strong>s <strong>in</strong> <strong>1910</strong>.]
276 INDIANS IN THE UNITED STATES.<br />
NUMBER OF INDIAN MALES AND FEMALES IN EACH PRINCIPAL TRIBE AND PRINCIPAL STATE ENGAGED IN<br />
SELECTED OCCUPATIONS, CLASSIFIED BY AGE PERIODS: <strong>1910</strong>—Cont<strong>in</strong>ued.<br />
Table 109—Cont<strong>in</strong>ued.<br />
[This table shows each tribe hav<strong>in</strong>g 100 or more <strong>Indian</strong>s <strong>in</strong> <strong>1910</strong>.]
OCCUPATIONS. 277<br />
NUMBER OP INDIAN MALES AND FEMALES IN EACH PRINCIPAL TRIBE AND PRINCIPAL STATE ENGAGED IN<br />
SELECTED OCCUPATIONS, CLASSIFIED BY AGE PERIODS: <strong>1910</strong>—Cont<strong>in</strong>ued.<br />
Table 109—Cont<strong>in</strong>ued.<br />
[This table shows each tribe hav<strong>in</strong>g 100 or more <strong>Indian</strong>s <strong>in</strong> <strong>1910</strong>.]
278 INDIANS IN THE UNITED STATES.<br />
NUMBER OF INDIAN MALES AND FEMALES IN EACH PRINCIPAL TRIBE AND PRINCIPAL STATE ENGAGED IN<br />
SELECTED OCCUPATIONS, CLASSIFIED BY AGE PERIODS: <strong>1910</strong>—Cont<strong>in</strong>ued.<br />
Table 109—Cont<strong>in</strong>ued.<br />
[This table shows each tribe hav<strong>in</strong>g 100 or more <strong>Indian</strong>s <strong>in</strong> <strong>1910</strong>.]
OCCUPATIONS.<br />
NUMBEB OP INDLA.N MALES AND FEMALES IN EACH PRINCIPAL TRIBE AND PRINCIPAL STATE ENGAGED IN<br />
SELECTED OCCUPATIONS, CLASSIFIED BY AGE PERIODS: <strong>1910</strong>—Oontiiiued.<br />
Table 109—Cont<strong>in</strong>ued.<br />
[TUs table shows each tribe hav<strong>in</strong>g 100 or more <strong>Indian</strong>s In <strong>1910</strong>.]<br />
279
280 INDIANS IN THE UNITED STATES.<br />
NUMBER OF INDIAN MALES AND FEMALES IN EACH PRINCIPAL TRIBE AND PRINCIPAL STATE ENGAGED IN<br />
SELECTED OCCUPATIONS, CLASSIFIED BY AGE PERIODS: <strong>1910</strong>—Cont<strong>in</strong>ued.<br />
Table 109—Cont<strong>in</strong>ued.<br />
[Tills table sbows each tribe bavlng 100 or more <strong>Indian</strong>s <strong>in</strong> <strong>1910</strong>.]
OCCUPATIONS. 281<br />
NUMBER OF INDIAN MALES AND FEMALES IN EACH PRINCIPAL TRIBE AND PRINCIPAL STATE ENGAGED IN<br />
SELECTED OCCUPATIONS, CLASSIFIED BY AGE PERIODS: <strong>1910</strong>—Contmued.<br />
Table 109—Cont<strong>in</strong>ued.<br />
[This table shows each tribe hav<strong>in</strong>g 100 or more <strong>Indian</strong>s <strong>in</strong> <strong>1910</strong>.]
282 INDIANS IN THE UNITED STATES.<br />
NUMBER OF INDIAN MALES AND FEMALES IN EACH PRINCIPAL TRIBE AND PRINCIPAL STATE ENGAGED IN<br />
SELECTED OCCUPATIONS, CLASSIFIED BY AGE PERIODS: <strong>1910</strong>—Cont<strong>in</strong>ued.<br />
Table 109—Cont<strong>in</strong>ued.<br />
[This table shows each tribe hav<strong>in</strong>g 100 or more <strong>Indian</strong>s <strong>in</strong> <strong>1910</strong>.]
The apportionment of congressional representation<br />
under <strong>the</strong> Constitution is made proportional to <strong>the</strong><br />
<strong>population</strong> of each state, "exclud<strong>in</strong>g <strong>Indian</strong>s not<br />
taxed." The status of <strong>the</strong> <strong>Indian</strong> <strong>in</strong> regard to tax-<br />
ation is <strong>the</strong>refore a matter of importance to Congress.<br />
One of <strong>the</strong> <strong>in</strong>quiries for which an answer was required<br />
concern<strong>in</strong>g each <strong>Indian</strong> enumerated on <strong>the</strong> special<br />
<strong>Indian</strong> schedule <strong>in</strong> <strong>1910</strong> was: Is this <strong>Indian</strong> taxed?<br />
It proved <strong>in</strong>advisable, however, <strong>in</strong> determ<strong>in</strong><strong>in</strong>g <strong>the</strong><br />
number of <strong>Indian</strong>s not taxed, to depend entirely upon<br />
<strong>the</strong> answers made on <strong>the</strong> special <strong>Indian</strong> schedule,<br />
because of <strong>the</strong> fact that many of <strong>the</strong> <strong>Indian</strong>s were<br />
<strong>in</strong>competent or possibly unwiU<strong>in</strong>g to give <strong>the</strong>ir own<br />
status, while <strong>the</strong> enumerators were unable to correct<br />
or supplement <strong>the</strong> <strong>in</strong>formation thus secured. The<br />
problem was not an easy one to settle, as it <strong>in</strong>volved<br />
not only questions of fact but also questions of law.<br />
For <strong>the</strong>se reasons special arrangements were made <strong>in</strong><br />
<strong>the</strong> bureau for <strong>the</strong> consideration of <strong>the</strong> problem <strong>in</strong> all<br />
its phases, utUiz<strong>in</strong>g all <strong>the</strong> data which might throw<br />
INDIANS TAXED AND NOT TAXED.<br />
light on <strong>the</strong> subject. In this work <strong>the</strong> Bureau of <strong>the</strong><br />
Census was also aided by <strong>the</strong> Office of <strong>Indian</strong> Affairs.<br />
The number of <strong>Indian</strong>s taxed <strong>and</strong> not taxed <strong>in</strong> <strong>the</strong><br />
<strong>United</strong> <strong>States</strong> <strong>in</strong> <strong>1910</strong>, as compared with 1900 <strong>and</strong> 1890,<br />
is shown, by states, <strong>in</strong> Table 110 on page 284. The<br />
proportion of <strong>Indian</strong>s taxed <strong>in</strong> <strong>1910</strong> <strong>and</strong> <strong>in</strong> 1890 is<br />
shown graphically <strong>in</strong> <strong>the</strong> maps on page 285.<br />
In <strong>1910</strong>, as shown by Table 110, <strong>the</strong> taxed <strong>Indian</strong>s<br />
numbered 193,811, <strong>and</strong> constituted nearly three-<br />
fourths ( 72.9 per cent) of <strong>the</strong> total <strong>Indian</strong> <strong>population</strong>,<br />
as compared with 58,806 <strong>in</strong> 1890, or less than onefourth<br />
(23.7 per cent) of all <strong>the</strong> <strong>Indian</strong>s enumerated<br />
at that census. Prior to 1890 no systematic attempt<br />
was made to enumerate aU <strong>Indian</strong>s, but <strong>in</strong> 1880 <strong>the</strong>re<br />
were 66,407 "civilized" <strong>Indian</strong>s reported; <strong>in</strong> 1870,<br />
25,731; <strong>and</strong> <strong>in</strong> 1860, 44,021. In a general way <strong>the</strong><br />
"civihzed" <strong>Indian</strong>s of <strong>the</strong> earher decades, mean<strong>in</strong>g<br />
those off reservations <strong>and</strong> found scattered among <strong>the</strong><br />
general <strong>population</strong>, may be considered synonymous<br />
with "taxed" <strong>Indian</strong>s of to-day.<br />
There were 33 states, besides <strong>the</strong> District of Colum-<br />
bia, <strong>in</strong> <strong>1910</strong>, <strong>in</strong> which aU <strong>the</strong> <strong>Indian</strong>s were taxed, as<br />
compared with 26 states <strong>in</strong> 1890. There were 4 states<br />
<strong>in</strong> <strong>1910</strong>, as aga<strong>in</strong>st 1 <strong>in</strong> 1890, <strong>in</strong> which between 75 <strong>and</strong><br />
100 per cent of aU <strong>the</strong> <strong>Indian</strong>s were taxed; 5 <strong>in</strong> <strong>1910</strong>,<br />
as aga<strong>in</strong>st 4 <strong>in</strong> 1890, <strong>in</strong> which <strong>the</strong>y constituted between<br />
50 <strong>and</strong> 75 per cent; <strong>and</strong> 2 <strong>in</strong> <strong>1910</strong>, as aga<strong>in</strong>st 5<br />
<strong>in</strong> 1890, <strong>in</strong> which <strong>the</strong>y constituted between 25 <strong>and</strong> 50<br />
per cent. In 1890 <strong>the</strong>re were 12 states <strong>in</strong> which <strong>the</strong><br />
taxed <strong>Indian</strong>s constituted less than 25 per cent of all<br />
<strong>Indian</strong>s, but <strong>in</strong> <strong>1910</strong> thwe were only 4 states with so<br />
low a percentage.<br />
The <strong>in</strong>crease <strong>in</strong> <strong>the</strong> number of <strong>Indian</strong>s taxed began<br />
after <strong>the</strong> passage of <strong>the</strong> Dawes Act <strong>in</strong> 1887. The num-<br />
ber of taxed <strong>Indian</strong>s rose from 58,806 <strong>in</strong> 1890 to 107,-<br />
678 <strong>in</strong> 1900 <strong>and</strong> <strong>the</strong>n to 193,811 <strong>in</strong> <strong>1910</strong>, leav<strong>in</strong>g, <strong>in</strong><br />
<strong>1910</strong>, only 71,872 who were still not taxed as compared<br />
with more than twice that number <strong>in</strong> 1890<br />
(189,447). In <strong>1910</strong> all <strong>the</strong> <strong>Indian</strong>s east of <strong>the</strong> Mis-<br />
sissippi, except those <strong>in</strong> New York <strong>and</strong> Wiscons<strong>in</strong>,<br />
were taxed; CaUfomia had 94 per cent taxed,<br />
Wiscons<strong>in</strong> 90.1 per cent, M<strong>in</strong>nesota 85.3 per cent,<br />
<strong>and</strong> WashiQgton 83.1 per cent; Colorado, Nevada,<br />
North Dakota, South Dakota, <strong>and</strong> Utah had over<br />
50 per cent taxed, <strong>and</strong> Idaho <strong>and</strong> New Mexico<br />
over 35 per cent. The low percentages occurred <strong>in</strong><br />
New York, 22.6; Arizona, 17.4; Wyom<strong>in</strong>g, 12; <strong>and</strong><br />
Montana, 9.6.<br />
(283)
284 INDIANS IN THE UNITED STATES.<br />
INDIAN POPULATION, CLASSIFIED AS TAXED AND NOT TAXED, BY DIVISIONS AND STATES: <strong>1910</strong>, 1900, AND 1890.<br />
Table 1 10<br />
[Per cent not shown where base is less than 60.]
INDIANS TAXED AND NOT TAXED. 285<br />
PROPORTION OP INDIANS TAXED: <strong>1910</strong>.<br />
PROPORTION OF INDIANS TAXED: 1890.<br />
o