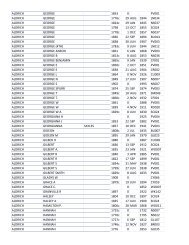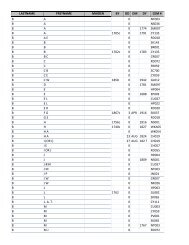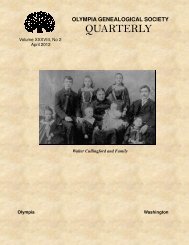
Indian population in the United States and Alaska. 1910 - RootsWeb
Indian population in the United States and Alaska. 1910 - RootsWeb
Indian population in the United States and Alaska. 1910 - RootsWeb

Create successful ePaper yourself
Turn your PDF publications into a flip-book with our unique Google optimized e-Paper software.
4 CONTENTS.<br />
Page.<br />
Illtteract 212-231<br />
Illiteracy, <strong>1910</strong> <strong>and</strong> 1900 ...'.". 212<br />
Table 84.—Illiterates among <strong>Indian</strong>s 10 years of age <strong>and</strong> over compared with o<strong>the</strong>r classes of <strong>the</strong> <strong>population</strong>, for <strong>the</strong> <strong>United</strong><br />
<strong>States</strong> <strong>and</strong> <strong>Alaska</strong>: <strong>1910</strong> <strong>and</strong> 1900<br />
Illiteracy, by sex 21<br />
Table 85.—Illiterates among <strong>Indian</strong> males <strong>and</strong> females 10 years of age <strong>and</strong> over, compared with o<strong>the</strong>r classes of <strong>the</strong> popula-<br />
tion, for <strong>the</strong> <strong>United</strong> <strong>States</strong> <strong>and</strong> <strong>Alaska</strong>: <strong>1910</strong> <strong>and</strong> 1900<br />
Table 86.—Illiterates among <strong>Indian</strong>s 10 years of age <strong>and</strong> over, by sex <strong>and</strong> age, for <strong>the</strong> <strong>United</strong> <strong>States</strong> <strong>and</strong> <strong>Alaska</strong>: <strong>1910</strong> <strong>and</strong><br />
1900<br />
lUiteracy, by states 213<br />
Table 87.—Illiterates among <strong>Indian</strong>s 10 years of age <strong>and</strong> over, 10 to 19 years of age, <strong>and</strong> 20 years of age <strong>and</strong> over, respec-<br />
tively, <strong>in</strong> 22 selected states: <strong>1910</strong> <strong>and</strong> 1900 214<br />
Table 88.—Illiterates among <strong>Indian</strong> males <strong>and</strong> females 10 years of age <strong>and</strong> over, 10 to 19 years of age, <strong>and</strong> 20 years of age <strong>and</strong><br />
over, respectively, <strong>in</strong> 22 selected states: <strong>1910</strong> 214<br />
Table 89.—Illiterate <strong>Indian</strong> males <strong>and</strong> females 10 years of age <strong>and</strong> over, classified by age periods, by divisions <strong>and</strong> states:<br />
<strong>1910</strong> 215<br />
Illiteracy, by stocks <strong>and</strong> tribes 216<br />
Table 90.—Illiterates among <strong>Indian</strong> males <strong>and</strong> females 10 years of age <strong>and</strong> over, 10 to 19 years of age, <strong>and</strong> 20 years of age <strong>and</strong><br />
over, respectively, by pr<strong>in</strong>cipal stocks: <strong>1910</strong> 216<br />
Table 91.— ^Illiterates among <strong>Indian</strong>s 10 years of age <strong>and</strong> over of unknown stock or tribe, by age periods: <strong>1910</strong> 217<br />
Table 92.—Illiterate <strong>Indian</strong> males <strong>and</strong> females 10 years of age <strong>and</strong> over, classified by age periods, by stocks, pr<strong>in</strong>cipal tribes,<br />
<strong>and</strong> pr<strong>in</strong>cipal states: <strong>1910</strong> 219<br />
Table 93.—Illiterates among <strong>Indian</strong>s 10 years of age <strong>and</strong> over, classified by sex, <strong>and</strong> among <strong>Indian</strong>a 10 to 19 years of age <strong>and</strong><br />
20 years of age <strong>and</strong> over, respectively, for each pr<strong>in</strong>cipal stock, by pr<strong>in</strong>cipal tribes <strong>and</strong> by pr<strong>in</strong>cipal states:<br />
<strong>1910</strong> 226<br />
Inabilitt to Speak Engush 232-249<br />
Inability to speak English, <strong>1910</strong> <strong>and</strong> 1900 232<br />
Table 94.—<strong>Indian</strong>s 10 years of age <strong>and</strong> over unable to speak English, by sex <strong>and</strong> age periods, for <strong>the</strong> <strong>United</strong> <strong>States</strong> <strong>and</strong><br />
<strong>Alaska</strong>: <strong>1910</strong> <strong>and</strong> 1900 232<br />
Inability to speak English, by states 232<br />
Table 95.—<strong>Indian</strong> males <strong>and</strong> females 10 years of age <strong>and</strong> over unable to speak English, for 22 selected states: <strong>1910</strong> <strong>and</strong> 1900. . 232<br />
Table 96.—<strong>Indian</strong> males <strong>and</strong> females 10 to 19 years of age <strong>and</strong> 20 years of age <strong>and</strong> over, respectively, unable to speak English,<br />
for 22 selected states: <strong>1910</strong> 233<br />
Inability to speak English, by stocks <strong>and</strong> tribes 233<br />
Table 97.—<strong>Indian</strong> males <strong>and</strong> females 10 years of age <strong>and</strong> over, 10 to 19 years of age, <strong>and</strong> 20 years of age <strong>and</strong> over, respec-<br />
tively, imable to speak English, by pr<strong>in</strong>cipal stocks: <strong>1910</strong> 234<br />
Table 98.—<strong>Indian</strong> males <strong>and</strong> females 10 years of age <strong>and</strong> over unable to speak English, classified by age periods, by divi-<br />
sions <strong>and</strong> states: <strong>1910</strong> <strong>and</strong> 1900 236<br />
Table 99.—<strong>Indian</strong> males <strong>and</strong> females 10 years of age <strong>and</strong> over unable to speak EngHsh, classified by age periods, by stocks,<br />
pr<strong>in</strong>cipal tribes, <strong>and</strong> pr<strong>in</strong>cipal states: <strong>1910</strong><br />
Table 100.—<strong>Indian</strong>s 10 years of age <strong>and</strong> over, classified by sex, <strong>and</strong> <strong>Indian</strong>s 10 to 19 years of age <strong>and</strong> 20 years of age <strong>and</strong><br />
237<br />
over, respectively, unable to speak English, for each pr<strong>in</strong>cipal stock, by pr<strong>in</strong>cipal tribes <strong>and</strong> by pr<strong>in</strong>cipal<br />
states: <strong>1910</strong> 244<br />
OoouPATioNs 250-282<br />
Sufficiency of <strong>the</strong> occupation returns 250<br />
Number <strong>and</strong> proportion occupied 250<br />
Table 101.—Number of <strong>Indian</strong>s engaged <strong>in</strong> ga<strong>in</strong>ful occupations compared with <strong>the</strong> total number of <strong>Indian</strong>s <strong>and</strong> with <strong>Indian</strong>s<br />
10 years of age <strong>and</strong> over, by sex, for <strong>the</strong> <strong>United</strong> <strong>States</strong> <strong>and</strong> <strong>Alaska</strong>: <strong>1910</strong> <strong>and</strong> 1900 250<br />
Table 102.— ^Number <strong>and</strong> proportion of <strong>Indian</strong>s of each sex 10 years of age <strong>and</strong> over engaged <strong>in</strong> ga<strong>in</strong>ful occupations, for 22<br />
selected states: <strong>1910</strong> 251<br />
Table 103.—^Number <strong>and</strong> proportion of <strong>Indian</strong>s of each sex 10 years of age <strong>and</strong> over engaged <strong>in</strong> ga<strong>in</strong>ful occupations, for<br />
pr<strong>in</strong>cipal stocks <strong>and</strong> tribes: <strong>1910</strong> 253<br />
Number <strong>and</strong> proportion <strong>in</strong> <strong>the</strong> general divisions of occupations 255<br />
Table 104.—^Distribution by general divisions of occupations of <strong>Indian</strong>s 10 years of age <strong>and</strong> over engaged <strong>in</strong> ga<strong>in</strong>ful occupa-<br />
tions, by sex: <strong>1910</strong> 255<br />
Occupations, by sex 255<br />
Table 105.—Number of <strong>Indian</strong>s 10 years of age <strong>and</strong> over engaged <strong>in</strong> ga<strong>in</strong>ful occupations, classified by sex: <strong>1910</strong> 256<br />
Table 106.—Occupations of <strong>Indian</strong> males <strong>and</strong> females <strong>in</strong> <strong>the</strong> <strong>United</strong> <strong>States</strong> 10 years of age <strong>and</strong> over enumerated on <strong>the</strong><br />
general <strong>population</strong> schedule, of unknown stock or tribe: <strong>1910</strong> 258<br />
Selected occupations, by sex <strong>and</strong> age periods<br />
258<br />
Table 107.—Number <strong>and</strong> proportion of <strong>Indian</strong>s of each sex engaged <strong>in</strong> ga<strong>in</strong>ful occupations, by age periods, for <strong>the</strong> <strong>United</strong><br />
<strong>States</strong> <strong>and</strong> <strong>Alaska</strong>: <strong>1910</strong> 259<br />
Table 108.—Number of <strong>Indian</strong> males <strong>and</strong> females engaged <strong>in</strong> specified occupations, classified by age periods: <strong>1910</strong> 259<br />
Table 109.—Number of <strong>Indian</strong> males <strong>and</strong> females <strong>in</strong> each pr<strong>in</strong>cipal tribe <strong>and</strong> pr<strong>in</strong>cipal state engaged <strong>in</strong> selected occupations<br />
classified by age periods: <strong>1910</strong> 262<br />
<strong>Indian</strong>s Taxed <strong>and</strong> Not Taxed 283-285<br />
Table 110.—<strong>Indian</strong> <strong>population</strong>, classified as taxed <strong>and</strong> not taxed, by divisions <strong>and</strong> states: <strong>1910</strong>, 1900, <strong>and</strong> 1890 284<br />
2<br />
212<br />
212<br />
213