Indian population in the United States and Alaska. 1910 - RootsWeb
Indian population in the United States and Alaska. 1910 - RootsWeb
Indian population in the United States and Alaska. 1910 - RootsWeb

You also want an ePaper? Increase the reach of your titles
YUMPU automatically turns print PDFs into web optimized ePapers that Google loves.
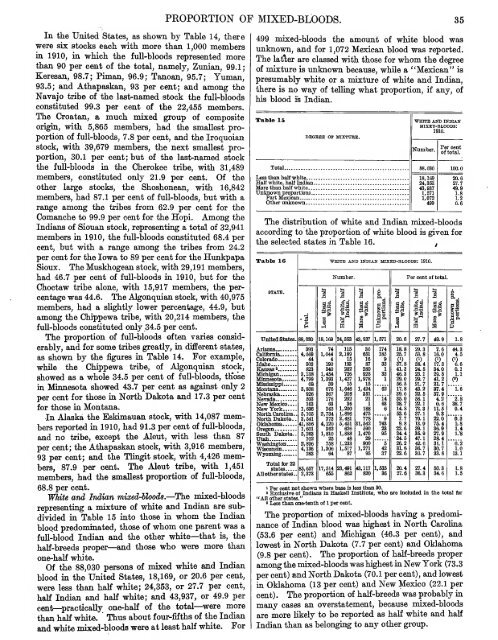
In <strong>the</strong> <strong>United</strong> <strong>States</strong>, as shown by Table 14, <strong>the</strong>re<br />
were six stocks each with more than 1,000 members<br />
<strong>in</strong> <strong>1910</strong>, <strong>in</strong> which <strong>the</strong> full-bloods represented more<br />
than 90 per cent of <strong>the</strong> total, namely, Zmiian, 99.1<br />
Keresan, 98.7; Piman, 96.9; Tanoan, 95.7; Yuman,<br />
93.5; <strong>and</strong> Athapaskan, 93 per cent; <strong>and</strong> among <strong>the</strong><br />
Navajo tribe of <strong>the</strong> last-named stock <strong>the</strong> full-bloods<br />
constituted 99.3 per cent of <strong>the</strong> 22,455 members.<br />
The Croatan, a much mixed group of composite<br />
orig<strong>in</strong>, with 5,865 members, had <strong>the</strong> smallest proportion<br />
of full-bloods, 7.8 per cent, <strong>and</strong> <strong>the</strong> Iroquoian<br />
stock, with 39,679 members, <strong>the</strong> next smallest pro-<br />
portion, 30.1 per cent; but of <strong>the</strong> last-named stock<br />
<strong>the</strong> full-bloods ia <strong>the</strong> Cherokee tribe, with 31,489<br />
members, constituted only 21.9 per cent. Of <strong>the</strong><br />
o<strong>the</strong>r large stocks, <strong>the</strong> Shoshonean, with 16,842<br />
members, had 87.1 per cent of full-bloods, but with a<br />
range among <strong>the</strong> tribes from 62.9 per cent for <strong>the</strong><br />
Comanche to 99.9 per cent for <strong>the</strong> Hopi. Among <strong>the</strong><br />
<strong>Indian</strong>s of Siouan stock, representiag a total of 32,941<br />
members <strong>in</strong> <strong>1910</strong>, <strong>the</strong> full-bloods constituted 68.4 per<br />
cent, but with a range among <strong>the</strong> tribes from 24.2<br />
per cent for <strong>the</strong> Iowa to 89 per cent for <strong>the</strong> Himkpapa<br />
Sioux. The Muskhogean stock, with 29,191 members,<br />
had 46.7 per cent of full-bloods <strong>in</strong> <strong>1910</strong>, but for <strong>the</strong><br />
Choctaw tribe alone, with 15,917 members, <strong>the</strong> percentage<br />
was 44.6. The Algonquian stock, with 40,975<br />
members, had a slightly lower percentage, 44.9, but<br />
among <strong>the</strong> Chippewa tribe, with 20,214 members, <strong>the</strong><br />
full-bloods constituted only 34.5 per cent.<br />
The proportion of full-bloods often varies consid-<br />
erably, <strong>and</strong> for some tribes greatly, <strong>in</strong> different states,<br />
as shown by <strong>the</strong> figures <strong>in</strong> Table 14. For example,<br />
while <strong>the</strong> Chippewa tribe, of Algonquian stock,<br />
showed as a whole 34.5 per cent of fuU-bloods, tKo'se<br />
<strong>in</strong> M<strong>in</strong>nesota showed 43.7 per cent as agaiust only 2<br />
per cent for those <strong>in</strong> North Dakota <strong>and</strong> 17.3 per cent<br />
for those <strong>in</strong> Montana.<br />
In <strong>Alaska</strong> <strong>the</strong> Eskimauan stock, with 14,087 mem-<br />
bers reported <strong>in</strong> <strong>1910</strong>, had 91.3 per cent of full-bloods,<br />
<strong>and</strong> no tribe, except <strong>the</strong> Aleut, with less than 87<br />
per cent; <strong>the</strong> Athapaskan stock, with 3,916 members,<br />
93 per cent; <strong>and</strong> <strong>the</strong> Tliagit stock, with 4,426 mem-<br />
bers, 87.9 per cent. The Aleut tribe, with 1,451<br />
members, had <strong>the</strong> smallest proportion of full-bloods,<br />
68.8 per cent.<br />
WkUe <strong>and</strong> <strong>Indian</strong> mixed-bloods.— ^The mixed-bloods<br />
represent<strong>in</strong>g a mixture of white <strong>and</strong> <strong>Indian</strong> are subdivided<br />
<strong>in</strong> Table 15 <strong>in</strong>to those <strong>in</strong> whom <strong>the</strong> <strong>Indian</strong><br />
blood predom<strong>in</strong>ated, those of whom one parent was a<br />
full-blood <strong>Indian</strong> <strong>and</strong> <strong>the</strong> o<strong>the</strong>r white—that is, <strong>the</strong><br />
half-breeds proper—<strong>and</strong> those who were more than<br />
one-half white.<br />
Of <strong>the</strong> 88,030 persons of mixed white <strong>and</strong> <strong>Indian</strong><br />
blood <strong>in</strong> <strong>the</strong> <strong>United</strong> <strong>States</strong>, 18,169, or 20.6 per cent,<br />
were less than half white; 24,353, or 27.7 per cent,<br />
half <strong>Indian</strong> <strong>and</strong> half white; <strong>and</strong> 43,937, or 49.9 per<br />
cent— ^practically one-half of <strong>the</strong> total— ^were more<br />
than half white. "<br />
Thus about four-fifths of <strong>the</strong> <strong>Indian</strong><br />
<strong>and</strong> white mixed-bloods wer« at least half white. For<br />
PROPORTION OF MIXED-BLOODS. 35<br />
499 mixed-bloods <strong>the</strong> a<strong>in</strong>oxmt of white blood was<br />
imknown, <strong>and</strong> for 1,072 Mexican blood was reported.<br />
The latler are classed with those for whom <strong>the</strong> degree<br />
of mixture is unknown because, while a "Mexican" is<br />
presumably white or a mixture of white <strong>and</strong> <strong>Indian</strong>,<br />
<strong>the</strong>re is no way of tell<strong>in</strong>g what proportion, if any, of<br />
his blood is <strong>Indian</strong>.<br />
Table 15<br />
DEGREE OF MIXTTTBE.