Indian population in the United States and Alaska. 1910 - RootsWeb
Indian population in the United States and Alaska. 1910 - RootsWeb
Indian population in the United States and Alaska. 1910 - RootsWeb

Create successful ePaper yourself
Turn your PDF publications into a flip-book with our unique Google optimized e-Paper software.
For all classes of marriages <strong>the</strong> proportion of sur-<br />
viv<strong>in</strong>g children was 74.7 per cent; for pure marriages it<br />
was 69.7 per cent, <strong>and</strong> for mixed marriages 79 per cent.<br />
A fur<strong>the</strong>r analysis of <strong>the</strong> mixed marriages shows that<br />
<strong>the</strong> percentages of children surviv<strong>in</strong>g were highest<br />
among children one of whose parents was white. Thus<br />
for marriages between full-bloods <strong>and</strong> whites <strong>the</strong> pro-<br />
portion of surviv<strong>in</strong>g children was 82.9 per cent, <strong>and</strong> for<br />
marriages between mixed-bloods <strong>and</strong> whites <strong>the</strong> proportion<br />
was 83 per cent, while for marriages among<br />
mixed-bloods it was only 77.6 per cent, <strong>and</strong> for marri-<br />
ages between fuU-bloods <strong>and</strong> mixed-bloods only 69.9<br />
per cent, or only slightly higher than for marriages between<br />
full-bloods (69.7 per cent), In <strong>the</strong> case of polygamous<br />
marriages a larger percentage of children<br />
survive than <strong>in</strong> full-blood monogamous marriages.<br />
The figures br<strong>in</strong>g out <strong>the</strong> fact that a larger propor-<br />
tion of <strong>the</strong> children hav<strong>in</strong>g one white parent survive<br />
than of children both of whose parents are full-blood<br />
or mixed-blood <strong>Indian</strong>s, but do not <strong>in</strong> <strong>the</strong>mselves show<br />
whe<strong>the</strong>r this is due to conditions <strong>in</strong> <strong>the</strong> home or to<br />
greater virility of <strong>the</strong> offspr<strong>in</strong>g.<br />
Fur<strong>the</strong>r evidence bear<strong>in</strong>g on this po<strong>in</strong>t may be<br />
ga<strong>the</strong>red by compar<strong>in</strong>g <strong>the</strong> relative vitality of <strong>the</strong> chil-<br />
dren of fuU-blood <strong>and</strong> mixed-blood parents, accord<strong>in</strong>g<br />
to <strong>the</strong> size of <strong>the</strong> family, observ<strong>in</strong>g whe<strong>the</strong>r <strong>the</strong> larger<br />
famihes which are characteristic of <strong>the</strong> mixed-bloods<br />
show a greater or less degree of vitality than <strong>the</strong><br />
smaller families of <strong>the</strong> fuU-bloods, <strong>and</strong> also <strong>the</strong> relative<br />
vitality of families of <strong>the</strong> same size <strong>in</strong> <strong>the</strong> various<br />
classes by blood.<br />
In <strong>the</strong> follow<strong>in</strong>g table three groups by blood are<br />
alone considered, <strong>in</strong> order to secure sufficiently large<br />
numbers to be of some value: (1) both parents of full<br />
blood of <strong>the</strong> same tribe, (2) both parents of mixed<br />
blood (white <strong>and</strong> <strong>Indian</strong>), (3) one parent mixed blood<br />
(white <strong>and</strong> <strong>Indian</strong>), <strong>the</strong> o<strong>the</strong>r white. For each of<br />
<strong>the</strong>se three groups, <strong>and</strong> for famihes of vary<strong>in</strong>g size,<br />
<strong>the</strong> percentage of cases occurr<strong>in</strong>g where aU <strong>the</strong> children<br />
bom survive, is shown. Only those cases, moreover,<br />
are tabulated where <strong>the</strong> mo<strong>the</strong>r has been mar-<br />
ried from 10 to 20 years.<br />
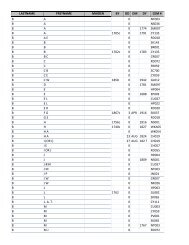
Table 67<br />
FECUNDITY AND VITALITY. 159