Indian population in the United States and Alaska. 1910 - RootsWeb
Indian population in the United States and Alaska. 1910 - RootsWeb
Indian population in the United States and Alaska. 1910 - RootsWeb

You also want an ePaper? Increase the reach of your titles
YUMPU automatically turns print PDFs into web optimized ePapers that Google loves.
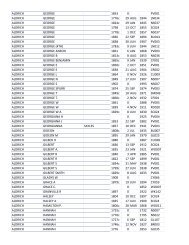
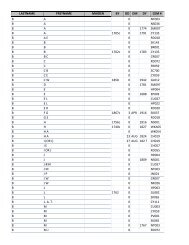
Number <strong>and</strong> proportion <strong>in</strong> <strong>the</strong> general divisions of<br />
occupations.—Table 104 shows, for both sexes <strong>and</strong> for<br />
each sex separately, <strong>the</strong> number of ga<strong>in</strong>fully occupied<br />
<strong>Indian</strong>s <strong>in</strong> <strong>the</strong> <strong>United</strong> <strong>States</strong> <strong>in</strong> <strong>1910</strong>, distributed by<br />
general divisions of occupations.<br />
Table 104<br />
SEX AND GENERAL DIVISION OF OCCUPATIONS.<br />
All occupations.<br />
Both Sexes.<br />
Agriculture, forestry, <strong>and</strong> animal husb<strong>and</strong>ry.<br />
Ertraction of m<strong>in</strong>erals<br />
Manufactur<strong>in</strong>g <strong>and</strong> mechanical <strong>in</strong>dustries<br />
Transportation<br />
Trade<br />
Public service (not elsewhere classified)<br />
.•<br />
Professional service<br />
Domestic <strong>and</strong> personal service<br />
Clerical occupations<br />
All occupations<br />
.<br />
MALE.<br />
Agriculture, forestry, <strong>and</strong> animal husb<strong>and</strong>ry.<br />
Extraction of m<strong>in</strong>erals<br />
Manufactur<strong>in</strong>g <strong>and</strong> mechanical <strong>in</strong>dustries<br />
Transportation<br />
Trade<br />
Public service (not elsewhere classified)<br />
Professional service<br />
Domestic <strong>and</strong> personal service<br />
Clerical occupations<br />
All occupations.<br />
FEMALE.<br />
Agriculture, forestry, <strong>and</strong> animal husb<strong>and</strong>ry.<br />
Extraction of m<strong>in</strong>erals<br />
Manufacturmg <strong>and</strong> mechanical <strong>in</strong>dustries<br />
Transportation<br />
Trade<br />
Public service (not elsewhere classified)<br />
Professional service<br />
Domestic <strong>and</strong> personal service<br />
Clerical occupations<br />
Number:<br />
<strong>1910</strong>.<br />
73,916<br />
51,070<br />
S63<br />
11,960<br />
1,930<br />
1,385<br />
752<br />
1,260<br />
4,609<br />
387<br />
59,206<br />
OCCUPATIONS. 255<br />
46,621<br />
553<br />
6,799<br />
1,909<br />
1,269<br />
733<br />
902<br />
1,118<br />
302<br />
14,710<br />
4,449<br />
10<br />
6.161<br />
21<br />
116<br />
19<br />
358<br />
3,491<br />
Per cent<br />
distribution.<br />
100.0<br />
69.1<br />
0.8<br />
16.2<br />
2.6<br />
1.9<br />
1.0<br />
1.7<br />
6.2<br />
0.5<br />
100.0<br />
7a 7<br />
0.9<br />
9.8<br />
3.2<br />
2,1<br />
1.2<br />
1.5<br />
1.9<br />
0.5<br />
100.0<br />
30.2<br />
0.1<br />
41.9<br />
0.1<br />
0.8<br />
0.1<br />
2.4<br />
23,7<br />
0,6<br />
Accord<strong>in</strong>g to Table 104, almost seven-tenths (69.1<br />
per cent) of <strong>the</strong> ga<strong>in</strong>fully occupied <strong>Indian</strong>s <strong>in</strong> <strong>the</strong><br />
<strong>United</strong> <strong>States</strong> <strong>in</strong> <strong>1910</strong> were engaged <strong>in</strong> agriculture,<br />
forestry, <strong>and</strong> animal husb<strong>and</strong>ry; <strong>and</strong> almost onesixth<br />
(16.2 per cent) of <strong>the</strong>m were engaged <strong>in</strong> manufactur<strong>in</strong>g<br />
<strong>and</strong> mechanical <strong>in</strong>dustries. Thus 85.3 per<br />
cent of <strong>the</strong> ga<strong>in</strong>fully occupied <strong>Indian</strong>s were engaged<br />
<strong>in</strong> <strong>the</strong>se two general divisions of occupations. Transportation<br />
gave employment to 2.6 per cent of <strong>the</strong> total,<br />
<strong>and</strong> domestic <strong>and</strong> personal service to 6.2 per cent, no<br />
o<strong>the</strong>r general division of occupations giv<strong>in</strong>g employment<br />
to as many as 2 per cent of <strong>the</strong> <strong>Indian</strong> workers.<br />
For <strong>the</strong> males, as for both sexes comb<strong>in</strong>ed, agriculture,<br />
forestry, <strong>and</strong> animal husb<strong>and</strong>ry gave employment<br />
to <strong>the</strong> largest proportion of <strong>the</strong> <strong>Indian</strong>s, 78.7 per<br />
cent, <strong>and</strong> manufactur<strong>in</strong>g <strong>and</strong> mechanical <strong>in</strong>dustries<br />
ranked second, with 9.8 per cent. Manufactur<strong>in</strong>g <strong>and</strong><br />
mechanical <strong>in</strong>dustries were <strong>the</strong> most important field<br />
of employment for <strong>the</strong> female <strong>Indian</strong> workers <strong>in</strong> <strong>1910</strong>,<br />
41.9 per cent of <strong>the</strong>m be<strong>in</strong>g engaged <strong>in</strong> this branch of<br />
occupations, as compared with 30.2 per cent <strong>in</strong> agri-<br />
culture, forestry, <strong>and</strong> animal husb<strong>and</strong>ry, <strong>and</strong> 23.7<br />
per cent <strong>in</strong> domestic <strong>and</strong> personal service.<br />
Occupations, by sex.— ^Table 105 shows, for <strong>the</strong><br />
<strong>United</strong> <strong>States</strong> <strong>and</strong> for <strong>Alaska</strong>, <strong>the</strong> number <strong>and</strong> sex of<br />
<strong>the</strong> <strong>Indian</strong>s 10 years of age <strong>and</strong> over engaged <strong>in</strong><br />
specified occupations <strong>and</strong> occupation groups <strong>in</strong> <strong>1910</strong>.<br />
Table 105 shows that <strong>in</strong> <strong>1910</strong> <strong>the</strong> <strong>Indian</strong>s of <strong>the</strong><br />
<strong>United</strong> <strong>States</strong> were employed <strong>in</strong> a ra<strong>the</strong>r large number<br />
of occupations. Their occupations also were quite<br />
diversified, rang<strong>in</strong>g all <strong>the</strong> way from unskilled labor to<br />
some of <strong>the</strong> highest proprietary, official, skilled, <strong>and</strong><br />
professional pursuits, such as manufacturers, bankers,<br />
<strong>United</strong> <strong>States</strong> officials, mechanical eng<strong>in</strong>eers, locomotive<br />
eng<strong>in</strong>eers, telegraph operators, actors, artists,<br />
clergymen, college professors, lawyers, <strong>and</strong> physicians<br />
<strong>and</strong> surgeons. But notwithst<strong>and</strong><strong>in</strong>g this diversity<br />
of <strong>the</strong> <strong>Indian</strong> occupations, it is never<strong>the</strong>less true that<br />
<strong>the</strong> great mass of <strong>the</strong> <strong>Indian</strong> workers <strong>in</strong> <strong>the</strong> <strong>United</strong><br />
<strong>States</strong> were engaged <strong>in</strong> a comparatively small num-<br />
ber of occupations. Almost 7 out of every 10<br />
(69.1 per cent) of <strong>the</strong> ga<strong>in</strong>fully occupied <strong>Indian</strong>s <strong>in</strong><br />
<strong>1910</strong> were engaged <strong>in</strong> agriculture, forestry, <strong>and</strong> animal<br />
husbanchy. Of <strong>the</strong> 225 occupations <strong>and</strong> occupation<br />
groups shown <strong>in</strong> Table 105, <strong>the</strong>re were only 39 that<br />
were pursued by lOf or more <strong>Indian</strong>s. Ten of <strong>the</strong>se<br />
occupations gave employment to 82.3 per cent of <strong>the</strong><br />
<strong>Indian</strong>s <strong>in</strong> ga<strong>in</strong>ful occupations, <strong>and</strong> 85.4 per cent of<br />
<strong>the</strong> total were employed <strong>in</strong> one of seven different large<br />
occupation groups: Agricultural laborers (35.5 per<br />
cent), farmers <strong>and</strong> stock raisers (29.2 per cent), lumbermen,<br />
raftsmen, <strong>and</strong> woodchoppers (2.4 per cent),<br />
laborers <strong>in</strong> manufactur<strong>in</strong>g <strong>and</strong> transportation (6.3<br />
per cent), basket makers <strong>and</strong> weavers (7.4 per cent),<br />
launderers <strong>and</strong> laundresses (1.9 per cent), <strong>and</strong> servants<br />
<strong>and</strong> waiters (2.6 per cent).<br />
For <strong>Alaska</strong>, Table 105 shows that while <strong>the</strong> ga<strong>in</strong>-<br />
fully occupied <strong>Indian</strong>s <strong>in</strong> <strong>1910</strong> were engaged <strong>in</strong> 85<br />
different occupations <strong>and</strong> occupation groups, rang<strong>in</strong>g<br />
all <strong>the</strong> way from fishermen <strong>and</strong> hunters to manufac-<br />
turers, Federal officials, clergymen, <strong>and</strong> school teachers,<br />
9 out of every 10 (90.1 per cent) were engaged<br />
<strong>in</strong> one of n<strong>in</strong>e different occupations <strong>and</strong> occupa-<br />
tion groups: Fishermen (24.1 per cent), re<strong>in</strong>deer<br />
herders <strong>and</strong> keepers (2.7 per cent), gold <strong>and</strong> silver<br />
m<strong>in</strong>e operatives (2.2 per. cent), laborers <strong>in</strong> <strong>the</strong> build<strong>in</strong>g<br />
'<strong>and</strong> h<strong>and</strong> trades (3.2 per cent), laborers <strong>and</strong><br />
semiskilled operatives <strong>in</strong> fish cur<strong>in</strong>g <strong>and</strong> pack<strong>in</strong>g (5.2<br />
per cent), basket <strong>and</strong> moccas<strong>in</strong> makers (1.5 per<br />
cent), retail dealers (1.5 per cent), hunters, trappers,<br />
<strong>and</strong> guides (47.8 per cent), <strong>and</strong> servants (1.9 per<br />
cent). Thus <strong>in</strong> <strong>1910</strong> fish<strong>in</strong>g, hunt<strong>in</strong>g, trapp<strong>in</strong>g, <strong>and</strong><br />
guid<strong>in</strong>g still gave employment to over seven-tenths<br />
(71.9 per cent) of <strong>the</strong> ga<strong>in</strong>fully employed <strong>Indian</strong>s of<br />
<strong>Alaska</strong>.