Indian population in the United States and Alaska. 1910 - RootsWeb
Indian population in the United States and Alaska. 1910 - RootsWeb
Indian population in the United States and Alaska. 1910 - RootsWeb

Create successful ePaper yourself
Turn your PDF publications into a flip-book with our unique Google optimized e-Paper software.
Information was collected by <strong>the</strong> Census Bureau <strong>in</strong><br />
<strong>1910</strong> ia regard to <strong>the</strong> number of children borne by<br />
every married woman. The results of <strong>the</strong> tabulation<br />
of this material for <strong>the</strong> <strong>Indian</strong> women are presented <strong>in</strong><br />
<strong>the</strong> follow<strong>in</strong>g discussion. Only those women were<br />
<strong>in</strong>cluded <strong>in</strong> <strong>the</strong> tabxilation who were between 15 <strong>and</strong><br />
44 years of age, who had been married for at least<br />
one year, <strong>and</strong> who were nei<strong>the</strong>r widowed nor divorced<br />
nor married a second or subsequent time. As a<br />
result of <strong>the</strong>se restrictions all <strong>the</strong> women <strong>in</strong>cluded<br />
<strong>in</strong> this tabulation answered <strong>the</strong> follow<strong>in</strong>g description:<br />
(1) They were of child-bear<strong>in</strong>g age; (2) had<br />
been married long enough to have children; <strong>and</strong> (3)<br />
were Uv<strong>in</strong>g <strong>in</strong> <strong>the</strong> married state at <strong>the</strong> time of <strong>the</strong><br />
enumeration.<br />
The last limitation makes possible <strong>the</strong> presentation<br />
of <strong>in</strong>formation about <strong>the</strong> husb<strong>and</strong> <strong>and</strong>, s<strong>in</strong>ce all<br />
second <strong>and</strong> subsequent marriages are excluded, <strong>the</strong><br />
children are <strong>in</strong> each case <strong>the</strong> offspr<strong>in</strong>g of <strong>the</strong> couple as<br />
shown on <strong>the</strong> schedule. In this manner most elements<br />
of uncerta<strong>in</strong>ty have been excluded, so that <strong>the</strong><br />
data lend <strong>the</strong>mselves to trustworthy <strong>in</strong>terpretation.<br />
In <strong>the</strong> tables of this section <strong>the</strong> degrees of mixture<br />
are given <strong>in</strong> <strong>the</strong> order of <strong>the</strong> <strong>in</strong>creas<strong>in</strong>g proportion of<br />
non-<strong>Indian</strong> blood, beg<strong>in</strong>n<strong>in</strong>g with marriages between<br />
full-blood <strong>Indian</strong>s <strong>and</strong> end<strong>in</strong>g with marriages between<br />
mixed-bloods <strong>and</strong> whites. The tables do not <strong>in</strong>clude<br />
all <strong>the</strong> possible comb<strong>in</strong>ations, but only those actually<br />
given on <strong>the</strong> schedules. Polygamous marriages, <strong>in</strong><br />
which husb<strong>and</strong> <strong>and</strong> wives are probably full-blood<br />
<strong>Indian</strong>s, are given separately at <strong>the</strong> end of <strong>the</strong> table.<br />
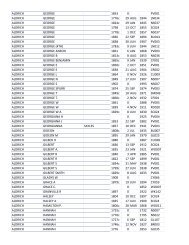
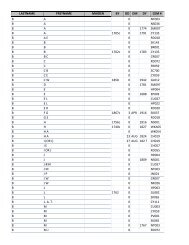
Sterility.— ^Table 53 presents <strong>the</strong> data on sterility.<br />
Table 53<br />
All classes.<br />
DEOBEE OF MZXTUKE.<br />
—<br />
Marriages among full-bloods<br />
Husb<strong>and</strong> <strong>and</strong> wife belong<strong>in</strong>g to same tribe<br />
Husb<strong>and</strong> <strong>and</strong> wife belong<strong>in</strong>g to different tribes.<br />
Mixed marriages ;<br />
Marriages of full-bloods with mrxed-bloods<br />
Wfle full blood, husb<strong>and</strong> white <strong>and</strong> <strong>Indian</strong>.<br />
Husb<strong>and</strong> full blood, wifewhite <strong>and</strong> <strong>Indian</strong>.<br />
Marriages of full-bloods with whites<br />
Wfie full blood, husb<strong>and</strong> white<br />
Husb<strong>and</strong> full blood, wife white<br />
Marriages among mixed-bloods<br />
Wfle white <strong>and</strong> <strong>Indian</strong>, husb<strong>and</strong> white<br />
<strong>and</strong> <strong>Indian</strong><br />
--<br />
Wife Negro <strong>and</strong> <strong>Indian</strong>, husb<strong>and</strong> Negro<br />
<strong>and</strong> <strong>Indian</strong><br />
;-••;<br />
Wife white, Negro, <strong>and</strong> <strong>Indian</strong>, husb<strong>and</strong><br />
white, Negro, <strong>and</strong> <strong>Indian</strong><br />
Marriages of mixed-bloods with.whites<br />
WMe white, husb<strong>and</strong> white <strong>and</strong> <strong>Indian</strong><br />
Husb<strong>and</strong> white, wife white <strong>and</strong> <strong>Indian</strong><br />
Polygamous marriages (husb<strong>and</strong> <strong>and</strong> wives probably<br />
full-blood <strong>Indian</strong>s)<br />
FECUNDITY AND VITALITY.<br />
WOMEN 15 TO 44 YEABS OF<br />
AQE, MABBIED ONE YEAR<br />
OB mobe: <strong>1910</strong>.<br />
Total<br />
number<br />
tabulated.<br />
21,S32<br />
10,379<br />
9,820<br />
559<br />
10,752<br />
1,508<br />
914<br />
208<br />
'3,' 970<br />
3,675<br />
101<br />
194<br />
6,066<br />
2,336<br />
2,730<br />
401<br />
Bear<strong>in</strong>g no<br />
children.<br />
Number. Per cent<br />
1,853<br />
1,111<br />
1,018<br />
93<br />
717<br />
133<br />
77<br />
56<br />
16<br />
16<br />
276<br />
254<br />
10<br />
12<br />
292<br />
174<br />
118<br />
25<br />
8.6<br />
10.7<br />
10.4<br />
16.6<br />
6.7<br />
8.8<br />
8.4<br />
9.4<br />
7.7<br />
7.7<br />
7.0<br />
6.9<br />
9.9<br />
6.2<br />
6.8<br />
7.4<br />
4.3<br />
6.2<br />
The most significant fact brought out by Table 53<br />
is that, while for aU classes of marriages <strong>the</strong> proportion<br />
result<strong>in</strong>g <strong>in</strong> no issue was 8.6 per cent <strong>and</strong> for marriages<br />
between full-bloods <strong>the</strong> proportion was 10.7 per<br />
cent, for mixed marriages it was only 6.7 per cent.<br />
Thus sterility is considerably less common <strong>in</strong> cases of<br />
miscegenation than <strong>in</strong> cases of marriage between fullbloods.<br />
Fur<strong>the</strong>rmore, <strong>the</strong> proportion of issueless marriages<br />
decreases directly as <strong>the</strong> amount of white blood<br />
<strong>in</strong> <strong>the</strong> married couple <strong>in</strong>creases. For <strong>the</strong> marriages of<br />
iull-bloods with mixed-bloods, where less than one-half<br />
of <strong>the</strong> blood was white, <strong>the</strong> percentage of sterility was<br />
8.8 ; for <strong>the</strong> marriages of full-bloods with whites, where<br />
one-half of <strong>the</strong> blood was white, <strong>the</strong> proportion of sterility<br />
was 7.7 per cent; for <strong>the</strong> marriages between<br />
mixed-bloods, where <strong>the</strong> proportion of white blood<br />
may have varied considerably but was probably one-<br />
half or more, sterility was shown <strong>in</strong> 7 per cent of <strong>the</strong><br />
cases; <strong>and</strong> f<strong>in</strong>ally, for marriages of mixed-bloods with<br />
whites, where more than one-half <strong>and</strong> often threefourths<br />
or more of <strong>the</strong> blood was white, <strong>the</strong> percentage<br />
of sterility was only 5.8. Thus an <strong>in</strong>verse relation<br />
between <strong>the</strong> amount of white blood <strong>in</strong> <strong>the</strong> married<br />
couple <strong>and</strong> <strong>the</strong> proportion of childless unions seems to<br />
be established by <strong>the</strong> table.<br />
In <strong>the</strong> case of polygamous marriages no separation<br />
by blood was made, but, as po<strong>in</strong>ted out previously,<br />
<strong>the</strong>se are almost without exception marriages between<br />
full-blood women <strong>and</strong> fuU-blood men, as such mar-<br />
riages were made, as a rule, a good many years ago.<br />
As a group, <strong>the</strong>n, by blood <strong>the</strong>se cases of plural wives<br />
may be compared with <strong>the</strong> fuU-blood groups already<br />
considered. It is apparent on comparison that<br />
women liv<strong>in</strong>g <strong>in</strong> polygamy show a considerably<br />
smaller percentage of steriHty than those <strong>in</strong> monogamous<br />
unions.<br />
Fecundity.—Table 54 deals only with women who<br />
have been married from 10 to 20 years, <strong>in</strong>clusive, <strong>and</strong><br />
dist<strong>in</strong>guishes those who have borne no more than two<br />
children (<strong>in</strong>clud<strong>in</strong>g those who have borne no children)<br />
from those who have borne from three to five children,<br />
<strong>and</strong> six or more children, as shown by <strong>the</strong> returns for<br />
<strong>1910</strong>.<br />
A comparison of <strong>the</strong> figures for marriages between<br />
full-bloods with mixed marriages shows <strong>the</strong> greater<br />
fertility of <strong>the</strong> latter; a smaller proportion resulted <strong>in</strong><br />
two children or less <strong>and</strong> <strong>in</strong> from three to five children<br />
than <strong>in</strong> <strong>the</strong> case of <strong>the</strong> pure marriages <strong>and</strong> a much<br />
higher proportion <strong>in</strong> six or more children.<br />
A fur<strong>the</strong>r analysis of mixed marriages shows, however,<br />
that as far as <strong>the</strong> number of children is concerned<br />
<strong>the</strong> proportion of white blood does not materially<br />
<strong>in</strong>fluence <strong>the</strong> offspr<strong>in</strong>g. In fact, <strong>the</strong> marriages between<br />
fuU-blood <strong>Indian</strong>s <strong>and</strong> whites are more prolific<br />
(157)