Comparative statistics.—The total number of <strong>Indian</strong>s <strong>in</strong> <strong>the</strong> <strong>United</strong> <strong>States</strong>, exclusive of outly<strong>in</strong>g possessions, <strong>in</strong> <strong>1910</strong> was 265,683,' <strong>and</strong> <strong>in</strong> <strong>Alaska</strong> 25,331. Table 1 presents <strong>the</strong> census figures for <strong>the</strong> <strong>United</strong> <strong>States</strong> <strong>and</strong> Table 1 YEAE. POPULATION. for <strong>Alaska</strong> separately for <strong>1910</strong> <strong>and</strong> earlier years, to- ge<strong>the</strong>r with figures for <strong>the</strong> <strong>United</strong> <strong>States</strong> (exclusive of <strong>Alaska</strong>) derived from <strong>the</strong> reports of <strong>the</strong> Commissioner of <strong>Indian</strong> Affairs.
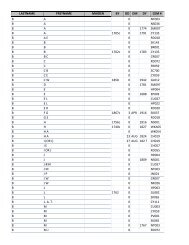
Mexico, which <strong>in</strong> 1890 <strong>and</strong> 1900 was fifth, came third <strong>in</strong> <strong>1910</strong>, hav<strong>in</strong>g replaced South Dakota, which <strong>in</strong> <strong>1910</strong> was <strong>in</strong> fourth place. Cahfornia, which formerly stood fourth, was fifth <strong>in</strong> <strong>1910</strong>, <strong>and</strong> Montana <strong>and</strong> Wash<strong>in</strong>gton, formerly sixth <strong>and</strong> seventh, had changed places <strong>in</strong> <strong>1910</strong>. M<strong>in</strong>nesota <strong>and</strong> Wiscons<strong>in</strong>, formerly eighth <strong>and</strong> n<strong>in</strong>th, also changed places <strong>in</strong> <strong>1910</strong>, <strong>and</strong> North Carol<strong>in</strong>a, which was twelfth <strong>in</strong> 1900, was tenth <strong>in</strong> <strong>1910</strong>, hav<strong>in</strong>g replaced North Dakota, which dropped 'to twelfth place, Michigan com<strong>in</strong>g eleventh <strong>in</strong> <strong>1910</strong>. Table Z <strong>United</strong> <strong>States</strong>.. GEOGEAPmO DmsiONS: New Engl<strong>and</strong> Middle Atlantic East North Central. West North Central. South Atlantic East South Central. . West South Central.. Mounta<strong>in</strong> Pacific DIVISION AND STATE. New Engl<strong>and</strong>: Ma<strong>in</strong>e New Hampshire Vermont Massachusetts Rhode Isl<strong>and</strong> Connecticut Middle Atlantic: New York New Jersey Pennsylvania East North Centbal: Ohio <strong>Indian</strong>a Bl<strong>in</strong>ois Michigan Wiscons<strong>in</strong> West North Central: M<strong>in</strong>nesota Iowa.- Missouri North Dakota South Dakota Nebraska South Atlantic: Delaware Maryl<strong>and</strong> District of Columbia. Virg<strong>in</strong>ia West Virg<strong>in</strong>ia North Carol<strong>in</strong>a South Carol<strong>in</strong>a Georgia Florida East South Central: Kentucky Tennessee Alabama West South Central: Arkansas Louisiana Oklahoma > Texas Mounta<strong>in</strong>: Montana Idaho Wyom<strong>in</strong>g Colorado.'. New Mexico Arizona Utah Nevada. Pacific: Wash<strong>in</strong>gton Oregon California INDIAN <strong>population</strong>. <strong>1910</strong> 1900 1890 265,683 2,076 7,717 lg,25S 41,406 9,054 2,612 76,767 76,338 32,458 892 34, 1S2 6,046 168 1,563 127 279 188 7,519 10, 142 9,053 471 313 6,486 19, 137 3,502 2,444 5 55 68 539 36 7,851 331 95 74 234 216 909 1,253 460 780 74,825 702 10,745 3,488 1,486 1,482 20,573 29,201 3,123 5,240 10,997 5,090 16,371 237,196 1,600 6,959 16,027 42,339 6,685 2,590 65,674 66, 155 30,367 POPULATION. 11 798 22 5 687 35 163 6,257 63 1,639 42 243 16 6,354 8,372 9,182 382 130 6,968 20,226 3,322 2,130 22 354 12 5,687 121 19 358 102 108 177 2,203 593 64,445 470 11,343 4,226 1,686 1,437 13, 144 26, 480 2,623 5,216 10,039 4,951 15,377 1 Includes <strong>Indian</strong> <strong>population</strong> of <strong>Indian</strong> Territory for 1900 <strong>and</strong> 1890. 248,253 1,445 7,209 16,202 46,822 2,369 3,396 66,042 72,002 32,776 559 16 34 428 180 228 6,044 84 1,081 206 6,625 9,930 10,096 457 128 8,174 19,854 6,431 1,682 4 44 25 349 9 1,516 173 68 171 71 146 1,143 2,036 250 628 64,456 708 11,206 4,223 1,844 1,092 15,044 29,981 3,466 6,156 11,181 4,971 16,624 Of <strong>the</strong> 265,683 <strong>Indian</strong>s <strong>in</strong> <strong>the</strong> <strong>United</strong> <strong>States</strong> <strong>in</strong> <strong>1910</strong> <strong>the</strong>re were 247,137 <strong>Indian</strong>s for whom special schedules conta<strong>in</strong><strong>in</strong>g data as to tribe <strong>and</strong> purity of blood were obta<strong>in</strong>ed, <strong>and</strong> 18,546 scattered <strong>Indian</strong>s enumerated on <strong>the</strong> general <strong>population</strong> schedule only. Table 3 shows this distribution by states. Table 3 <strong>United</strong> <strong>States</strong> . division <strong>and</strong> state. GEOQRAPmc divisions: New Engl<strong>and</strong> Middle Atlantic East North Central.. West North Central. South Atlantic East South Central. West South Central. Mounta<strong>in</strong> PactBc . . New Engl<strong>and</strong>: Ma<strong>in</strong>e New Hampshire Vermont Massachusetts Rhode Isl<strong>and</strong> Connecticut Middle Atlantic: New York New Jersey Pennsylvania East North Central: Ohio <strong>Indian</strong>a Ill<strong>in</strong>ois Michigan Wiscons<strong>in</strong> West North Central: M<strong>in</strong>nesota Iowa Missouri North Dakota South Dakota Nebraska Kansas South Atlantic: Delaware Maryl<strong>and</strong> District olColumbia . Virg<strong>in</strong>ia West Virg<strong>in</strong>ia North Carol<strong>in</strong>a South Carol<strong>in</strong>a Georgia Florida East South Central: Kentucky Tennessee Alabama Mississippi West South Central: Arkansas Louisiana Oklahoma Texas Mounta<strong>in</strong>: Montana Idaho. Wyom<strong>in</strong>g, Colorado lolor New Mexico. Arizona Utah Nevada Pacific: Wash<strong>in</strong>gton. Oregon California . . number of <strong>in</strong>du.ns enumerated: <strong>1910</strong>. Total. 265,683 2,076 7,717 18,266 41,406 9,064 2,612 76,767 76,338 32, 458 34 284 152 6,046 1168 2 1,603 127 279 188 7,519 10,142 9,053 471 313 6,486 19,137 3,602 8 2,444 5 66 68 539 36 7,851 331 96 74 234 216 909 1,253 460 780 74,826 702 10,745 3,488 1,486 1,482 20,573 29,201 3,123 6,240 10,997 6,090 16,371 On On general special popula- <strong>Indian</strong> tion schedules. schedule only. 247,137 1,320 6,392 16,502 39,435 7,870 1,488 71,630 73,074 29,426 806 3 433 "78 5,209 162 2 1,121 40 95 9 6,761 9,597 8,756 302 71 6,168 18,822 3,312 • 2,004 13 7,287 188 20 61 251 1,176 423 70,774 433 10,394 3,426 1,468 769 20,279 28,748 3,061 4,949 9,862 4,580 14,994 1 Includes 62 <strong>Indian</strong>s with Wild West Show. " Includes 1,010 <strong>Indian</strong>s emimerated <strong>in</strong> Carlisle <strong>Indian</strong> School. ' Includes 591 <strong>Indian</strong>s enumerated <strong>in</strong> Saskell Institute. 18,546 766 1,326 1,763 1,971 1,184 1,124 5,137 2,264 31 26 265 284 74 837 106 382 87 184 179 758 545 297 169 242 318 316 190 440 5 65 66 177 36 564 143 95 54 155 658 77 460 357 4,051 361 62 28 713 294 453 72 291 1,146 610 1,377 The number of <strong>Indian</strong>s <strong>in</strong> <strong>1910</strong> is shown for each of <strong>the</strong> 22 states hav<strong>in</strong>g an <strong>Indian</strong> <strong>population</strong> of 1,000 or over, <strong>and</strong> for "All o<strong>the</strong>r states" comb<strong>in</strong>ed, <strong>in</strong> Table 4. This is also shown graphically for <strong>the</strong> same states <strong>in</strong> <strong>the</strong> diagram accompany<strong>in</strong>g <strong>the</strong> table. The distri- bution of <strong>the</strong> <strong>Indian</strong> <strong>population</strong> of <strong>the</strong> <strong>United</strong> <strong>States</strong> is shown graphically <strong>in</strong> <strong>the</strong> map on page 9.
- Page 2 and 3: E PROM THE UNITED STATES GOVERNMENT
- Page 5: ^^ Cornell University Library The o
- Page 10 and 11: ASOQqt^
- Page 12 and 13: Sex Distribution—Continued. CONTE
- Page 14 and 15: 4 CONTENTS. Page. Illtteract 212-23
- Page 17: Sik: LETTER OF TRANSMITTAL. DEPARTM
- Page 21: This report gives the principal sta
- Page 25 and 26: 10,000 of the total population decr
- Page 27 and 28: POPULATION. 15 NUMBER OP INDIANS RE
- Page 29 and 30: Table 9 TEIBE AKD STATE. ABNAia (Al
- Page 31 and 32: Table 9—Continued. TRIBE AND STAT
- Page 33 and 34: Table 9—Continued. TRIBE AND STAT
- Page 35 and 36: POPULATION. 23 INDIAN POPULATION OF
- Page 37 and 38: Table 11 coiniTT. Alabaua. Autauga
- Page 39 and 40: POPULATION. INDIAN POPULATION OP TH
- Page 41 and 42: Table 1 1—C!ontinued. POPULATION.
- Page 43 and 44: FiiH-ilood and mixed-blood Indians.
- Page 45 and 46: PROPORTION OF MIXED-BLOODS. 33 DIST
- Page 47 and 48: In the United States, as shown by T
- Page 49 and 50: PROPORTION OF MIXED-BLOODS. 37 DIST
- Page 51 and 52: states, as reported in 1910. Table
- Page 53 and 54: PROPORTION OF MIXED -BLOODS. 41 DIS
- Page 55 and 56: In considering the classification o
- Page 57 and 58: SEX DISTRIBUTION. 45 INDIANS IN THE
- Page 59 and 60: Table 30 SEX DISTRIBUTION. 47 MALES
- Page 61 and 62: SEX DISTRIBUTION. 49 MALES TO 100 F
- Page 63 and 64: SEX DISTRIBUTION. 51 MALES TO 100 F
- Page 65 and 66: The Indian popula&n of the United S
- Page 67 and 68: Table 37 AGE DISTRIBUTION. 55 AGE D
- Page 69 and 70: AGE DISTRIBUTION. 57 DISTRIBUTION B
- Page 71 and 72: AGE DISTRIBUTION. 59 INDIANS IN THE
- Page 73 and 74:
AGE DISTRIBUTION. 61 AGE DISTKIBUTI
- Page 75 and 76:
AGE DISTRIBUTION. 63 AGE DISTRIBTTT
- Page 77 and 78:
Table 46 AGE DISTRIBUTION. 65 MALES
- Page 79 and 80:
een more frequently exposed to the
- Page 81 and 82:
AGE DISTRIBUTION. 69 MALES TO 100 F
- Page 83 and 84:
STOCKS AND TRIBES, BY SEX, AGE. AND
- Page 85 and 86:
STOCKS AND TRIBES, BY SEX, AGE, AND
- Page 87 and 88:
STOCKS AND TRIBES, BY SEX, AGE, AND
- Page 89 and 90:
STOCKS AND TRIBES, BY SEX, AGE, AND
- Page 91 and 92:
STOCKS AND TRIBES, BY SEX, AGE, AND
- Page 93 and 94:
STOCKS AND TRIBES, BY SEX, AGE, AND
- Page 95 and 96:
STOCKS AND TRIBES, BY SEX, AGE, AND
- Page 97 and 98:
STOCKS AND TRIBES, BY SEX, AGE, AND
- Page 99 and 100:
STOCKS AND TRIBES, BY SEX, AGE, AND
- Page 101 and 102:
STOCKS AND TRIBES, BY SEX, AGE, AND
- Page 103 and 104:
STOCKS AND TRIBES, BY SEX, AGE, AND
- Page 105 and 106:
STOCKS AND TRIBES, BY SEX, AGE, AND
- Page 107 and 108:
STOCKS AND TRIBES, BY SEX, AGE, AND
- Page 109 and 110:
STOCKS AND TRIBES, BY SEX, AGE, AND
- Page 111 and 112:
STOCKS AND TRIBES, BY SEX, AGE, AND
- Page 113 and 114:
STOCKS AND TRIBES, BY SEX, AGE, AND
- Page 115 and 116:
STOCKS AND TRIBES, BY SEX, AGE, AND
- Page 117 and 118:
STOCKS AND TRIBES, BY SEX, AGE, AND
- Page 119 and 120:
STOCKS AND TRIBES, BY SEX, AGE, AND
- Page 121 and 122:
STOCKS AND TRIBES, BY SEX, AGE, AND
- Page 123 and 124:
STOCKS AND TRIBES, BY SEX, AGE, AND
- Page 125 and 126:
STOCKS AND TRIBES, BY SEX, AGE, AND
- Page 127 and 128:
STOCKS AND TRIBES, BY SEX, AGE, AND
- Page 129 and 130:
STOCKS AND TRIBES, BY SEX, AGE, AND
- Page 131 and 132:
STOCKS AND TRIBES, BY SEX, AGE, AND
- Page 133 and 134:
STOCKS AND TRIBES, BY SEX, AGE, AND
- Page 135 and 136:
STOCKS AND TRIBES, BY SEX, AGE, AND
- Page 137 and 138:
STOCKS AND TRIBES, BY SEX, AGE, AND
- Page 139 and 140:
STOCKS AND TRIBES, BY SEX, AGE, AND
- Page 141 and 142:
STOCKS AND TRIBES, BY SEX, AGE, AND
- Page 143 and 144:
STOCKS AND TRIBES, BY SEX, AGE, AND
- Page 145 and 146:
STOCKS AND TRIBES, BY SEX, AGE, AND
- Page 147 and 148:
STOCKS AND TRIBES, BY SEX, AGE, AND
- Page 149 and 150:
STOCKS AND TRIBES, BY SEX, AGE, AND
- Page 151 and 152:
STOCKS AND TRIBES, BY SEX, AGE, AND
- Page 153 and 154:
STOCKS AND TRIBES, BY SEX, AGE, AND
- Page 155 and 156:
STOCKS AND TRIBES, BY SEX, AGE, AND
- Page 157 and 158:
STOCKS AND TRIBES, BY SEX, AGE, AND
- Page 159 and 160:
STOCKS AND TRIBES, BY SEX, AGE, AND
- Page 161 and 162:
STOCKS AND TRIBES, BY SEX, AGE, AND
- Page 163 and 164:
STOCKS AND TRIBES, BY SEX, AGE, AND
- Page 165 and 166:
STOCKS AND TRIBES, BY SEX, AGE, AND
- Page 167 and 168:
STOCKS AND TRIBES, BY SEX, AGE, AND
- Page 169 and 170:
Information was collected by the Ce
- Page 171 and 172:
For all classes of marriages the pr
- Page 173 and 174:
The statistics here given have refe
- Page 175 and 176:
Table 63 AGE FEEIOD. United States.
- Page 177 and 178:
MARITAL CONDITION. 165 MARITAL COND
- Page 179 and 180:
MARITAL CONDITION. 167 MARITAL COND
- Page 181 and 182:
MARITAL CONDITION. 169 MARITAL COND
- Page 183 and 184:
MARITAL CONDITION. 171 MARITAL COND
- Page 185 and 186:
MARITAL CONDITION. 173 MARITAL COND
- Page 187 and 188:
MARITAL CONDITION. 175 MARITAL COND
- Page 189 and 190:
MARITAL CONDITION. 177 MARITAL COND
- Page 191 and 192:
MARITAL CONDITION. 179 MARITAL COND
- Page 193 and 194:
MARITAL CONDITION. MARITAL CONDITIO
- Page 195 and 196:
MARITAL CONDITION. 183 MARITAL COND
- Page 197 and 198:
MARITAL CONDITION. 185 MAEITAL COND
- Page 199 and 200:
MARITAL CONDITION. 187 MARITAL COND
- Page 201 and 202:
MARITAL CONDITION. 189 MARITAL COND
- Page 203 and 204:
MARITAL CONDITION. 191 MARITAL COND
- Page 205 and 206:
MARITAL CONDITION. 193 MARITAL COND
- Page 207 and 208:
One of the most interesting social
- Page 209 and 210:
Table 74 shows, for the United Stat
- Page 211 and 212:
ance was reported, namely, Lutuamia
- Page 213 and 214:
SCHOOL ATTENDANCE. 201 SCHOOL ATTEN
- Page 215 and 216:
SCHOOL ATTENDANCE. 203 SCHOOL ATTEN
- Page 217 and 218:
SCHOOL ATTENDANCE. 205 SCHOOL ATTEN
- Page 219 and 220:
SCHOOL ATTENDANCE. 207 SCHOOL ATTEN
- Page 221 and 222:
SCHOOL ATTENDANCE. 209 SCHOOL ATTEN
- Page 223 and 224:
SCHOOL ATTENDANCE. 211 SCHOOL ATTEN
- Page 225 and 226:
difference between the sexes is par
- Page 227 and 228:
ILLITERACY. 215 ILLITERATE INDIAN M
- Page 229 and 230:
Athapaskan males and females and al
- Page 231 and 232:
ILLITERACY. 219 ILLITERATE INDIAN M
- Page 233 and 234:
ILLITERACY. 221 ILLITERATE INDIAN M
- Page 235 and 236:
ILLITERACY. 223 ILLITERATE INDIAN M
- Page 237 and 238:
ILLITERACY. 225 ILLITERATE INDIAN M
- Page 239 and 240:
ILLITERACY. 227 ILLITEKATES AMONG I
- Page 241 and 242:
ILLITERACY. ILLITERATES AMONG INDIA
- Page 243 and 244:
ILLITERACY. 231 ILLITEBATES AMONG I
- Page 245 and 246:
Of the 22 selected states, as skown
- Page 247 and 248:
INABILITY TO SPEAK ENGLISH. 235 PER
- Page 249 and 250:
INABILITY TO SPEAK ENGLISH. 237 IND
- Page 251 and 252:
INABILITY TO SPEAK ENGLISH. 239 IND
- Page 253 and 254:
INABILITY TO SPEAK ENGLISH. 241 IND
- Page 255 and 256:
INABILITY TO SPEAK ENGLISH. 243 IND
- Page 257 and 258:
INABILITY TO SPEAK ENGLISH. 245 IND
- Page 259 and 260:
INABILITY TO SPEAK ENGLISH. 247 IND
- Page 261 and 262:
INABILITY TO SPEAK ENGLISH. 249 IND
- Page 263 and 264:
For the male Indian population 10 y
- Page 265 and 266:
OCCUPATIONS. 253 NUMBER AND PROPORT
- Page 267 and 268:
Number and proportion in the genera
- Page 269 and 270:
OCCUPATIONS. 257 NUMBER OP INDIANS
- Page 271 and 272:
Table 107 AQE PEBIOD. UNITED STATES
- Page 273 and 274:
OCCUPATIONS. 261 NUMBER OF INDIAN M
- Page 275 and 276:
OCCUPATIONS. 263 NUMBER OF INDIAN M
- Page 277 and 278:
OCCUPATIONS. 265 NUMBER OP INDIAN M
- Page 279 and 280:
OCCUPATIONS. 267 NUMBER OP INDIAN M
- Page 281 and 282:
OCCUPATIONS. 269 NUMBER OF INDIAN M
- Page 283 and 284:
OCCUPATIONS. 271 NUMBER OF INDIAN M
- Page 285 and 286:
OCCUPATIONS. NUMBER OF INDIAN MALES
- Page 287 and 288:
OCCUPATIONS. 275 NUMBER OF INDIAN M
- Page 289 and 290:
OCCUPATIONS. 277 NUMBER OP INDIAN M
- Page 291 and 292:
OCCUPATIONS. NUMBEB OP INDLA.N MALE
- Page 293 and 294:
OCCUPATIONS. 281 NUMBER OF INDIAN M
- Page 295 and 296:
The apportionment of congressional
- Page 297:
INDIANS TAXED AND NOT TAXED. 285 PR