Indian population in the United States and Alaska. 1910 - RootsWeb
Indian population in the United States and Alaska. 1910 - RootsWeb
Indian population in the United States and Alaska. 1910 - RootsWeb

Create successful ePaper yourself
Turn your PDF publications into a flip-book with our unique Google optimized e-Paper software.
64 INDIANS IN THE UNITED STATES.<br />
Sex ratios, iy age groups.—Table 44 shows' <strong>the</strong> number<br />
of <strong>Indian</strong> males to 100 <strong>Indian</strong> females, by age<br />
groups, <strong>in</strong> <strong>the</strong> <strong>United</strong> <strong>States</strong> <strong>and</strong> <strong>Alaska</strong> <strong>in</strong> <strong>1910</strong>.<br />
Table 44<br />
AH ages<br />
Under 20 years...<br />
20 to 50 years<br />
61 years <strong>and</strong> over<br />
AGE PERIOD.<br />
MALES TO 100 FEMALES<br />
IN THE INDIAN POPU-<br />
LATION: <strong>1910</strong>.<br />
<strong>United</strong><br />
<strong>States</strong>.<br />
103.5<br />
102.8<br />
106.4<br />
100.7<br />
<strong>Alaska</strong>.<br />
. 105.<br />
;<br />
105.8<br />
105.0<br />
105.6<br />
It appears that <strong>in</strong> <strong>the</strong> <strong>United</strong> <strong>States</strong> <strong>in</strong> <strong>1910</strong> <strong>the</strong><br />
reported excess of males was greatest <strong>in</strong> <strong>the</strong> group 20<br />
to 50 years of age. In <strong>Alaska</strong> <strong>the</strong> proportion of <strong>the</strong><br />
sexes varied little <strong>in</strong> <strong>the</strong> different age groups.<br />
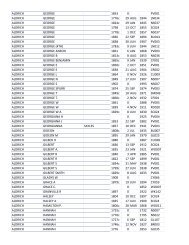
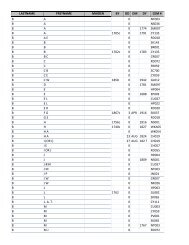
Table 45 shows, for each of <strong>the</strong> 22 selected states,<br />
<strong>the</strong> number of males to 100 females <strong>in</strong> each age group,<br />
while similar statistics for each pr<strong>in</strong>cipal stock <strong>and</strong><br />
tribe <strong>in</strong> <strong>the</strong> <strong>United</strong> <strong>States</strong> <strong>and</strong> <strong>Alaska</strong> are presented<br />
<strong>in</strong> Table 46 (p. 65). The excess of males or females<br />
<strong>in</strong> each age group is also shown graphically, by states,<br />
<strong>in</strong> <strong>the</strong> maps on this page.<br />
Table 45<br />
<strong>United</strong> <strong>States</strong>...<br />
Arizona<br />
Calilbmia<br />
Colorado<br />
Idaho<br />
Kansas'<br />
Michigan<br />
M<strong>in</strong>nesota<br />
Mississippi<br />
Montana<br />
Kebraslca<br />
Nevada ,<br />
New Mexico<br />
New York<br />
North Carol<strong>in</strong>a<br />
North Dakota<br />
Oklahoma<br />
Oregon<br />
South Dakota<br />
Utah<br />
Wash<strong>in</strong>gton<br />
Wiscons<strong>in</strong><br />
Wyom<strong>in</strong>g<br />
Under 20 years of<br />
age.<br />
Male.<br />
Fe-<br />
Males<br />
to 100<br />
male. fe-<br />
INDIAN <strong>population</strong>: <strong>1910</strong>.<br />
20 to 50 years of<br />
age.<br />
Male.<br />
Fe-<br />
Males<br />
to 100<br />
male. le-<br />
51 years of age <strong>and</strong><br />
over.<br />
Male.<br />
Fe- to 100<br />
male.females. 67,442 102.8 49,254 46,713 105.4 16,036 15,927 100.7<br />
7,965<br />
3,702<br />
7,424<br />
3,618<br />
107.3<br />
102.3<br />
5,351<br />
3,293<br />
5,134<br />
3,059<br />
104.2<br />
107.6<br />
1,647<br />
1,319<br />
1,519<br />
i,r-<br />
10a4<br />
102.6<br />
466<br />
700<br />
372<br />
659<br />
125.0<br />
106.2<br />
253<br />
705<br />
221<br />
689<br />
114 5<br />
102.3<br />
89<br />
345<br />
77<br />
351<br />
l'><br />
98.3<br />
614<br />
1,765<br />
425<br />
1,659<br />
120.9<br />
ioa4<br />
432<br />
1,565<br />
272<br />
1,321<br />
150.8<br />
117.7<br />
117<br />
641<br />
82<br />
666<br />
(')<br />
113.3<br />
2,411 2,246 107.3 1,616 1,600 100.9 546 626 87.1<br />
356 317 112.0 235 217 108.3 79 49 (')<br />
2,525<br />
902<br />
2,469<br />
872<br />
102.3<br />
103.4<br />
2,123<br />
634<br />
1,940<br />
609<br />
109.4<br />
1041<br />
734<br />
240<br />
943<br />
240<br />
77.8<br />
100.0<br />
1,031 1,023 100. 1,14G 1,158 99.0 414 389 106.4<br />
5,386 5,448 98.9 3,911 3,673 106.5 1,109 1,015 109.3<br />
1,318 1,419 92.9 1,281 1,172 109.3 462 368 125.5<br />
2,181<br />
1,634<br />
2,136<br />
1,737<br />
102.2<br />
941<br />
1,336<br />
1,129<br />
1,377<br />
1,026<br />
97.0<br />
110.0<br />
443<br />
465<br />
372<br />
490<br />
119.1<br />
92.9<br />
22,107 21,669 102.5 12,625 12,671 98.8 2,949 2,797 105.4<br />
1,245 1,182 106.3 912 870 104.8 374 497 75.3<br />
4,336 4,227 102.6 3,541 3,459 102.4 1, 1,888 87.2<br />
747 660 113.2 668 682 114 8 234 191 122.5<br />
2,647<br />
2,642<br />
328<br />
2,508<br />
2,561<br />
101.6<br />
99.6<br />
96.8<br />
2,046<br />
1,--<br />
325<br />
1,977<br />
1,705<br />
285<br />
103.5<br />
113.1<br />
114.0<br />
862<br />
738<br />
105<br />
975<br />
643<br />
100<br />
88.4<br />
114 8<br />
106.0<br />
Total for 22 states. 66,706 64,869 102.8 46,944 45,017 104 3 15,547 15,464<br />
All o<strong>the</strong>r states<br />
2,656 2,583 102.8 2,310 1,"' 136.2<br />
100.6<br />
106.6<br />
1 Ratio not shown, <strong>the</strong> number of females be<strong>in</strong>g less than 100.<br />
' Exclusive of <strong>Indian</strong>s <strong>in</strong> Haskell Institute, who are <strong>in</strong>cluded <strong>in</strong> <strong>the</strong> total for<br />
"All o<strong>the</strong>r states."<br />
EXCESS OF MALES OR FEMALES AMONG INDIANS UNDER 20<br />
YEARS OF AGE: <strong>1910</strong>.<br />
mjlj Excess of males. BSSSSS Excess of females. gg^ Number Identical.<br />
[<br />
1<br />
Less than lOO <strong>Indian</strong>s under 20 years of age In state.<br />
EXCESS OF MALES OR FEMALES AMONG INDIANS 20 TO 60<br />
YEARS OF AGE: <strong>1910</strong>.<br />
^Mt Excess of males. ^^ Excess of females. fj^/y/A Number identical,<br />
t I Less than 100 <strong>Indian</strong>s 20 to 60 years of age <strong>in</strong> state*.<br />
EXCESS OF MALES OR FEMALES AMONG INDIANS 51 YEARS OF<br />
AGE AND OVER: <strong>1910</strong><br />
WM Excess of males. tSSSSi Excess of females. (PZ!^ Number IdentlcaL<br />
I 1 Less than 100 <strong>Indian</strong>s 51 years of age <strong>and</strong> over In state.