Indian population in the United States and Alaska. 1910 - RootsWeb
Indian population in the United States and Alaska. 1910 - RootsWeb
Indian population in the United States and Alaska. 1910 - RootsWeb

You also want an ePaper? Increase the reach of your titles
YUMPU automatically turns print PDFs into web optimized ePapers that Google loves.
een more frequently exposed to <strong>the</strong> dangers of war<br />
tihan tlie mixed-bloods, <strong>and</strong> that this was more frequently<br />
<strong>the</strong> case <strong>in</strong> <strong>the</strong> period when <strong>the</strong> <strong>Indian</strong>s who<br />
are now <strong>in</strong> <strong>the</strong> older age group were young than dur<strong>in</strong>g<br />
<strong>the</strong> lifetime of those <strong>in</strong> <strong>the</strong> o<strong>the</strong>r age groups. Errors<br />
<strong>in</strong> classification of <strong>Indian</strong> women have probably also<br />
affected <strong>the</strong> statistics.<br />
Table 48<br />
.<br />
UNSEB 20 YEABS<br />
OF AQE.<br />
<strong>United</strong> <strong>States</strong> 34,200 32,929 103.9<br />
20 TO SO TEABS<br />
OF AGE.<br />
AGE DISTRIBUTION. 67<br />
51 YEASS OF AQE<br />
AND OVER.<br />
Male. Fe-<br />
Males<br />
to<br />
male. 100 fe-<br />
Male.<br />
males.Fe-<br />
Males<br />
to<br />
male. 100 fe-<br />
Male.<br />
males.Fe-<br />
Males<br />
to<br />
male. 100 females.<br />
INDIAKS OF FULL BLOOD.<br />
1,415 28,889 101.8 11,75712,262<br />
Arizona...<br />
7,401 6,939 106.7 4,i 4,738 103.3 1,546 1,433 107.9<br />
California.<br />
2,042 1,965 103.9 2,009 2,080 99.5 1,135 1,131 100.4<br />
Colorado..<br />
Idaho<br />
181<br />
524<br />
170<br />
497<br />
106.5<br />
105.4<br />
126<br />
570<br />
128<br />
584<br />
98.4<br />
97.6<br />
62<br />
319<br />
50<br />
336<br />
(})<br />
94.9<br />
Michigan<br />
108<br />
698<br />
81<br />
640 iS.i<br />
155<br />
749<br />
69<br />
675 111.0<br />
60<br />
386<br />
36<br />
371<br />
(')<br />
104.0<br />
If<strong>in</strong>nesota<br />
Mississippi<br />
Montana<br />
879<br />
306<br />
1,127<br />
759<br />
270<br />
1,174<br />
115.8<br />
113.3<br />
96.0<br />
702<br />
203<br />
1,274<br />
753<br />
191<br />
1,234<br />
93.2<br />
106.3<br />
103.2<br />
328<br />
68<br />
587<br />
435<br />
39<br />
804<br />
75.4<br />
n<br />
73.0<br />
Nebraska<br />
Nevada<br />
New Mexico<br />
'.<br />
New York<br />
North Carol<strong>in</strong>a.<br />
511<br />
812<br />
5,253<br />
608<br />
336<br />
485<br />
771<br />
5,308<br />
652<br />
299<br />
105.4<br />
105.3<br />
99.0<br />
93.3<br />
112.4<br />
440<br />
941<br />
3,829<br />
583<br />
441<br />
996<br />
3,592<br />
557<br />
272<br />
99.8<br />
94.5<br />
106.6<br />
104.7<br />
98.9<br />
204<br />
389<br />
1,087<br />
240<br />
110<br />
209<br />
363<br />
991<br />
200<br />
103<br />
97.6<br />
107.2<br />
109.7<br />
120.0<br />
106.8<br />
North Dakota..<br />
Oklahoma<br />
Oregon<br />
506<br />
5,<br />
540<br />
496<br />
5,635<br />
510<br />
102.0<br />
104.1<br />
105.9<br />
5,432<br />
540<br />
432<br />
5,637<br />
562<br />
108.6<br />
96.4<br />
96.1<br />
260<br />
1,597<br />
303<br />
327<br />
1,601<br />
441<br />
79.5<br />
99.8<br />
68.7<br />
South Da,kota..<br />
Utah<br />
Wash<strong>in</strong>gton<br />
Wiscons<strong>in</strong><br />
Wyom<strong>in</strong>g<br />
Total for 22 states.<br />
2,573 2,512<br />
701 599<br />
1,332 1,281<br />
1,115 1,160<br />
250 240<br />
33,669 32,443<br />
102.4 2,481 2,506<br />
117.0 612 553<br />
104.0 1,207 1,325<br />
96.1 1,017 971<br />
104.2 261 237<br />
103.8 28,825 28,533<br />
99.0 1,434 1,715<br />
110.7 223 186<br />
91.1 733 835<br />
104.7<br />
471<br />
110.1<br />
90<br />
101.0 11,649 12,167<br />
83.6<br />
119.9<br />
87.8<br />
103.2<br />
«<br />
95.7<br />
All o<strong>the</strong>r states<br />
531 486 109.3 590 356 165.7 108 95<br />
1 Ratio not shown, <strong>the</strong> number of females be<strong>in</strong>g less than 100.<br />
95.9<br />
.<br />
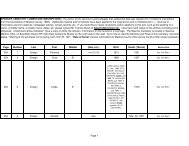
Table 48 shows, for each of <strong>the</strong> 22 selected states,<br />
<strong>the</strong> number of males to 100 females <strong>in</strong> each age<br />
group among <strong>the</strong> <strong>Indian</strong>s of full blood <strong>and</strong> of mixed<br />
blood, respectively, while similar statistics, for each<br />
stock <strong>and</strong> tribe ia <strong>the</strong> <strong>United</strong> <strong>States</strong> <strong>and</strong> <strong>Alaska</strong> hav-<br />
<strong>in</strong>g 200 or more <strong>Indian</strong>s <strong>in</strong> <strong>1910</strong>, are presented <strong>in</strong><br />
Table 49.<br />
Arizona<br />
California.<br />
Colorado...<br />
Idaho<br />
Michigan..<br />
M<strong>in</strong>nesota.<br />
<strong>United</strong> <strong>States</strong>...<br />
Montana..<br />
Nebraska<br />
Nevada<br />
New Mexico<br />
New York<br />
North Carol<strong>in</strong>a.<br />
North Dakota..<br />
Okl^oma<br />
Oregon<br />
South Dakota..<br />
Utah.:<br />
Wash<strong>in</strong>gton<br />
Wiscons<strong>in</strong><br />
Wyom<strong>in</strong>g<br />
T7NDEB 20 TEABS<br />
OF AGE.<br />
Male.<br />
Total for 22 states .. 28, 728 28,079<br />
All o<strong>the</strong>r states 884<br />
20 TO 50 YEABS<br />
OF AGE.<br />
51 TEAKS OP AGE<br />
AND OVEB.<br />
Males<br />
Fe- to<br />
male. 100 fe-<br />
Male.<br />
males.Fe-<br />
Males<br />
to<br />
male. 100 feFe-<br />
to<br />
Male.<br />
male. 100 females.males.<br />
INDIANS OF MIXED BLOOD.<br />
1,612 28,941 102.3 15,29513,713 111.5 3,176 2,650 124.5<br />
168<br />
1,343<br />
23<br />
158<br />
115<br />
S4<br />
150<br />
146.1<br />
103.5<br />
(')<br />
105.3<br />
281 227 123.8<br />
880 837 105.1<br />
1,467 1,415 103.7<br />
26 29 (')<br />
1,230 1,146 107.3<br />
314 315 99.7<br />
159 182 87.4<br />
63 57 {')<br />
509 516 98.<br />
1,665 1,660 100.3<br />
1,022 1,149 88.9<br />
14,875 14,510 102.5<br />
587 538 109.1<br />
1,637 1,604 102.1<br />
23 38 (>)<br />
934 941 99.3<br />
1,287 1,244 103.6<br />
77 94 (')<br />
102.3<br />
102.6<br />
67<br />
824<br />
2<br />
105<br />
187<br />
639<br />
847<br />
14<br />
713<br />
143<br />
92<br />
26<br />
404<br />
981<br />
569<br />
i,388<br />
261<br />
984<br />
26<br />
561<br />
782<br />
57<br />
47<br />
619<br />
5<br />
82<br />
130<br />
509<br />
780<br />
12<br />
604<br />
122<br />
72<br />
21<br />
354<br />
1,011<br />
517<br />
6,184<br />
214<br />
856<br />
10<br />
419<br />
636<br />
40<br />
14,672 13,244<br />
623<br />
1''<br />
133.1<br />
143.8<br />
125.5<br />
108.6<br />
(>)<br />
118.0<br />
117.2<br />
114.1<br />
97.0<br />
110.1<br />
103.3<br />
122.0<br />
116.0<br />
«<br />
133.9<br />
123.0<br />
110.8<br />
132.8<br />
11<br />
82<br />
4<br />
11<br />
37<br />
205<br />
198<br />
5<br />
105<br />
24<br />
1<br />
5<br />
136<br />
298<br />
166<br />
169<br />
2<br />
87<br />
227<br />
3,053<br />
123<br />
146<br />
176<br />
4<br />
93<br />
21<br />
2<br />
3<br />
105<br />
238<br />
134<br />
1,043<br />
26<br />
148<br />
2<br />
60<br />
149<br />
7<br />
2,437<br />
113<br />
^ Exclusive of <strong>Indian</strong>s <strong>in</strong> Haskell Institute, who are <strong>in</strong>cluded <strong>in</strong> <strong>the</strong> total for "All o<strong>the</strong>r states."<br />
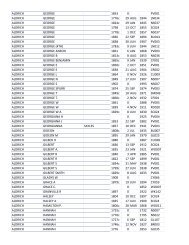
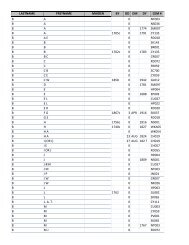
MALES TO 100 FEMALES IN EACH AGE GROUP AMONG INDIANS OF FULL BLOOD AND OF MIXED BLOOD, FOR<br />
EACH PRINCIPAL STOCK AND TRIBE: <strong>1910</strong>.<br />
Table 49<br />
[This table shows each stock <strong>and</strong> tribe hav<strong>in</strong>g 200 or more <strong>Indian</strong>s <strong>in</strong> <strong>1910</strong>. Ratio not shown where number of females is less than 100.)<br />
126.3<br />
108.8