Indian population in the United States and Alaska. 1910 - RootsWeb
Indian population in the United States and Alaska. 1910 - RootsWeb
Indian population in the United States and Alaska. 1910 - RootsWeb

Create successful ePaper yourself
Turn your PDF publications into a flip-book with our unique Google optimized e-Paper software.
CONTENTS.<br />
SUMMARY OF SUBJECTS.<br />
Letter op Transmittal 7<br />
Introdtjction 9<br />
Population 10-30<br />
Proportion of Mixed-Bloods 31-42<br />
Sex Distribution 43-52<br />
Age Distribution 53-70<br />
Stocks <strong>and</strong> Tribes, by Sex, Age, <strong>and</strong> Mixture of Blood 71-156<br />
Fecundity <strong>and</strong> Vitality 157-160<br />
Marital Condition 161-194<br />
School Attendance 195-211<br />
Illiteracy 212-231<br />
Inability to Speak English 232-249<br />
Occupations 250-282<br />
INDIA.NS Taxed <strong>and</strong> Not Taxed 283-285<br />
CONTENTS OF SUBJECTS.<br />
Introduction 9<br />
Population<br />
10-30<br />
Comparative statistics<br />
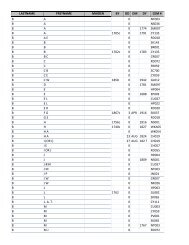
Table 1.—<strong>Indian</strong> <strong>population</strong> <strong>in</strong> <strong>the</strong> <strong>United</strong> <strong>States</strong> <strong>and</strong> <strong>Alaska</strong>: 1870-<strong>1910</strong><br />
Table 2.—<strong>Indian</strong> <strong>population</strong>, by divisions <strong>and</strong> states: 1890-<strong>1910</strong><br />
Table 3.—^Number of <strong>Indian</strong>s enumerated on special <strong>and</strong> general schedule, by divisions <strong>and</strong> states:<br />
Table 4.—Number <strong>and</strong> per cent distribution of <strong>Indian</strong>s, for 22 selected states: <strong>1910</strong><br />
<strong>1910</strong><br />
10<br />
10<br />
11<br />
11<br />
12<br />
<strong>Indian</strong>a per 10,000 of total <strong>population</strong> 12<br />
Table 5.—Number of <strong>Indian</strong>a per 10,000 of total <strong>population</strong>, for <strong>the</strong> <strong>United</strong> <strong>States</strong> <strong>and</strong> <strong>Alaska</strong>: 1870-<strong>1910</strong> 13<br />
Table 6.—Number of <strong>Indian</strong>s per 10,000 of total <strong>population</strong>, for 22 selected states: 1890-<strong>1910</strong> 13<br />
<strong>Indian</strong>s per 100 square miles - 14<br />
Table 7.—^Number of <strong>Indian</strong>s per 100 square xoiles, for 22 selected states: <strong>1910</strong> , 14<br />
<strong>Indian</strong>s by stock <strong>and</strong> tribe<br />
^<br />
14<br />
;<br />
Table 8.—^Number of <strong>Indian</strong>s reported on special <strong>Indian</strong> schedule, classified by l<strong>in</strong>guistic stocks <strong>and</strong> tribes: <strong>1910</strong> 15<br />
Table 9.—^<strong>Indian</strong> tribes, by states: <strong>1910</strong> 17<br />
Table 10.—<strong>Indian</strong> <strong>population</strong> of <strong>the</strong> different states, by tribes: <strong>1910</strong> 22<br />
Table 11.—<strong>Indian</strong> <strong>population</strong> of <strong>the</strong> <strong>United</strong> <strong>States</strong>, by counties: 1890-<strong>1910</strong> : 25<br />
Proportion of Mixed-Bloods<br />
31-42<br />
FuU-blood <strong>and</strong> mixed-blood <strong>Indian</strong>s<br />
31<br />
Table 12.—Distribution of <strong>Indian</strong>s accordiag to purity of blood, for <strong>the</strong> <strong>United</strong> <strong>States</strong> <strong>and</strong> <strong>Alaska</strong>: <strong>1910</strong><br />
Table 13.—Distribution of <strong>Indian</strong>s accord<strong>in</strong>g to purity of blood, for 22 selected states: <strong>1910</strong><br />
Table 14.—Distribution of <strong>Indian</strong>s accord<strong>in</strong>g to purity of blood, for each pr<strong>in</strong>cipal stock, tribe, <strong>and</strong> state: <strong>1910</strong><br />
31<br />
32<br />
32<br />
White <strong>and</strong> <strong>Indian</strong> mised-bloods<br />
35<br />
Table 15.—White <strong>and</strong> <strong>Indian</strong> mixed-bloods, by degree of mixture: <strong>1910</strong> 35<br />
Table 16.—Distribution of white <strong>and</strong> <strong>Indian</strong> mixed-bloods accord<strong>in</strong>g to proportion of white blood, f6r 22 selected states:<br />
<strong>1910</strong> V -.<br />
Page.<br />
^^<br />
Table 17.—Distribution of white <strong>and</strong> <strong>Indian</strong> mixed-bloods accord<strong>in</strong>g to proportion of white blood, for each pr<strong>in</strong>cipal stock,<br />
tribe, <strong>and</strong> state: <strong>1910</strong><br />
36<br />
Negro <strong>and</strong> <strong>Indian</strong> mixed-bloods<br />
38<br />
Table 18.—Negro <strong>and</strong> <strong>Indian</strong> mixed-bloods, by degree of mixture: <strong>1910</strong> 38<br />
Full-tribal <strong>and</strong> mixed-tribal <strong>Indian</strong>s<br />
38<br />
Table 19.—Full-blood <strong>Indian</strong>s, by degree of tribal mixture: <strong>1910</strong><br />
38<br />
Table 20.—Distribution of full-blood <strong>Indian</strong>s accord<strong>in</strong>g to tribal mixture, for 22 selected states: <strong>1910</strong> 38<br />
Table 21.—Distribution of full-blodd <strong>Indian</strong>s accord<strong>in</strong>g to purity of stock: <strong>1910</strong><br />
Table 22.—Distribution of full-blood <strong>Indian</strong>s accord<strong>in</strong>g to tribal mixture, for each pr<strong>in</strong>cipal tribe <strong>and</strong> state: <strong>1910</strong><br />
Sex Distribution<br />
39<br />
41<br />
43-52 ^<br />
Comparative statistics<br />
Table 23.—Sex distribution of <strong>the</strong> <strong>Indian</strong>s <strong>in</strong> <strong>the</strong> <strong>United</strong> <strong>States</strong> <strong>and</strong> <strong>Alaska</strong>: 1890-<strong>1910</strong><br />
Table 24.—Males to 100 females <strong>in</strong> <strong>the</strong> <strong>Indian</strong> <strong>population</strong>, for 22 selected states: 1890-<strong>1910</strong><br />
43<br />
44<br />
67090°—15 1<br />
(^)