Presentation - WPP.com
Presentation - WPP.com
Presentation - WPP.com

Create successful ePaper yourself
Turn your PDF publications into a flip-book with our unique Google optimized e-Paper software.
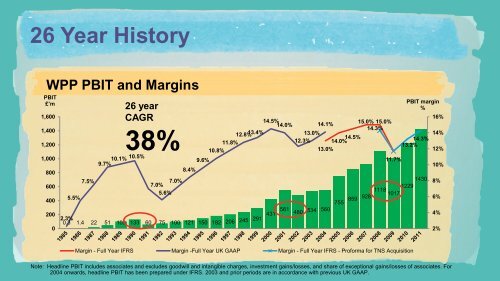
26 Year History<br />
<strong>WPP</strong> PBIT and Margins<br />
PBIT<br />
£’m<br />
1,600<br />
1,400<br />
1,200<br />
1,000<br />
800<br />
26 year<br />
CAGR<br />
14.0%<br />
13.0%<br />
14.5%<br />
15.0% 15.0%<br />
12.8%<br />
11.8%<br />
10.8%<br />
10.1%<br />
10.5%<br />
9.7%<br />
9.6%<br />
8.4%<br />
11.7%<br />
13.4%<br />
38%<br />
14.5%<br />
14.0% 14.1%<br />
14.3%<br />
13.0%<br />
12.3%<br />
0.3 1.4 22 51 103 133 60 75 100 121 150 182 206 245 291 431 561 480 534 600<br />
7.5%<br />
7.0%<br />
7.0%<br />
400<br />
5.5%<br />
5.6%<br />
859<br />
928<br />
755<br />
200<br />
0<br />
2.3%<br />
560<br />
14.3%<br />
13.2%<br />
1430<br />
1229<br />
1118<br />
1017<br />
Margin - Full Year IFRS Margin -Full Year UK GAAP Margin - Full Year IFRS - Proforma for TNS Acquisition<br />
PBIT margin<br />
%<br />
Note: Headline PBIT includes associates and excludes goodwill and intangible charges, investment gains/losses, and share of exceptional gains/losses of associates. For<br />
2004 onwards, headline PBIT has been prepared under IFRS. 2003 and prior periods are in accordance with previous UK GAAP.<br />
16%<br />
14%<br />
12%<br />
10%<br />
8%<br />
6%<br />
4%<br />
2%