A Complex System View on the Financial and Economic Crisis
A Complex System View on the Financial and Economic Crisis
A Complex System View on the Financial and Economic Crisis

You also want an ePaper? Increase the reach of your titles
YUMPU automatically turns print PDFs into web optimized ePapers that Google loves.
A <str<strong>on</strong>g>Complex</str<strong>on</strong>g> <str<strong>on</strong>g>System</str<strong>on</strong>g> <str<strong>on</strong>g>View</str<strong>on</strong>g><br />
<strong>on</strong> <strong>the</strong> <strong>Financial</strong> <strong>and</strong> Ec<strong>on</strong>omic <strong>Crisis</strong><br />
Princet<strong>on</strong> University Press (2003)<br />
Department of Management, Technology <strong>and</strong><br />
Ec<strong>on</strong>omics, ETH Zurich, Switzerl<strong>and</strong><br />
Member of <strong>the</strong> Swiss Finance Institute<br />
co-founder of <strong>the</strong> Competence Center for Coping<br />
with Crises in Socio-Ec<strong>on</strong>omic <str<strong>on</strong>g>System</str<strong>on</strong>g>s, ETH<br />
Zurich (http://www.ccss.ethz.ch/)<br />
l<strong>on</strong>g-term Collaborators:<br />
Y. Age<strong>on</strong> (Insight Finance, France)<br />
J. Andersen (CNRS, France)<br />
D. Darcet (Insight Research)<br />
K. Ide (UCLA)<br />
A. Johansen (Denmark)<br />
Y. Malevergne (Univ. Ly<strong>on</strong>, France)<br />
V: Pïsarenko (Acad. Sci. Moscow, Russia)<br />
W.-X. Zhou (UCLA, now at Shanghai)<br />
more recent collaborators:<br />
G. Harras (ETH Zurich)<br />
T. Kaizoji (Tokyo)<br />
A. Saichev (ETH Zurich <strong>and</strong> Nizhny Novgorod)<br />
R. Woodard <strong>and</strong> H. Woodard (ETH Zurich)<br />
W. Yan (ETH Zurich)<br />
A. Huesler (ETH Zurich)<br />
M. Fedorovsky (ETH Zurich)<br />
S. Reimann (ETH Zurich)
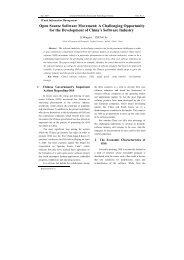
Canada<br />
Index: TSE300<br />
3-m<strong>on</strong>th change:<br />
-34.04% Icel<strong>and</strong>: Near Collapse<br />
Index: OMXI15<br />
3-m<strong>on</strong>th change: France Hungary: Flight From<br />
-29.12% Index: CAC40 Risk<br />
3-m<strong>on</strong>th Index: change: BUX<br />
United States<br />
Index: DJIA<br />
3-m<strong>on</strong>th change:<br />
-24.74%<br />
Mexico: Currency<br />
-24.93% 3-m<strong>on</strong>th change:<br />
Lithuania<br />
-29.09%<br />
Bulgaria: Index: OMXVGI Overheating<br />
Index: 3-m<strong>on</strong>th SOFIXchange:<br />
Spain 3-m<strong>on</strong>th -38.39% change:<br />
Index: -47.11% IBEX35 Index: KWSE<br />
Squeeze<br />
3-m<strong>on</strong>th change:<br />
Index: IPC<br />
3-m<strong>on</strong>th change:<br />
-28.60%<br />
-23.36%<br />
Venezuela: Volatile Mix<br />
Index: CARACAS<br />
3-m<strong>on</strong>th change:<br />
-5.17%<br />
Brazil: Banks Suffer<br />
Index: BOVESPA<br />
3-m<strong>on</strong>th change:<br />
-40.90%<br />
-19.43%<br />
Argentina: Beholden to<br />
Borrowing<br />
Index: ARGMERV<br />
3-m<strong>on</strong>th change:<br />
-37.32%<br />
Est<strong>on</strong>ia: Party’s Over<br />
Index: OMXTGI<br />
3-m<strong>on</strong>th change:<br />
-30.33%<br />
October 2008<br />
South Korea: W<strong>on</strong><br />
Latvia<br />
Russia<br />
Germany<br />
Weakness<br />
Engl<strong>and</strong><br />
Index: Index: RTSI<br />
Index: XETRADAX<br />
Romania OMXRGI<br />
Index: KOSPI<br />
Index: FT100<br />
3-m<strong>on</strong>th 3-m<strong>on</strong>th change:<br />
3-m<strong>on</strong>th<br />
Index: change:<br />
change:<br />
BETI<br />
3-m<strong>on</strong>th change: -13.73%<br />
3-m<strong>on</strong>th<br />
-35.00%<br />
change:<br />
-61.36%<br />
-27.93%<br />
3-m<strong>on</strong>th change:<br />
-27.28% -48.49%<br />
Italy<br />
Index: SPMIB Turkey<br />
China Japan<br />
3-m<strong>on</strong>th change: Index: ISTIMKB<br />
Kuwait: Oil Shock<br />
Index: SHANGCIndex:<br />
NIKK225<br />
-28.58% 3-m<strong>on</strong>th change:<br />
3-m<strong>on</strong>th change: 3-m<strong>on</strong>th change:<br />
-19.90%<br />
3-m<strong>on</strong>th change: India -30.43%<br />
United<br />
-36.66%<br />
Arab Emirates:<br />
Index: SENSEX<br />
Liquidity Crunch<br />
3-m<strong>on</strong>th change:<br />
Index: DFMGI<br />
-24.40%<br />
3-m<strong>on</strong>th change: -40.84%<br />
Nigeria: Fitful Boom<br />
Index: LAGLG<br />
3-m<strong>on</strong>th change:<br />
-19.05%<br />
South Africa: Needs<br />
Capital Flow<br />
Index: JOHANNALL<br />
3-m<strong>on</strong>th change:<br />
-25.62%<br />
Australia: Flight From<br />
Currency<br />
Index: ASX200<br />
3-m<strong>on</strong>th change:<br />
-19.78%<br />
Ind<strong>on</strong>esia: Coal Stocks<br />
Collapse<br />
Index: JAKCOMP<br />
3-m<strong>on</strong>th change:<br />
-36.22%<br />
New Zeal<strong>and</strong><br />
Index: NZ50<br />
3-m<strong>on</strong>th change:<br />
-9.87%
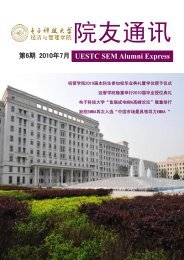
Canada<br />
Currency: Canadian dollars<br />
3-m<strong>on</strong>th change: -14.52%<br />
Icel<strong>and</strong><br />
Currency: Icel<strong>and</strong> kr<strong>on</strong>a<br />
Latvia<br />
Russia<br />
3-m<strong>on</strong>th change:<br />
Hungary<br />
Europe<br />
Currency: Romania Latvian lats Currency: Russian ruble<br />
-22.73%<br />
South Korea<br />
Engl<strong>and</strong>Currency:<br />
Hungarian<br />
Currency:<br />
3-m<strong>on</strong>th Currency: Euro<br />
change: Romanian leu 3-m<strong>on</strong>th change:<br />
Currency: South Korean<br />
Currency: forint British pound<br />
3-m<strong>on</strong>th<br />
-15.86% 3-m<strong>on</strong>th change: change: -10.80%<br />
w<strong>on</strong><br />
3-m<strong>on</strong>th 3-m<strong>on</strong>th change: Lithuania change:<br />
-14.99% -20.83%<br />
3-m<strong>on</strong>th change: -23.62%<br />
-13.78% -23.99%<br />
Bulgaria<br />
Currency: Lithuanian<br />
Turkey<br />
Currency:<br />
litas<br />
Bulgarian lev<br />
China<br />
Currency: Turkish lira<br />
Japan<br />
3-m<strong>on</strong>th<br />
3-m<strong>on</strong>th<br />
change:<br />
change:<br />
Kuwait<br />
Currency: Chinese yuan<br />
3-m<strong>on</strong>th change:<br />
Currency: Japanese yen<br />
Mexico<br />
-14.72%<br />
-15.10%<br />
Currency: Kuwaiti dinar 3-m<strong>on</strong>th change: 0.12%<br />
-14.73%<br />
3-m<strong>on</strong>th change:<br />
United Arab Emirates<br />
Currency: Mexican peso<br />
3-m<strong>on</strong>th change: India<br />
-6.78%<br />
Currency: U.A.E. dirham<br />
3-m<strong>on</strong>th change:<br />
-1.01%<br />
Currency: Indian rupee<br />
3-m<strong>on</strong>th change: -0.04%<br />
-21.03%<br />
3-m<strong>on</strong>th change:<br />
Venezuela<br />
Currency: Venezuelan<br />
bolivar<br />
3-m<strong>on</strong>th change: 0.00%<br />
Brazil<br />
Currency: Brazilian real<br />
3-m<strong>on</strong>th change:<br />
-30.65%<br />
Argentina<br />
Currency: Argentine<br />
peso<br />
3-m<strong>on</strong>th change:<br />
-6.34%<br />
October 2008<br />
-11.36%<br />
Nigeria<br />
Currency: Nigerian<br />
naira<br />
3-m<strong>on</strong>th change: 0.45% Ind<strong>on</strong>esia<br />
Currency: Ind<strong>on</strong>esian<br />
rupiah<br />
3-m<strong>on</strong>th change: -7.14%<br />
Australia<br />
Currency: Australian<br />
South Africa<br />
dollars<br />
Currency: South African<br />
3-m<strong>on</strong>th change: -32.73%<br />
r<strong>and</strong><br />
3-m<strong>on</strong>th change: -18.12%<br />
New Zeal<strong>and</strong><br />
Currency: New Zeal<strong>and</strong><br />
dollar<br />
3-m<strong>on</strong>th change: -21.10%
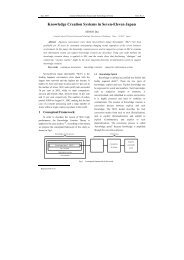
M O N D AY, J A N U A RY 0 5 , 2 0 0 9<br />
The Disappearing M<strong>on</strong>ey Multiplier<br />
Ec<strong>on</strong> prof Bill Seyfried of Rollins College:<br />
The M1 m<strong>on</strong>ey multiplier just slipped below 1. So each $1 increase in reserves (m<strong>on</strong>etary base) results in <strong>the</strong> m<strong>on</strong>ey supply<br />
increasing by $0.95 (OK, so banks have substantially increased <strong>the</strong>ir holding of excess reserves while <strong>the</strong> M1 m<strong>on</strong>ey supply<br />
5<br />
hasn't changed by much).
St<strong>and</strong>ard claim: The current financial crisis in <strong>the</strong> United States has its<br />
roots in falling real estate values. It is based <strong>on</strong> a number of studies<br />
that have shown a str<strong>on</strong>g link between house price depreciati<strong>on</strong> <strong>and</strong><br />
defaults <strong>on</strong> residential mortgages (Doms, Furl<strong>on</strong>g, <strong>and</strong> Krainer 2007).<br />
6
The illusi<strong>on</strong>ary “PERPETUAL MONEY MACHINE”<br />
rate of profit<br />
savings<br />
c<strong>on</strong>sumpti<strong>on</strong><br />
wages<br />
Rate of profit <strong>and</strong> rate of<br />
accumulati<strong>on</strong>: The United States +<br />
European Uni<strong>on</strong> + Japan<br />
* Rate of accumulati<strong>on</strong> = rate of<br />
growth rate of <strong>the</strong> net volume of<br />
capital * Rate of profit = profit/<br />
capital (base: 100 in 2000)<br />
Sources <strong>and</strong> data of <strong>the</strong> graphs:<br />
http://huss<strong>on</strong>et.free.fr/<br />
toxicap.xls<br />
Thee gap widens between <strong>the</strong> share<br />
o f w a g e s a n d t h e s h a r e o f<br />
c<strong>on</strong>sumpti<strong>on</strong> (gray z<strong>on</strong>es), so as to<br />
compensate for <strong>the</strong> difference<br />
between profit <strong>and</strong> accumulati<strong>on</strong>.<br />
FINANCE allows increasing debt <strong>and</strong><br />
virtual wealth growh... which can<br />
<strong>on</strong>ly be transitory (even if very<br />
l<strong>on</strong>g).<br />
United States Share of wages <strong>and</strong> of<br />
private c<strong>on</strong>sumpti<strong>on</strong> in Gross<br />
Domestic Product (GDP)<br />
Source of data <strong>and</strong> graphics: 7 http://<br />
huss<strong>on</strong>et.free.fr/toxicap.xls
The illusi<strong>on</strong>ary “PERPETUAL MONEY MACHINE”<br />
Dow J<strong>on</strong>es<br />
Household<br />
Wealth<br />
source: 8 Michel Huss<strong>on</strong>
The illusi<strong>on</strong>ary “PERPETUAL MONEY MACHINE”<br />
• An ec<strong>on</strong>omy which grows at 2 or 3 per cent cannot<br />
provide a universal profit of 15 per cent, as some<br />
managers of equities claim <strong>and</strong> many investors dream of.<br />
• As l<strong>on</strong>g as <strong>the</strong> incomes drawn from financial assets are<br />
re-invested, <strong>the</strong> fortunes increase independently of any<br />
material link with <strong>the</strong> real sphere <strong>and</strong> <strong>the</strong> variati<strong>on</strong> can<br />
potentially become infinite.<br />
• <strong>Financial</strong> assets represent <strong>the</strong> right to a share of <strong>the</strong><br />
surplus value that is produced. As l<strong>on</strong>g as this right is not<br />
exercised, it remains virtual. But as so<strong>on</strong> as any<strong>on</strong>e<br />
exercises it, <strong>the</strong>y discover that it is subject to <strong>the</strong> law of<br />
value, which means, quite simply, that you cannot<br />
distribute more real wealth than is produced.<br />
9
A 15y History of <strong>the</strong> 2008 crisis<br />
• The ITC “new ec<strong>on</strong>omy” bubble (1995-2000)<br />
• Slaving of <strong>the</strong> Fed m<strong>on</strong>etary policy to <strong>the</strong><br />
stock market descent (2000-2003)<br />
• Real-estate bubbles (2003-2006)<br />
• MBS, CDOs bubble (2004-2007) <strong>and</strong> stock<br />
market bubble (2004-2007)<br />
• Commodities <strong>and</strong> Oil bubbles (2006-2008)<br />
C<strong>on</strong>sequences (deep loss of trust, systemic<br />
instability)<br />
• Soluti<strong>on</strong>?<br />
10
Internet stocks<br />
The Internet stock index <strong>and</strong> n<strong>on</strong>-<br />
Internet stock index which are<br />
equally weighted. Comparis<strong>on</strong> of<br />
index levels of <strong>the</strong> Internet index<br />
<strong>and</strong> <strong>the</strong> n<strong>on</strong>-Internet Stock index,<br />
<strong>and</strong> <strong>the</strong> Nasdaq composite index for<br />
<strong>the</strong> period 1/2/1998-12/31/2002. The<br />
two indexes are scaled to be 100 <strong>on</strong><br />
1/2/1998.<br />
n<strong>on</strong>-Internet stocks
•1995-2000: growing divergence between New Ec<strong>on</strong>omy <strong>and</strong> Old<br />
Ec<strong>on</strong>omy stocks, between technology <strong>and</strong> almost everything else.<br />
•Over 1998 <strong>and</strong> 1999, stocks in <strong>the</strong> St<strong>and</strong>ard & Poor’s technology<br />
sector rose nearly fourfold, while <strong>the</strong> S&P 500 index gained just<br />
50%. And without technology, <strong>the</strong> benchmark would be flat.<br />
•In January 2000 al<strong>on</strong>e, 30% of net inflows into mutual funds went<br />
to science <strong>and</strong> technology funds, versus just 8.7% into S&P 500<br />
index funds.<br />
•The average price-over-earnings ratio (P/E) for Nasdaq<br />
companies was above 200.<br />
•New Ec<strong>on</strong>omy was also hot in <strong>the</strong> minds <strong>and</strong> mouths of investors<br />
in <strong>the</strong> 1920s <strong>and</strong> in <strong>the</strong> early 1960s. In 1929, it was utilities; in<br />
1962, it was <strong>the</strong> electr<strong>on</strong>ic sector.<br />
12
“New Ec<strong>on</strong>omy”: ICT<br />
13
Foreign capital inflow<br />
14
EXPECTATIONS of str<strong>on</strong>g future growth<br />
•better business models (small required<br />
capital, reduced delay in payments…)<br />
•<strong>the</strong> network effect (positive returns <strong>and</strong><br />
positive feedbacks)<br />
•first-to-scale advantages<br />
•real opti<strong>on</strong>s (value of fast adaptati<strong>on</strong> to grasp<br />
new opportunities)<br />
Probably true… but problem of timing…<br />
15
A 15y History of <strong>the</strong> 2008 crisis<br />
• The ITC “new ec<strong>on</strong>omy” bubble (1995-2000)<br />
• Slaving of <strong>the</strong> Fed m<strong>on</strong>etary policy to <strong>the</strong><br />
stock market descent (2000-2003)<br />
• Real-estate bubbles (2003-2006)<br />
• MBS, CDOs bubble (2004-2007)<br />
• Commodities <strong>and</strong> Oil bubbles (2006-2008)<br />
• C<strong>on</strong>sequences (deep loss of trust, systemic<br />
instability)<br />
• Soluti<strong>on</strong>s?<br />
16
Growth of M<strong>on</strong>ey supply (M1)<br />
17
Causal slaving of <strong>the</strong> US Treasury B<strong>on</strong>d yields to <strong>the</strong> stock market<br />
18
“SLAVING OF THE FED TO THE STOCK MARKET<br />
Comparis<strong>on</strong> of <strong>the</strong> Federal funds rate, <strong>the</strong> S&P 500 Index x(t), <strong>and</strong> <strong>the</strong> NASDAQ composite z(t),<br />
from 1999 to mid-2003. To allow a illustrative visual comparis<strong>on</strong>, <strong>the</strong> indices have been<br />
translated <strong>and</strong> scaled as follows: x → 5x − 34 <strong>and</strong> z → 10z − 67.<br />
19
Causal Slaving of <strong>the</strong><br />
U.S. Treasury B<strong>on</strong>d Yield<br />
by <strong>the</strong> Stock Market<br />
Antibubble of August<br />
2000<br />
W.-X. Zhou <strong>and</strong> D. Sornette, Physica A 337, 586-608 (2004)<br />
Cross-correlati<strong>on</strong> coefficient C(n) between <strong>the</strong> increments of <strong>the</strong> logarithm of <strong>the</strong><br />
S&P 500 Index <strong>and</strong> <strong>the</strong> increments of <strong>the</strong> Federal funds rate as a functi<strong>on</strong> of time lag n in days. The<br />
three curves corresp<strong>on</strong>ds to three different time steps used to calculate <strong>the</strong> increments: weekly, m<strong>on</strong>thly <strong>and</strong><br />
quarterly. A positive lag n corresp<strong>on</strong>ds to having <strong>the</strong> Federal funds rate posterior to <strong>the</strong> stock market. 20
A 15y History of <strong>the</strong> 2008 crisis<br />
• The ITC “new ec<strong>on</strong>omy” bubble (1995-2000)<br />
• Slaving of <strong>the</strong> Fed m<strong>on</strong>etary policy to <strong>the</strong><br />
stock market descent (2000-2003)<br />
• Real-estate bubbles (2003-2006)<br />
• MBS, CDOs bubble (2004-2007)<br />
• Commodities <strong>and</strong> Oil bubbles (2006-2008)<br />
• C<strong>on</strong>sequences (deep loss of trust, systemic<br />
instability)<br />
• Soluti<strong>on</strong>s?<br />
21
Real-estate bubbles<br />
22
Real-estate bubble (USA)<br />
Data source: Federal Reserve Bank of St. Louis – FRED<br />
Total new privately-owned housing starts <strong>and</strong> new <strong>on</strong>e-family houses sold in <strong>the</strong> U.S<br />
(in ‘000). January 1990 – June 2008 series
Real-estate in <strong>the</strong> UK<br />
24
Real-estate in <strong>the</strong> USA<br />
25
(2005)<br />
And this with <strong>the</strong> median household income in San Mateo County of ~$70,000. With 20% down, <strong>the</strong> mortgage<br />
for a "starter" $1M house would be 11-12 times <strong>the</strong> median income. Even if <strong>on</strong>e were "buying up" to <strong>on</strong>e of <strong>the</strong>se houses,<br />
say, with equity of 50%, <strong>the</strong> mortgage/median income ratio would be 7:1!!!<br />
From late '02 <strong>and</strong> early '03 to date--<strong>the</strong> bubbliest phase--<strong>the</strong> value of <strong>the</strong> property below is estimated to have more than DOUBLED,<br />
peaking at an estimated $1.16M in summer-fall '05, an annualized increase in value of ~14% from '96. However, before <strong>the</strong> <strong>on</strong>e<br />
order of magnitude of exp<strong>on</strong>ential growth of <strong>the</strong> bubble commenced in late '02, <strong>the</strong> rate of growth of <strong>the</strong> value of this property<br />
was ~6.9%/yr. Were <strong>the</strong> value to regress to <strong>the</strong> pre-bubble trend, <strong>the</strong> estimated value would be $620,000-$820,000 over <strong>the</strong><br />
course of <strong>the</strong> next 4 years or a 30% to 40-45% nominal decline <strong>and</strong> -11% to -18%/yr. in real terms (at <strong>the</strong> trend 2.7% CPI).<br />
26
Our study in 2005<br />
identifies <strong>the</strong> bubble<br />
states<br />
Fall 2007<br />
27
B-F<br />
Over <strong>the</strong> past decade <strong>and</strong> a half, (B - F) has been closely correlated with realized capital<br />
gains <strong>on</strong> <strong>the</strong> sale of homes.<br />
Alan Greenspan <strong>and</strong> James Kennedy (Nov. 2005)<br />
28
29<br />
This graph shows <strong>the</strong> year-over-year price changes for <strong>the</strong> Case-Shiller composite 10 <strong>and</strong> 20 indices<br />
(through February), <strong>and</strong> <strong>the</strong> Case-Shiller <strong>and</strong> OFHEO Nati<strong>on</strong>al price indices (through Q4 2007).
A 15y History of <strong>the</strong> 2008 crisis<br />
• The ITC “new ec<strong>on</strong>omy” bubble (1995-2000)<br />
• Slaving of <strong>the</strong> Fed m<strong>on</strong>etary policy to <strong>the</strong><br />
stock market descent (2000-2003)<br />
• Real-estate bubbles (2003-2006)<br />
• MBS, CDOs bubble (2004-2007)<br />
• Commodities <strong>and</strong> Oil bubbles (2006-2008)<br />
• C<strong>on</strong>sequences (deep loss of trust, systemic<br />
instability)<br />
• Soluti<strong>on</strong>s?<br />
30
Securitisati<strong>on</strong> model<br />
31
Key Players <strong>and</strong> Fricti<strong>on</strong>s in Subprime Mortgage Credit Securitizati<strong>on</strong><br />
33
Securitizati<strong>on</strong> of n<strong>on</strong>-financial assets<br />
(commodities, real-estate, credit)<br />
34
Estimated assets <strong>and</strong> market positi<strong>on</strong>s in<br />
<strong>the</strong> hedge-fund industry from 1990 to 2008<br />
Securitizati<strong>on</strong> of n<strong>on</strong>-financial assets<br />
(commodities, real-estate, credit)<br />
Source: A. Huesler <strong>and</strong> D. Sornette<br />
Lo, A. W. Hedge funds, systemic risk, <strong>and</strong> <strong>the</strong> financial crisis of 2007- 2008: Written testim<strong>on</strong>y for <strong>the</strong> house oversight<br />
committee hearing <strong>on</strong> hedge funds. Social Science Research Network Working Paper Series (November 2008). 35
ubble peaking in Oct. 2007<br />
36<br />
Source: R. Woodard (FCO, ETH Zurich)
A 15y History of <strong>the</strong> 2008 crisis<br />
• The ITC “new ec<strong>on</strong>omy” bubble (1995-2000)<br />
• Slaving of <strong>the</strong> Fed m<strong>on</strong>etary policy to <strong>the</strong><br />
stock market descent (2000-2003)<br />
• Real-estate bubbles (2003-2006)<br />
• MBS, CDOs bubble (2004-2007)<br />
• Commodities <strong>and</strong> Oil bubbles (2006-2008)<br />
• C<strong>on</strong>sequences (deep loss of trust, systemic<br />
instability)<br />
• Soluti<strong>on</strong>s?<br />
37
CORN GOLD<br />
SOYBEAN<br />
R.Woodard <strong>and</strong> D.Sornette (2008)<br />
WHEAT<br />
source: R. Woodard<br />
38
2006-2008 Oil bubble<br />
Speculati<strong>on</strong> vs supply-dem<strong>and</strong><br />
D. Sornette, R.<br />
Woodard <strong>and</strong> W.-X.<br />
Zhou, The<br />
2006-2008 Oil<br />
Bubble <strong>and</strong> Bey<strong>on</strong>d,<br />
Physica A 388,<br />
1571-1576 (2009)<br />
(arXiv.org/abs/<br />
0806.1170)<br />
Typical result of <strong>the</strong> calibrati<strong>on</strong> of <strong>the</strong> simple LPPL model to <strong>the</strong> oil price in US$ in shrinking windows<br />
39<br />
with starting dates tstart moving up towards <strong>the</strong> comm<strong>on</strong> last date tlast = May 27, 2008.
40<br />
Source: R. Woodard (FCO, ETH Zurich)
41<br />
Source: R. Woodard (FCO, ETH Zurich)
In summary<br />
Each excess is partially “solved” by <strong>the</strong> subsequent<br />
excess... leading to a successi<strong>on</strong> of<br />
-unsustainable wealth growth<br />
-instabilities<br />
The present crisis+recessi<strong>on</strong> is <strong>the</strong> c<strong>on</strong>solidati<strong>on</strong><br />
after this series of unsustainable excesses.<br />
One could c<strong>on</strong>clude that <strong>the</strong> extraordinary severity<br />
of this crisis is not going to be solved by <strong>the</strong> same<br />
of implicit or explicit “bubble thinking”.<br />
"The problems that we have created cannot be solved at <strong>the</strong> level of<br />
thinking that created <strong>the</strong>m." Albert Einstein<br />
42
Recessi<strong>on</strong>-Plagued Nati<strong>on</strong> Dem<strong>and</strong>s New Bubble To Invest In<br />
The Oni<strong>on</strong>, JULY 14, 2008 | ISSUE 44•29 (satirical american journal)<br />
"Every American family deserves a false sense of security," said Chris Reppto, a risk analyst for Citigroup in New York.<br />
"Once we have a bubble to provide a fragile foundati<strong>on</strong>, we can begin building pyramid scheme <strong>on</strong> top of pyramid<br />
scheme, <strong>and</strong> before we know it, <strong>the</strong> financial situati<strong>on</strong> will return to normal."<br />
43
A 15y History of <strong>the</strong> 2008 crisis<br />
• The ITC “new ec<strong>on</strong>omy” bubble (1995-2000)<br />
• Slaving of <strong>the</strong> Fed m<strong>on</strong>etary policy to <strong>the</strong><br />
stock market descent (2000-2003)<br />
• Real-estate bubbles (2003-2006)<br />
• MBS, CDOs bubble (2004-2007)<br />
• Commodities <strong>and</strong> Oil bubbles (2006-2008)<br />
• C<strong>on</strong>sequences (deep loss of trust, systemic<br />
instability)<br />
• Soluti<strong>on</strong>s?<br />
44
Separati<strong>on</strong> of financial <strong>and</strong> credit risks<br />
pdf<br />
Securitizati<strong>on</strong> leads to larger inter-c<strong>on</strong>nectivity<br />
pdf<br />
risks risks<br />
45
THE GREAT MODERATION<br />
This figure shows <strong>the</strong> rolling 10-year average real GDP growth rate al<strong>on</strong>g with <strong>on</strong>e-st<strong>and</strong>ard deviati<strong>on</strong> b<strong>and</strong>s. These<br />
st<strong>and</strong>ard deviati<strong>on</strong> b<strong>and</strong>s provide a sense of how much variati<strong>on</strong> or volatility <strong>the</strong>re has been around <strong>the</strong> 10-year average<br />
real GDP growth rate. The figure shows a marked decline in <strong>the</strong> real GDP volatility beginning around 1983.<br />
46
Stress drop (coupling strength)<br />
10<br />
1<br />
0.1<br />
0.01<br />
PERIODIC +<br />
SYNCHRONIZED +<br />
(Sornette et al.,<br />
LARGE RISKS<br />
* 1994)<br />
+ +<br />
+<br />
+<br />
*<br />
+<br />
(Ben-Zi<strong>on</strong>, Dahmen<br />
*<br />
*<br />
et al., 1998)<br />
SELF-ORGANIZED CRITICALITY<br />
* * *<br />
0.001 0.001 0.01 0.1 1 10<br />
Coexistence of SOC<br />
<strong>and</strong> Synchr<strong>on</strong>ized<br />
behavior<br />
Heterogeneity<br />
Rupture thresholds<br />
“Phase diagram” for <strong>the</strong> model in <strong>the</strong> space (heterogeneity, stress drop).<br />
Crosses (+) corresp<strong>on</strong>d to systems which exhibit a periodic time evoluti<strong>on</strong>.<br />
Stars * corresp<strong>on</strong>ds to systems that are self-organized critical, with a<br />
Gutenberg-Richter earthquake size distributi<strong>on</strong> <strong>and</strong> fault localizati<strong>on</strong> whose<br />
geometry is well-described by <strong>the</strong> geometry of r<strong>and</strong>om directed polymers.
A 15y History of <strong>the</strong> 2008 crisis<br />
• The ITC “new ec<strong>on</strong>omy” bubble (1995-2000)<br />
• Slaving of <strong>the</strong> Fed m<strong>on</strong>etary policy to <strong>the</strong><br />
stock market descent (2000-2003)<br />
• Real-estate bubbles (2003-2006)<br />
• MBS, CDOs bubble (2004-2007)<br />
• Commodities <strong>and</strong> Oil bubbles (2006-2008)<br />
• C<strong>on</strong>sequences (deep loss of trust, systemic<br />
instability)<br />
• Soluti<strong>on</strong>s?<br />
48
• Fundamental error: “perpetual m<strong>on</strong>ey machine”<br />
• Encouraging over-spending to solve a crisis due<br />
to over-spending?<br />
• Melting <strong>the</strong> cash-flow freeze (ex: WIR direct<br />
network banking in Switzerl<strong>and</strong> (www.wir.ch))<br />
• L<strong>on</strong>g-term growth based <strong>on</strong> returning to<br />
fundamentals<br />
• Novel opportunities for innovati<strong>on</strong> <strong>and</strong> Earth<br />
sustainability<br />
• Preventing o<strong>the</strong>r financial bubbles: a new<br />
definiti<strong>on</strong> of inflati<strong>on</strong><br />
• Over-pessimism following over-optimism<br />
49
• Intelligence of <strong>the</strong> crowd: general loss of trust<br />
can be restored by removing uncertainty<br />
through frank clarificati<strong>on</strong><br />
• Fight moral hazard (ex: clawback permissi<strong>on</strong>...)<br />
• Regulati<strong>on</strong>s (illusi<strong>on</strong> of c<strong>on</strong>trol <strong>and</strong> <strong>the</strong> law of<br />
unintended c<strong>on</strong>sequences)<br />
• Development of culture of integrity <strong>and</strong> ethical<br />
behavior (informed by behavioral psychology)<br />
• “Robust Investment” approach (W. Buffet)<br />
• The overgrowth of <strong>the</strong> “financial ec<strong>on</strong>omy”<br />
versus <strong>the</strong> “real ec<strong>on</strong>omy”<br />
• <strong>Financial</strong> Ratio Index (FRI) (total fixed assets + working<br />
capital, excess supply of m<strong>on</strong>ey...) : extend definiti<strong>on</strong> of INFLATION<br />
50
Main Messages<br />
• Do excesses exist? <strong>Financial</strong> bubbles?<br />
• Why are <strong>the</strong>y so difficult to identify?<br />
(academic view vs. practiti<strong>on</strong>ers vs Fed)<br />
• Real-estate bubble <strong>and</strong> MBS bubble<br />
• Why are <strong>the</strong>y dangerous? <str<strong>on</strong>g>System</str<strong>on</strong>g>ic risks<br />
• What can be d<strong>on</strong>e? Better metrics vs.<br />
moral hazard <strong>and</strong> herding<br />
Predicti<strong>on</strong>s <strong>and</strong> Preparati<strong>on</strong>: complexity <strong>the</strong>ory applied<br />
to such collective processes provides clues for<br />
precursors <strong>and</strong> suggests steps for precauti<strong>on</strong> <strong>and</strong><br />
51<br />
preparati<strong>on</strong>.