MARKET PRICES AND COSTS SUMMARY Q32011 Q32011 2009 2010 2011 Q32010 Q22011 These indices should only be used as indicators of trends and they Average Average Average Average Average Average Average Average Average Average might be different than our actual selling prices or purchasing Q1 Q2 Q3 Q4 Q1 Q2 Q3 costs. Selling prices (unit) (%) (unit) (%) <strong>Cascades</strong> North American US$ index (index 2005 = 1,000) PACKAGING Boxboard North America (US$/ton) 1,109 1,106 1,180 1,223 1,234 1,186 1,238 1,250 1,264 1,251 41 3% 14 1% Recycled boxboard - 20pt. Clay coated news (transaction) Europe (Euro/tonne) 754 790 825 843 855 828 880 917 920 906 77 9% 3 0% Recycled white-lined chipboard (GD2) index 592 580 631 656 690 639 690 716 716 707 60 9% 0 0% Virgin coated duplex boxboard (GC2) index Containerboard (US$/ton) 985 976 1,025 1,063 1,155 1,055 1,155 1,151 1,152 1,153 89 8% 1 0% Linerboard 42-lb. unbleached kraft, East US (transaction) 547 580 640 640 640 625 640 640 640 640 0 0% 0 0% Corrugating medium 26-lb. Semichemical, East U.S. (transaction) Specialty products (US$/ton, tonne for deinked pulp) 517 550 610 610 610 595 610 610 610 610 0 0% 0 0% Recycled boxboard - 20pt. Bending chip (transaction) 565 575 625 625 650 619 667 675 670 671 45 7% -5 -1% <strong>De</strong>inked pulp (f.o.b; U.S. air-dried & wet-lap, post-consumer) 601 708 752 755 755 743 748 768 812 776 57 8% 44 6% Unbleached kraft paper, Grocery bag 30-lb. 926 960 1,020 1,047 1,060 1,022 1,025 1,093 1,110 1,076 63 6% 17 2% Uncoated white 50-lb. offset, rolls TISSUE PAPERS 855 868 917 938 933 914 930 955 947 944 9 1% -8 -1% <strong>Cascades</strong> Tissue papers (index 1999 = 1,000) Raw materials 1,617 1,617 1,623 1,615 1,620 1,619 1,631 1,662 1,718 1,685 103 6% 56 3% <strong>Cascades</strong> North American US$ index (index 2005 = 300) RECYCLED PAPER North America (US$/ton) 258 426 409 397 452 421 470 492 512 491 115 29% 20 4% Corrugated containers, no. 11 (New England) 68 149 146 131 170 149 182 178 179 180 48 37% 1 1% Special news, no. 8 (ONP - Chicago & NY average) 56 90 92 78 95 88 128 139 135 134 57 73% -4 -3% Sorted office papers, no. 37 (SOP - Chicago & NY average) Europe (Euro/tonne) 120 225 198 218 216 214 223 263 283 256 65 30% 20 8% Recovered paper index VIRGIN PULP (US$/tonne) 53 100 120 126 132 120 146 158 147 151 21 17% -11 -7% Bleached softwood kraft Northern, East U.S. 718 880 993 1 000 967 960 970 1 027 993 997 -7 -1% -34 -3% Bleached hardwood kraft Northern mixed, East U.S. 609 776 908 900 840 856 820 850 823 831 -77 -9% -27 -3% WOODCHIPS – Conifer eastern Canada (US$/odmt) 121 125 121 120 124 123 123 125 125 124 5 4% 0 0% Sources: RISI, Dow Jones, Random Lengths and <strong>Cascades</strong>. Change 20
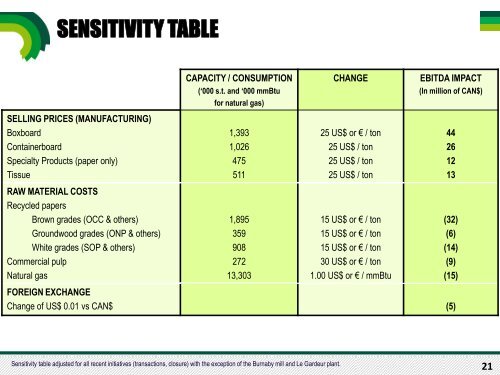
SENSITIVITY TABLE SELLING PRICES (MANUFACTURING) Boxboard Containerboard Specialty Products (paper only) Tissue RAW MATERIAL COSTS Recycled papers Brown grades (OCC & others) Groundwood grades (ONP & others) White grades (SOP & others) Commercial pulp Natural gas FOREIGN EXCHANGE Change of US$ 0.01 vs CAN$ CAPACITY / CONSUMPTION („000 s.t. and „000 mmBtu for natural gas) 1,393 1,026 475 511 1,895 359 908 272 13,303 Sensitivity table adjusted for all recent initiatives (transactions, closure) with the exception of the Burnaby mill and Le Gardeur plant. CHANGE EBITDA IMPACT 25 US$ or € / ton 25 US$ / ton 25 US$ / ton 25 US$ / ton 15 US$ or € / ton 15 US$ or € / ton 15 US$ or € / ton 30 US$ or € / ton 1.00 US$ or € / mmBtu (In million of CAN$) 44 26 12 13 (32) (6) (14) (9) (15) (5) 21