AnnuAl report 2010 - Walter Meier
AnnuAl report 2010 - Walter Meier
AnnuAl report 2010 - Walter Meier

Create successful ePaper yourself
Turn your PDF publications into a flip-book with our unique Google optimized e-Paper software.
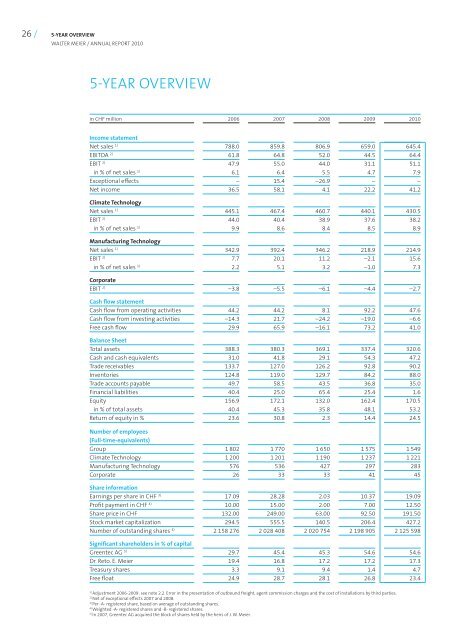
26 / 5-year oVerVieW<br />
WAlter meier / <strong>AnnuAl</strong> <strong>report</strong> <strong>2010</strong><br />
5-yeAr oVerVieW<br />
in CHF million 2006 2007 2008 2009 <strong>2010</strong><br />
income statement<br />
net sales 1) 788.0 859.8 806.9 659.0 645.4<br />
eBitdA 2) 61.8 64.8 52.0 44.5 64.4<br />
eBit 2) 47.9 55.0 44.0 31.1 51.1<br />
in % of net sales 1) 6.1 6.4 5.5 4.7 7.9<br />
exceptional effects – 15.4 –26.9 – –<br />
net income 36.5 58.1 4.1 22.2 41.2<br />
Climate technology<br />
net sales 1) 445.1 467.4 460.7 440.1 430.5<br />
eBit 2) 44.0 40.4 38.9 37.6 38.2<br />
in % of net sales 1) 9.9 8.6 8.4 8.5 8.9<br />
manufacturing technology<br />
net sales 1) 342.9 392.4 346.2 218.9 214.9<br />
eBit 2) 7.7 20.1 11.2 –2.1 15.6<br />
in % of net sales 1) 2.2 5.1 3.2 –1.0 7.3<br />
Corporate<br />
eBit 2) –3.8 –5.5 –6.1 –4.4 –2.7<br />
Cash flow statement<br />
Cash flow from operating activities 44.2 44.2 8.1 92.2 47.6<br />
Cash flow from investing activities –14.3 21.7 –24.2 –19.0 –6.6<br />
Free cash flow 29.9 65.9 –16.1 73.2 41.0<br />
Balance sheet<br />
total assets 388.3 380.3 369.1 337.4 320.6<br />
Cash and cash equivalents 31.0 41.8 29.1 54.3 47.2<br />
trade receivables 133.7 127.0 126.2 92.8 90.2<br />
inventories 124.8 119.0 129.7 84.2 88.0<br />
trade accounts payable 49.7 58.5 43.5 36.8 35.0<br />
Financial liabilities 40.4 25.0 65.4 25.4 1.6<br />
equity 156.9 172.1 132.0 162.4 170.5<br />
in % of total assets 40.4 45.3 35.8 48.1 53.2<br />
return of equity in % 23.6 30.8 2.3 14.4 24.5<br />
number of employees<br />
(full-time-equivalents)<br />
Group 1 802 1 770 1 650 1 575 1 549<br />
Climate technology 1 200 1 201 1 190 1 237 1 221<br />
manufacturing technology 576 536 427 297 283<br />
Corporate 26 33 33 41 45<br />
share information<br />
earnings per share in CHF 3) 17.09 28.28 2.03 10.37 19.09<br />
profit payment in CHF 4) 10.00 15.00 2.00 7.00 12.50<br />
Share price in CHF 132.00 249.00 63.00 92.50 191.50<br />
Stock market capitalization 294.5 555.5 140.5 206.4 427.2<br />
number of outstanding shares 4) 2 158 276 2 028 408 2 020 754 2 198 905 2 125 598<br />
significant shareholders in % of capital<br />
Greentec AG 5) 29.7 45.4 45.3 54.6 54.6<br />
dr. reto. e. meier 19.4 16.8 17.2 17.2 17.3<br />
treasury shares 3.3 9.1 9.4 1.4 4.7<br />
Free float 24.9 28.7 28.1 26.8 23.4<br />
1) Adjustment 2006-2009: see note 2.2. error in the presentation of outbound freight, agent commission charges and the cost of installations by third parties.<br />
2) net of exceptional effects 2007 and 2008.<br />
3) per -A- registered share, based on average of outstanding shares.<br />
4) Weighted -A- registered shares and -B- registered shares.<br />
5) in 2007, Greentec AG acquired the block of shares held by the heirs of J. W. meier.