Quantifying saline groundwater seepage to surface waters in the ...
Quantifying saline groundwater seepage to surface waters in the ...
Quantifying saline groundwater seepage to surface waters in the ...

You also want an ePaper? Increase the reach of your titles
YUMPU automatically turns print PDFs into web optimized ePapers that Google loves.
6 S. Jasechko et al. / Applied Geochemistry xxx (2012) xxx–xxx<br />
Sal<strong>in</strong>e GW as proportion<br />
of river discharge (%)<br />
Sal<strong>in</strong>e GW discharge (L s -1 )<br />
10 1<br />
10<br />
10 0<br />
1<br />
10 -1<br />
0.1<br />
10 -2<br />
10 -3<br />
10 -4<br />
10000<br />
1000<br />
100<br />
10<br />
1<br />
0.1<br />
(a)<br />
1999<br />
1987 2010 1987 2010 1987 2010<br />
87 88 89 90 91 92 93 94 95 96 97 98 99 00 01 03 02 04 05 06 07 08 09 87 10 88 89 90 91 92 93 94 95 96 97 98 99 00 01 03 02 04 05 06 07 08 09 87 10 88 89 90 91 92 93 94 95 96 97 98 99 00 01 03 02 04 05 06 07 08 09 10<br />
(b)<br />
1999<br />
CONTROL REACH CONTROL REACH<br />
CONTROL REACH CONTROL REACH<br />
1987 2010 1987 2010 1987 2010<br />
H<strong>in</strong><strong>to</strong>n <strong>to</strong><br />
Town<br />
of<br />
Athabasca<br />
Athabasca <strong>to</strong> Ft. McMurray Ft.<br />
McMurray<br />
<strong>to</strong><br />
Old<br />
Fort<br />
87 88 89 90 91 92 93 94 95 96 97 98 00 99 01 02 03 04 05 06 08 07 09 10 87 88 89 90 91 92 93 94 95 96 98 97 99 00 01 02 03 04 06 05 07 08 09 10 87 88 89 90 91 92 93 94 95 96 98 97 99 00 01 02 03 04 06 05 07 08 09 10<br />
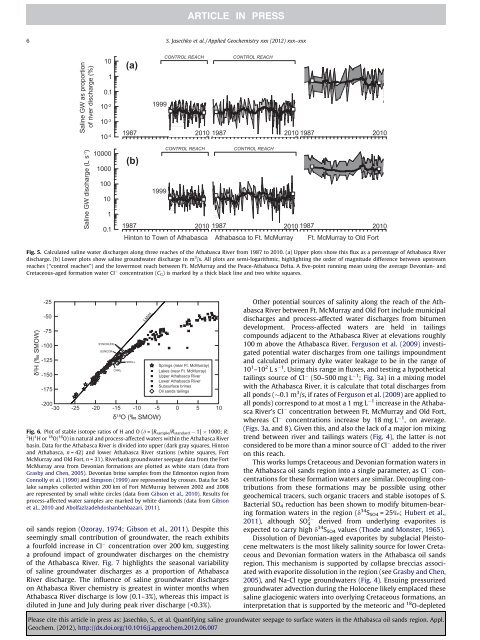
Fig. 5. Calculated <strong>sal<strong>in</strong>e</strong> water discharges along three reaches of <strong>the</strong> Athabasca River from 1987 <strong>to</strong> 2010. (a) Upper plots show this flux as a percentage of Athabasca River<br />
discharge. (b) Lower plots show <strong>sal<strong>in</strong>e</strong> <strong>groundwater</strong> discharge <strong>in</strong> m 3 /s. All plots are semi-logarithmic, highlight<strong>in</strong>g <strong>the</strong> order of magnitude difference between upstream<br />
reaches (‘‘control reaches’’) and <strong>the</strong> lowermost reach between Ft. McMurray and <strong>the</strong> Peace-Athabasca Delta. A five-po<strong>in</strong>t runn<strong>in</strong>g mean us<strong>in</strong>g <strong>the</strong> average Devonian- and<br />
Cretaceous-aged formation water Cl concentration (CG) is marked by a thick black l<strong>in</strong>e and two white squares.<br />
δ 2 H (‰ SMOW)<br />
-25<br />
-50<br />
-75<br />
-100<br />
-125<br />
-150<br />
-175<br />
SYNCRUDE<br />
SUNCOR<br />
CNRL<br />
SHELL<br />
Spr<strong>in</strong>gs (near Ft. McMurray)<br />
Lakes (near Ft. McMurray)<br />
Upper Athabasca River<br />
Lower Athabasca River<br />
Sub<strong>surface</strong> br<strong>in</strong>es<br />
Oil sands tail<strong>in</strong>gs<br />
δ18 -200<br />
-30 -25 -20 -15 -10 -5 0 5 10<br />
O (‰ SMOW)<br />
Fig. 6. Plot of stable iso<strong>to</strong>pe ratios of H and O (d =[R sample/R standard 1] 1000; R:<br />
2 H/ 1 Hor 18 O/ 16 O) <strong>in</strong> natural and process-affected <strong>waters</strong> with<strong>in</strong> <strong>the</strong> Athabasca River<br />
bas<strong>in</strong>. Data for <strong>the</strong> Athabasca River is divided <strong>in</strong><strong>to</strong> upper (dark gray squares, H<strong>in</strong><strong>to</strong>n<br />
and Athabasca, n = 42) and lower Athabasca River stations (white squares, Fort<br />
McMurray and Old Fort, n = 31). Riverbank <strong>groundwater</strong> <strong>seepage</strong> data from <strong>the</strong> Fort<br />
McMurray area from Devonian formations are plotted as white stars (data from<br />
Grasby and Chen, 2005). Devonian br<strong>in</strong>e samples from <strong>the</strong> Edmon<strong>to</strong>n region from<br />
Connolly et al. (1990) and Simpson (1999) are represented by crosses. Data for 345<br />
lake samples collected with<strong>in</strong> 200 km of Fort McMurray between 2002 and 2008<br />
are represented by small white circles (data from Gibson et al., 2010). Results for<br />
process-affected water samples are marked by white diamonds (data from Gibson<br />
et al., 2010 and Abolfazlzadehdoshanbehbazari, 2011).<br />
oil sands region (Ozoray, 1974; Gibson et al., 2011). Despite this<br />
seem<strong>in</strong>gly small contribution of <strong>groundwater</strong>, <strong>the</strong> reach exhibits<br />
a fourfold <strong>in</strong>crease <strong>in</strong> Cl concentration over 200 km, suggest<strong>in</strong>g<br />
a profound impact of <strong>groundwater</strong> discharges on <strong>the</strong> chemistry<br />
of <strong>the</strong> Athabasca River. Fig. 7 highlights <strong>the</strong> seasonal variability<br />
of <strong>sal<strong>in</strong>e</strong> <strong>groundwater</strong> discharges as a proportion of Athabasca<br />
River discharge. The <strong>in</strong>fluence of <strong>sal<strong>in</strong>e</strong> <strong>groundwater</strong> discharges<br />
on Athabasca River chemistry is greatest <strong>in</strong> w<strong>in</strong>ter months when<br />
Athabasca River discharge is low (0.1–3%), whereas this impact is<br />
diluted <strong>in</strong> June and July dur<strong>in</strong>g peak river discharge (