Quantifying saline groundwater seepage to surface waters in the ...
Quantifying saline groundwater seepage to surface waters in the ...
Quantifying saline groundwater seepage to surface waters in the ...

You also want an ePaper? Increase the reach of your titles
YUMPU automatically turns print PDFs into web optimized ePapers that Google loves.
Sal<strong>in</strong>e <strong>groundwater</strong> discharge<br />
(% of Athabasca River discharge)<br />
iso<strong>to</strong>pic compositions of river seeps and <strong>groundwater</strong> samples relative<br />
<strong>to</strong> modern precipitation.<br />
Advection of a denser, more <strong>sal<strong>in</strong>e</strong> <strong>groundwater</strong> <strong>to</strong> <strong>the</strong> <strong>surface</strong><br />
requires a hydrologic gradient directed <strong>to</strong>ward <strong>the</strong> <strong>surface</strong>. The<br />
mechanism for an ‘‘upward’’ hydrogeologic gradient could <strong>in</strong>clude<br />
relict subglacial pressures, or <strong>the</strong> regional <strong>to</strong>pographically-driven<br />
flow system that recharges at higher altitudes <strong>in</strong> <strong>the</strong> Rocky Mounta<strong>in</strong>s.<br />
Moreover, <strong>the</strong> Athabasca, Clearwater and Christ<strong>in</strong>a river <strong>in</strong>cisions<br />
expose aquifers bear<strong>in</strong>g <strong>sal<strong>in</strong>e</strong> <strong>waters</strong> <strong>to</strong> <strong>the</strong> <strong>surface</strong>, <strong>the</strong>reby<br />
aid<strong>in</strong>g <strong>the</strong> discharge of <strong>sal<strong>in</strong>e</strong> formation <strong>waters</strong>. Actual <strong>surface</strong><br />
3.0<br />
2.5<br />
2.0<br />
1.5<br />
1.0<br />
0.5<br />
0.0<br />
Month:<br />
Fort McMurray <strong>to</strong> Old Fort<br />
Athabasca discharge ± 1σ<br />
Sal<strong>in</strong>e GW discharge (%)<br />
1 2 3 4 5 6 7 8 9 10 11 12<br />
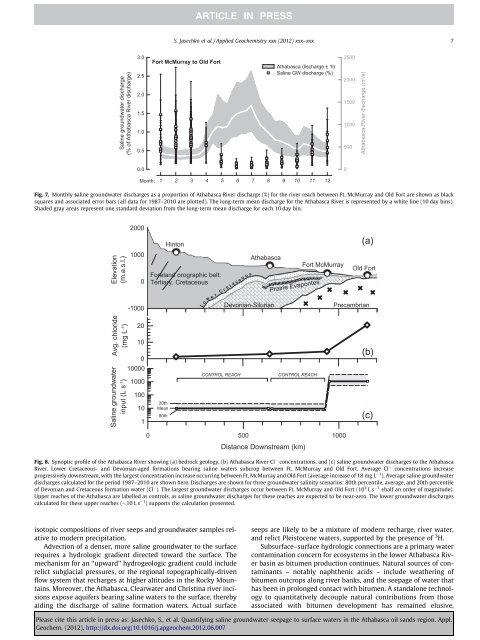
Fig. 7. Monthly <strong>sal<strong>in</strong>e</strong> <strong>groundwater</strong> discharges as a proportion of Athabasca River discharge (%) for <strong>the</strong> river reach between Ft. McMurray and Old Fort are shown as black<br />
squares and associated error bars (all data for 1987–2010 are plotted). The long-term mean discharge for <strong>the</strong> Athabasca River is represented by a white l<strong>in</strong>e (10 day b<strong>in</strong>s).<br />
Shaded gray areas represent one standard deviation from <strong>the</strong> long-term mean discharge for each 10 day b<strong>in</strong>.<br />
Elevation<br />
(m.a.s.l.)<br />
Avg. chloride<br />
(mg L-1 )<br />
Sal<strong>in</strong>e <strong>groundwater</strong><br />
<strong>in</strong>put (L s-1 )<br />
2000<br />
1000<br />
0<br />
-1000<br />
20<br />
10<br />
0<br />
10000<br />
1000<br />
100<br />
10<br />
1<br />
0<br />
H<strong>in</strong><strong>to</strong>n<br />
Foreland orographic belt:<br />
Tertiary, Cretaceous<br />
20th<br />
Mean<br />
80th<br />
S. Jasechko et al. / Applied Geochemistry xxx (2012) xxx–xxx 7<br />
L<br />
Athabasca<br />
Devonian-Silurian<br />
o w e r C r e t a c e o u s<br />
500<br />
Prairie Evaporites<br />
CONTROL REACH CONTROL REACH<br />
Distance Downstream (km)<br />
Fort McMurray<br />
2500<br />
2000<br />
1500<br />
1000<br />
500<br />
0<br />
seeps are likely <strong>to</strong> be a mixture of modern recharge, river water,<br />
and relict Pleis<strong>to</strong>cene <strong>waters</strong>, supported by <strong>the</strong> presence of 3 H.<br />
Sub<strong>surface</strong>–<strong>surface</strong> hydrologic connections are a primary water<br />
contam<strong>in</strong>ation concern for ecosystems <strong>in</strong> <strong>the</strong> lower Athabasca River<br />
bas<strong>in</strong> as bitumen production cont<strong>in</strong>ues. Natural sources of contam<strong>in</strong>ants<br />
– notably naph<strong>the</strong>nic acids – <strong>in</strong>clude wea<strong>the</strong>r<strong>in</strong>g of<br />
bitumen outcrops along river banks, and <strong>the</strong> <strong>seepage</strong> of water that<br />
has been <strong>in</strong> prolonged contact with bitumen. A standalone technology<br />
<strong>to</strong> quantitatively decouple natural contributions from those<br />
associated with bitumen development has rema<strong>in</strong>ed elusive,<br />
Athabasca River discharge (m 3 /s)<br />
Precambrian<br />
1000<br />
(a)<br />
Old Fort<br />
Fig. 8. Synoptic profile of <strong>the</strong> Athabasca River show<strong>in</strong>g (a) bedrock geology, (b) Athabasca River Cl concentrations, and (c) <strong>sal<strong>in</strong>e</strong> <strong>groundwater</strong> discharges <strong>to</strong> <strong>the</strong> Athabasca<br />
River. Lower Cretaceous- and Devonian-aged formations bear<strong>in</strong>g <strong>sal<strong>in</strong>e</strong> <strong>waters</strong> subcrop between Ft. McMurray and Old Fort. Average Cl concentrations <strong>in</strong>crease<br />
progressively downstream, with <strong>the</strong> largest concentration <strong>in</strong>crease occurr<strong>in</strong>g between Ft. McMurray and Old Fort (average <strong>in</strong>crease of 18 mg L 1 ). Average <strong>sal<strong>in</strong>e</strong> <strong>groundwater</strong><br />
discharges calculated for <strong>the</strong> period 1987–2010 are shown here. Discharges are shown for three <strong>groundwater</strong> sal<strong>in</strong>ity scenarios: 80th percentile, average, and 20th percentile<br />
of Devonian and Cretaceous formation water (Cl ). The largest <strong>groundwater</strong> discharges occur between Ft. McMurray and Old Fort (10 3 Ls 1 ±half an order of magnitude).<br />
Upper reaches of <strong>the</strong> Athabasca are labelled as controls, as <strong>sal<strong>in</strong>e</strong> <strong>groundwater</strong> discharges for <strong>the</strong>se reaches are expected <strong>to</strong> be near-zero. The lower <strong>groundwater</strong> discharges<br />
calculated for <strong>the</strong>se upper reaches ( 10 L s 1 ) supports <strong>the</strong> calculation presented.<br />
Please cite this article <strong>in</strong> press as: Jasechko, S., et al. <strong>Quantify<strong>in</strong>g</strong> <strong>sal<strong>in</strong>e</strong> <strong>groundwater</strong> <strong>seepage</strong> <strong>to</strong> <strong>surface</strong> <strong>waters</strong> <strong>in</strong> <strong>the</strong> Athabasca oil sands region. Appl.<br />
Geochem. (2012), http://dx.doi.org/10.1016/j.apgeochem.2012.06.007<br />
(b)<br />
(c)