Patterns of bioelectrical impedance vector ... - Data-input.de
Patterns of bioelectrical impedance vector ... - Data-input.de
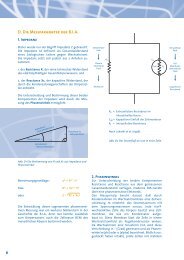
Patterns of bioelectrical impedance vector ... - Data-input.de

Create successful ePaper yourself
Turn your PDF publications into a flip-book with our unique Google optimized e-Paper software.
<strong>Patterns</strong> <strong>of</strong> <strong>bioelectrical</strong> <strong>impedance</strong> <strong>vector</strong> distribution by body<br />
mass in<strong>de</strong>x and age: implications for body-composition analysis 1–3<br />
Anja Bosy-Westphal, Sandra Danielzik, Ralf-Peter Dörhöfer, Antonio Piccoli, and Manfred J Müller<br />
ABSTRACT<br />
Background: Bioelectrical <strong>impedance</strong> analysis (BIA) gives resistance<br />
(R) and reactance (Xc). R and Xc normalized for body height<br />
(H) can be plotted as a bivariate <strong>vector</strong> (H 2 /Xc versus H 2 /R). Vector<br />
BIA is useful for studying the <strong>de</strong>terminants <strong>of</strong> BIA results.<br />
Objective: We investigated the effect <strong>of</strong> age on BIA results and its<br />
relevance to body-composition analysis in a large database <strong>of</strong> <strong>impedance</strong><br />
<strong>vector</strong> distributions stratified by age, sex, and body mass<br />
in<strong>de</strong>x (BMI).<br />
Design: Mean bivariate <strong>vector</strong> distribution patterns (95% confi<strong>de</strong>nce<br />
ellipses) were examined in a German population <strong>of</strong> 15 605<br />
children and adolescents and 213 294 adults. Children and adolescents<br />
were divi<strong>de</strong>d into 3 age groups with up to 5 BMI categories. In<br />
adults, 5 BMI categories were stratified into 7 age groups.<br />
Results: Mean <strong>impedance</strong> <strong>vector</strong>s were shorter in children than in<br />
adults. The <strong>vector</strong> distribution pattern was influenced by sex, BMI,<br />
and age, with shorter <strong>vector</strong>s in females than in males and longer<br />
<strong>vector</strong>s with increasing BMI. Consistent with a <strong>de</strong>crease in body cell<br />
mass with increasing age, there was a downward slope in the mean<br />
<strong>vector</strong> with age as a result <strong>of</strong> a <strong>de</strong>crease in the H 2 /Xc <strong>vector</strong> component.<br />
By contrast, there was no age-<strong>de</strong>pen<strong>de</strong>nt increase in the H 2 /R<br />
<strong>vector</strong> component. In women <strong>of</strong> the same BMI at different ages, H 2 /R<br />
and percentage fat mass ten<strong>de</strong>d to <strong>de</strong>crease with age.<br />
Conclusions: The lack <strong>of</strong> an age-<strong>de</strong>pen<strong>de</strong>nt increase in the H 2 /R<br />
<strong>vector</strong> component ren<strong>de</strong>rs conventional BIA unsuitable for an examination<br />
<strong>of</strong> the age-related increase in body fat mass. By contrast,<br />
the increase in the H 2 /Xc <strong>vector</strong> component with advancing age<br />
suggests the potential <strong>of</strong> BIA to <strong>de</strong>pict the age-related <strong>de</strong>crease in<br />
body cell mass. Am J Clin Nutr 2005;82:60–8.<br />
KEY WORDS Bioelectrical <strong>impedance</strong> analysis, resistance,<br />
reactance, body mass in<strong>de</strong>x, children, adolescents, adults, aging<br />
INTRODUCTION<br />
Vector <strong>bioelectrical</strong> <strong>impedance</strong> analysis (BIA, RXc-graph<br />
method) is a pattern analysis <strong>of</strong> direct <strong>impedance</strong> measurements<br />
(resistance, R, and reactance, Xc) plotted as a bivariate <strong>vector</strong><br />
standardized by the subject’s height (ie, expressing R/H and Xc/H<br />
in /m). This method was <strong>de</strong>scribed as a useful tool for monitoring<br />
hydration status in renal (1–3) and critical care (4) patients,<br />
in the follow-up <strong>of</strong> obese subjects during weight loss (3), and in<br />
infants (5–7). In the clinical setting, the advantages <strong>of</strong> <strong>vector</strong> BIA<br />
are convincing: no algorithms for conversion <strong>of</strong> raw <strong>impedance</strong><br />
data into body-composition compartments are required. Results<br />
are therefore not biased by the choice <strong>of</strong> regression equation, the<br />
accuracy <strong>of</strong> the criterion method, or the selection criteria <strong>of</strong> the<br />
reference population. Because <strong>vector</strong> distribution patterns differ<br />
between men and women and by race or ethnicity and are <strong>de</strong>pen<strong>de</strong>nt<br />
on body mass in<strong>de</strong>x (BMI) and age, national reference<br />
distributions for R and Xc used for body-composition analysis<br />
have been stratified accordingly (8, 9).<br />
Vector distribution patterns reveal the <strong>de</strong>terminants <strong>of</strong> BIA<br />
results; ie, the sex- and BMI-<strong>de</strong>pen<strong>de</strong>ncy <strong>of</strong> BIA results indicate<br />
that equations used for the prediction <strong>of</strong> body composition from<br />
<strong>impedance</strong> measurements need to be validated separately by sex<br />
and BMI classes (9). The age-<strong>de</strong>pen<strong>de</strong>ncy <strong>of</strong> <strong>vector</strong> distribution<br />
has not yet been critically viewed with regard to its relevance to<br />
body-composition analysis.<br />
The present work aimed to investigate <strong>vector</strong> distribution patterns<br />
according to sex, BMI, and age in a large database <strong>of</strong> white<br />
children and adolescents (n 16 237) and adults (n 214 294).<br />
We used a modified version <strong>of</strong> the RXc-graph with the <strong>vector</strong><br />
components H 2 /R and H 2 /Xc to analyze the relevance <strong>of</strong> agerelated<br />
changes in <strong>vector</strong> BIA components for the <strong>de</strong>scription <strong>of</strong><br />
age-related changes in body composition.<br />
SUBJECTS AND METHODS<br />
Subjects were recruited from 524 Precon-centers (commercial<br />
weight-management facilities) and the Kiel Obesity Prevention<br />
Study (KOPS) in Germany. Informed consent was obtained from<br />
all volunteers before participation. In case <strong>of</strong> children, parents<br />
provi<strong>de</strong>d written informed consent. <strong>Data</strong> comprising 10 127 girls<br />
(x SD age: 11.5 3.9 y; range: 6–17 y), 6110 boys (9.5 <br />
3.2 y; 6–17 y), 183 982 women (42.5 13.2 y; 18–102 y), and<br />
30 750 men (44.6 13.5 y; 18–100 y) were collected over a<br />
period <strong>of</strong> 14 y from June 1990 to August 2003. <strong>Data</strong> from 420<br />
girls and 212 boys were omitted because the children’s BMI (in<br />
1 From the Institut für Humanernährung und Lebensmittelkun<strong>de</strong>,<br />
Christian-Albrechts- Universität zu Kiel, Kiel, Germany (AB-W, SD, and<br />
MJM); <strong>Data</strong> Input Company, Darmstadt, Germany (R-PD); and the Department<br />
<strong>of</strong> Medical and Surgical Sciences, University <strong>of</strong> Padova, Padova, Italy<br />
(AP).<br />
2 Supported by a grant from Precon, Darmstadt, Germany.<br />
3 Reprints not available. Address correspon<strong>de</strong>nce to MJ Müller, Institut für<br />
Humanernährung und Lebensmittelkun<strong>de</strong>, Christian-Albrechts-Universität<br />
zu Kiel, Düsternbroker Weg 17, D-24105 Kiel, Germany. E-mail:<br />
mmueller@nutrfoodsc.uni-kiel.<strong>de</strong>.<br />
Received September 14, 2004.<br />
Accepted for publication February 23, 2005.<br />
60 Am J Clin Nutr 2005;82:60–8. Printed in USA. © 2005 American Society for Clinical Nutrition
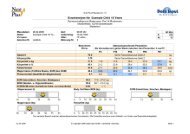
TABLE 1<br />
Impedance <strong>vector</strong> components in 183 176 women by BMI and age classes 1<br />
n Height R Xc H 2 /R H 2 /Xc r<br />
m cm 2 / cm 2 /<br />
BMI 18.5–25<br />
18–19 y 1052 1.68 0.06 624.4 61.7 64.7 8.6 45.71 5.65 444.6 69.4 0.69<br />
20–29 y 8307 1.68 0.06 616.0 60.9 64.3 8.7 46.26 5.64 447.0 71.8 0.71<br />
30–39 y 10162 1.67 0.06 606.1 61.9 63.9 8.5 46.71 5.77 446.9 70.5 0.72<br />
40–49 y 6691 1.66 0.06 601.0 61.2 62.6 8.6 46.21 5.76 447.8 72.8 0.72<br />
50–59 y 3408 1.65 0.06 600.4 60.2 60.2 8.5 45.87 5.59 462.6 76.1 0.69<br />
60–69 y 1106 1.64 0.06 602.0 62.6 57.9 9.3 45.35 5.90 478.1 85.4 0.64<br />
70 y<br />
BMI 25–30<br />
276 1.62 0.06 597.3 65.7 53.4 9.9 44.46 6.50 508.1 105.1 0.59<br />
18–19 y 1129 1.67 0.07 577.8 57.8 61.5 8.5 48.92 5.99 464.5 76.3 0.73<br />
20–29 y 11117 1.67 0.06 578.1 56.5 61.6 8.0 48.92 5.98 462.7 73.7 0.72<br />
30–39 y 18824 1.67 0.06 568.3 56.2 61.3 8.0 49.43 6.04 461.8 73.4 0.73<br />
40–49 y 17090 1.65 0.06 562.4 55.3 59.9 8.0 48.91 5.93 463.2 73.5 0.72<br />
50–59 y 13137 1.64 0.06 560.5 55.6 57.5 8.1 48.65 5.96 479.2 78.5 0.70<br />
60–69 y 5649 1.64 0.06 562.4 55.8 55.0 8.2 48.10 5.98 498.4 84.9 0.67<br />
70 y<br />
BMI 30–35<br />
1124 1.61 0.06 558.4 60.4 51.3 9.1 47.28 6.50 524.3 102.1 0.69<br />
18–19 y 582 1.67 0.06 544.9 53.2 58.1 7.5 51.95 6.34 491.1 74.4 0.72<br />
20–29 y 6507 1.67 0.07 541.7 53.3 58.5 7.5 51.99 6.61 485.4 80.2 0.73<br />
30–39 y 11506 1.66 0.06 529.9 52.4 57.9 7.6 52.78 6.55 486.8 77.7 0.74<br />
40–49 y 12495 1.65 0.06 521.8 52.7 56.3 7.7 52.47 6.60 491.0 79.7 0.72<br />
50–59 y 11817 1.64 0.06 520.5 53.0 53.8 7.7 52.08 6.59 509.7 86.0 0.71<br />
60–69 y 6305 1.62 0.06 522.4 53.7 51.3 7.8 51.09 6.61 527.4 94.1 0.68<br />
70 y<br />
BMI 35–40<br />
1419 1.61 0.06 518.5 58.5 47.9 8.6 50.47 7.20 557.3 111.4 0.73<br />
18–19 y 239 1.68 0.07 506.5 50.1 54.2 7.9 56.11 7.66 530.9 100.6 0.75<br />
20–29 y 2857 1.67 0.07 506.1 52.4 54.9 7.1 55.66 7.39 517.0 86.1 0.75<br />
30–39 y 5064 1.66 0.06 493.2 50.9 53.8 7.1 56.63 7.21 523.6 87.5 0.75<br />
40–49 y 5462 1.64 0.06 484.4 49.2 52.2 7.3 56.33 7.17 528.4 88.9 0.73<br />
50–59 y 5178 1.63 0.07 483.8 50.9 49.8 7.4 55.69 7.43 547.7 97.8 0.72<br />
60–69 y 3090 1.62 0.06 484.2 52.0 47.1 7.8 54.60 7.38 570.6 108.7 0.70<br />
70 y<br />
BMI 40–50<br />
685 1.59 0.06 479.0 53.1 44.0 8.3 53.86 7.44 598.9 120.0 0.66<br />
18–19 y 95 1.67 0.07 469.6 47.2 49.7 6.7 60.15 8.04 572.8 97.9 0.80<br />
20–29 y 1306 1.67 0.07 470.5 49.8 50.6 6.7 59.84 7.89 561.4 94.7 0.74<br />
30–39 y 2537 1.66 0.07 456.0 50.7 49.3 7.0 61.33 8.16 572.5 98.3 0.75<br />
40–49 y 2709 1.64 0.07 443.7 50.0 47.2 7.3 61.61 8.79 586.5 110.1 0.76<br />
50–59 y 2280 1.62 0.06 443.4 49.8 45.1 7.3 60.42 8.56 603.1 117.4 0.77<br />
60–69 y 1274 1.61 0.06 440.5 50.7 42.3 7.3 59.60 8.65 631.4 128.6 0.73<br />
70 y 243 1.58 0.06 443.3 51.0 39.4 7.4 57.21 7.92 659.6 142.4 0.70<br />
1 2 2 2<br />
BMI is in kg/m . R, resistance; Xc, reactance; H, height; r, correlation coefficient between H /R and H /Xc. ANOVA showed significant interactions<br />
between age and BMI categories for both <strong>vector</strong> components (H 2 /R and H 2 /Xc).<br />
kg/m 2 ) excee<strong>de</strong>d the highest age-<strong>de</strong>pen<strong>de</strong>nt BMI category. Likewise,<br />
we exclu<strong>de</strong>d 499 women and 62 men because <strong>of</strong> un<strong>de</strong>rweight<br />
(BMI 18.5) and 761 women and 119 men because <strong>of</strong><br />
severe obesity (BMI 50). Thus, the final study population<br />
consisted <strong>of</strong> 15 605 children and adolescents (age range: 6–17 y)<br />
and 213 294 adults (age range: 18–102 y) who were examined by<br />
a total <strong>of</strong> 530 trained observers. Training <strong>of</strong> the investigators<br />
followed the same manual. All subjects were white, nonpregnant<br />
and nonlactating, and healthy (<strong>de</strong>fined as the absence <strong>of</strong> a clinical<br />
condition that could influence fluid balance, eg, renal, endocrine,<br />
or myocardial disease, as ascertained by participant questionnaire).<br />
There were no further selection criteria.<br />
<strong>Data</strong> were acquired between 0700 and 1200. In the case <strong>of</strong><br />
adults, all subjects were instructed on the importance <strong>of</strong> fasting<br />
overnight before measurement. Fasting was not a precondition<br />
for study participation by children. Body weight was measured to<br />
EFFECT OF AGE ON IMPEDANCE VARIABLES 61<br />
the nearest 0.1 kg and standing height to the nearest 0.5 cm with<br />
the subject in un<strong>de</strong>rwear and without shoes. BMI (kg/m 2 ) was<br />
calculated with weight (kg) and height (m) measurements. A<br />
single tetrapolar BIA measurement <strong>of</strong> resistance (R) and reactance<br />
(Xc) was taken at a fixed frequency <strong>of</strong> 50 kHz between the<br />
right wrist and ankle (standard placement <strong>of</strong> surface electro<strong>de</strong>s)<br />
with a body <strong>impedance</strong> analyzer (BIA 2000-S; <strong>Data</strong> Input,<br />
Frankfurt, Germany) while the subjects were in a supine position<br />
on a nonconductive surface. (See reference 10 for a <strong>de</strong>tailed<br />
<strong>de</strong>scription <strong>of</strong> the measurement procedure.) Mean CVs for<br />
within-day and between-day intraindividual measurements by<br />
the same observer were 2% for R and 3.5% for Xc and 1.5%<br />
for R and 5% for Xc, respectively. The study was approved by<br />
the Ethical Committee <strong>of</strong> the Christian-Albrechts-University <strong>of</strong><br />
Kiel.
62 BOSY-WESTPHAL ET AL<br />
TABLE 2<br />
Impedance <strong>vector</strong> components in 30 572 men by BMI and age classes 1<br />
n Height R Xc H 2 /R H 2 /Xc r<br />
m cm 2 / cm 2 /<br />
BMI 18.5–25<br />
18–19 y 115 1.82 0.07 511.3 53.9 61.0 8.4 65.64 8.46 555.8 95.1 0.70<br />
20–29 y 614 1.82 0.07 510.1 54.8 61.4 7.9 65.51 9.04 547.7 91.3 0.75<br />
30–39 y 639 1.81 0.08 513.6 55.3 69.8 7.7 64.74 8.55 560.9 100.1 0.73<br />
40–49 y 464 1.78 0.07 512.2 53.5 57.8 7.2 62.92 8.13 561.1 91.6 0.72<br />
50–59 y 294 1.77 0.07 507.1 53.0 55.4 7.9 62.54 8.74 578.6 103.4 0.80<br />
60–69 y 218 1.76 0.07 509.7 50.5 51.4 8.1 61.52 7.40 621.6 119.6 0.59<br />
70 y<br />
BMI 25–30<br />
86 1.73 0.07 524.3 59.9 46.6 7.8 58.13 7.26 666.2 132.8 0.47<br />
18–19 y 138 1.80 0.08 473.4 52.7 58.5 7.6 69.38 9.39 564.4 88.8 0.78<br />
20–29 y 1360 1.81 0.07 475.0 48.7 58.2 7.3 69.70 9.09 572.8 94.0 0.76<br />
30–39 y 2747 1.80 0.07 472.0 46.7 57.1 7.2 69.65 8.56 579.9 92.5 0.59<br />
40–49 y 2494 1.79 0.07 471.4 49.6 55.2 7.3 68.77 8.93 591.9 100.7 0.74<br />
50–59 y 1994 1.77 0.07 468.0 46.7 52.5 7.3 67.66 8.48 610.0 106.3 0.71<br />
60–69 y 1267 1.75 0.06 469.8 50.0 49.4 7.5 66.15 8.78 637.3 116.8 0.71<br />
70 y<br />
BMI 30–35<br />
313 1.73 0.06 470.6 53.6 44.7 8.2 64.83 8.60 696.1 138.9 0.68<br />
18–19 y 115 1.82 0.07 445.7 44.2 53.9 7.2 74.89 9.52 629.3 135.0 0.41<br />
20–29 y 1200 1.81 0.07 448.4 45.3 55.1 6.8 73.52 9.55 603.2 99.7 0.76<br />
30–39 y 2682 1.81 0.07 440.6 45.8 53.5 6.8 74.86 9.48 621.6 103.9 0.75<br />
40–49 y 2809 1.78 0.07 434.3 44.9 51.3 6.7 74.12 9.35 633.2 105.7 0.75<br />
50–59 y 2542 1.77 0.07 432.0 43.8 48.6 6.6 73.02 9.17 656.1 111.7 0.74<br />
60–69 y 1643 1.75 0.07 435.2 46.4 45.9 7.1 70.99 9.26 683.5 129.1 0.71<br />
70 y<br />
BMI 35–40<br />
381 1.72 0.06 442.6 47.0 42.5 6.9 67.97 8.98 719.4 141.6 0.70<br />
18–19 y 55 1.81 0.09 423.1 39.2 50.3 4.4 78.46 10.24 659.5 86.6 0.73<br />
20–29 y 518 1.81 0.07 423.2 44.2 51.1 6.6 78.04 10.00 651.4 105.6 0.72<br />
30–39 y 1090 1.80 0.07 411.9 45.2 49.5 6.1 80.01 10.84 668.9 107.6 0.76<br />
40–49 y 1187 1.78 0.07 404.9 43.1 47.0 6.6 79.52 10.83 692.2 124.7 0.77<br />
50–59 y 1060 1.76 0.06 403.5 45.5 44.9 6.8 77.80 10.46 708.6 137.3 0.71<br />
60–69 y 643 1.74 0.07 404.9 45.9 42.2 7.5 75.67 10.35 740.2 152.0 0.72<br />
70 y<br />
BMI 40–50<br />
89 1.72 0.07 406.6 48.7 38.5 6.3 73.90 10.53 790.7 147.7 0.66<br />
18–19 y 30 1.81 0.07 412.8 31.1 47.3 4.5 80.11 9.00 702.9 102.6 0.77<br />
20–29 y 196 1.81 0.07 392.9 43.6 46.3 6.0 84.08 11.17 719.9 123.0 0.79<br />
30–39 y 444 1.80 0.07 377.9 44.2 44.2 6.7 87.10 12.44 754.5 145.0 0.78<br />
40–49 y 487 1.78 0.07 372.6 44.6 41.9 6.6 86.74 12.56 781.4 149.0 0.76<br />
50–59 y 417 1.76 0.07 369.1 44.8 39.8 6.7 85.34 12.55 804.2 166.9 0.77<br />
60–69 y 212 1.74 0.06 374.9 45.2 37.7 6.9 81.75 11.66 823.0 186.3 0.67<br />
70 y 29 1.75 0.08 372.7 39.9 32.9 6.7 82.95 11.98 975.8 276.8 0.81<br />
1 2 2 2<br />
BMI is in kg/m . R, resistance; Xc, reactance; H, height; r, correlation coefficient between H /R and H /Xc. ANOVA showed significant interactions<br />
between age and BMI categories for both <strong>vector</strong> components (H 2 /R and H 2 /Xc).<br />
All data are given as means SDs. Statistical analyses were<br />
performed by using SPSS for WINDOWS 8.0 (SPSS Inc, Chicago,<br />
IL). Pearson’s correlation coefficients were calculated for<br />
relations between H 2 /R and H 2 /Xc. A P value 0.05 was consi<strong>de</strong>red<br />
as statistically significant. Differences between age or<br />
BMI groups were analyzed by ANOVA with Bonferroni post hoc<br />
test. Interactions among age and BMI categories were also investigated<br />
by ANOVA.<br />
Confi<strong>de</strong>nce ellipses were calculated by using BIVA s<strong>of</strong>tware<br />
(A Piccoli, G Pastori, Department <strong>of</strong> Medical and Surgical Sciences,<br />
University <strong>of</strong> Padova, Padova, Italy, 2002; available by<br />
E-mail: apiccoli@unipd.it). The calculation <strong>of</strong> confi<strong>de</strong>nce limits<br />
for mean <strong>impedance</strong> <strong>vector</strong>s requires bivariate normal distributions<br />
<strong>of</strong> H 2 /R and H 2 /Xc and is explained in <strong>de</strong>tail by Piccoli et al<br />
(1, 9). Confi<strong>de</strong>nce ellipses <strong>de</strong>scribe the area in which the mean<br />
sex-, BMI-, and age-specific two-dimensional <strong>vector</strong>s fall within<br />
a 95% probability (1). This implies that graphically nonoverlapping<br />
95% confi<strong>de</strong>nce ellipses are significantly different from<br />
each other (P 0.05; conterminous with a significant Hotelling’s<br />
T 2 test; 1).<br />
RESULTS<br />
Study groups were divi<strong>de</strong>d into sex, BMI, and age classes as<br />
follows: 15 605 children and adolescents were stratified into 3<br />
age groups with up to 5 BMI classes (6–9 y with BMIs <strong>of</strong> 9–13,<br />
13–15, 15–17, and 17–25; 10–13 y with BMIs <strong>of</strong> 11–15,<br />
15–20, 20–25, 25–30, and 30–35; and 14–17 y with<br />
BMIs <strong>of</strong> 14–19, 19–25, 25–30, 30–35, and 35–40). In<br />
213 294 adults, 5 BMI categories (normal weight: 18.5–25; overweight:<br />
25–30; and obese: 30–35, 35–40, and 40–50)
TABLE 3<br />
Impedance <strong>vector</strong> components in 9707 girls and 5898 boys by BMI and age classes 1<br />
n Height R Xc H 2 /R H 2 /Xc r<br />
m cm 2 / cm 2 /<br />
Age 6–9 y<br />
Girls<br />
BMI 9–13 72 1.20 0.11 879.4 94.9 78.4 14.9 16.86 4.61 191.5 52.6 0.77<br />
BMI 13–15 853 1.19 0.06 829.5 74.5 74.8 32.1 17.44 2.80 197.2 34.9 0.71<br />
BMI 15–17 1168 1.21 0.08 777.9 71.2 72.0 12.0 19.19 3.60 209.5 40.3 0.65<br />
BMI 17–25<br />
Boys<br />
879 1.30 0.14 714.1 79.8 67.8 9.6 24.72 8.02 259.4 75.6 0.91<br />
BMI 9–13 39 1.19 0.06 858.2 97.2 72.0 12.7 16.85 2.51 204.1 39.7 0.74<br />
BMI 13–15 860 1.20 0.06 787.8 63.0 69.6 9.4 18.59 2.68 214.4 71.3 0.33<br />
BMI 15–17 1194 1.22 0.07 734.5 66.7 67.1 9.4 20.62 9.35 225.3 44.5 0.27<br />
BMI 17–25<br />
Age 10–13 y<br />
Girls<br />
670 1.28 0.11 676.8 70.3 64.5 8.8 25.04 6.55 263.1 62.1 0.84<br />
BMI 11–15 190 1.41 0.07 816.0 78.1 74.4 9.9 24.54 3.57 272.7 55.2 0.74<br />
BMI 15–20 1113 1.44 0.09 733.4 79.1 69.9 9.8 28.86 5.50 304.5 61.5 0.77<br />
BMI 20–25 748 1.53 0.11 653.0 71.5 63.8 8.5 36.64 7.92 376.1 80.7 0.84<br />
BMI 25–30 654 1.59 0.09 586.3 62.8 58.7 7.4 43.92 7.82 439.7 80.4 0.80<br />
BMI 30–35<br />
Boys<br />
293 1.63 0.08 538.9 55.1 55.2 7.8 49.75 7.55 490.2 86.6 0.73<br />
BMI 11–15 186 1.42 0.06 786.2 72.0 72.1 8.9 25.93 3.84 285.1 51.0 0.78<br />
BMI 15–20 1125 1.44 0.07 701.2 68.0 67.3 8.7 29.91 4.86 313.9 58.0 0.77<br />
BMI 20–25 484 1.51 0.10 636.0 74.2 62.5 7.9 36.60 8.91 372.2 84.9 0.81<br />
BMI 25–30 379 1.57 0.10 576.3 62.0 57.9 6.9 43.61 8.74 433.9 82.6 0.84<br />
BMI 30–35<br />
Age 14–17 y<br />
Girls<br />
165 1.63 0.11 527.5 60.8 53.0 6.4 51.27 10.93 508.3 95.0 0.81<br />
BMI 14–19 157 1.68 0.06 697.8 73.4 68.5 10.3 40.78 5.30 420.9 75.3 0.71<br />
BMI 19–25 1138 1.67 0.06 624.4 65.9 64.7 8.5 45.40 5.79 441.3 69.8 0.72<br />
BMI 25–30 1375 1.67 0.06 578.0 57.8 61.3 8.1 48.61 6.15 462.1 73.6 0.71<br />
BMI 30–35 796 1.67 0.07 541.8 53.9 57.1 7.7 52.10 6.55 489.9 79.5 0.73<br />
BMI 35–40<br />
Boys<br />
271 1.67 0.07 504.5 54.2 53.7 7.7 55.90 7.94 529.9 92.2 0.75<br />
BMI 14–19 34 1.74 0.12 627.4 72.8 62.7 8.1 49.31 9.97 494.1 100.1 0.85<br />
BMI 19–25 167 1.76 0.09 530.6 62.0 59.1 8.5 59.31 10.01 535.7 100.7 0.73<br />
BMI 25–30 252 1.75 0.10 513.8 64.7 55.6 6.8 60.82 12.06 558.8 96.1 0.75<br />
BMI 30–35 249 1.76 0.09 479.4 58.5 52.3 6.9 66.02 11.68 605.0 99.2 0.74<br />
BMI 35–40 94 1.77 0.09 443.6 50.4 48.9 6.4 72.16 11.28 656.0 107.3 0.55<br />
1 2 2 2<br />
BMI is in kg/m . R, resistance; Xc, reactance; H, height; r, correlation coefficient between H /R and H /Xc. ANOVA showed significant interactions<br />
between age and BMI categories for both <strong>vector</strong> components (H 2 /R and H 2 /Xc).<br />
were stratified into 7 age groups (18–19, 20–29, 30–39, 40–49,<br />
50–59, 60–69, and 70 y).<br />
Shown in Tables 1–3 are all the parameters necessary for<br />
calculation <strong>of</strong> the respective confi<strong>de</strong>nce or tolerance ellipses in<br />
subgroups <strong>of</strong> women (Table 1), men (Table 2), and children and<br />
adolescents (Table 3). The size <strong>of</strong> the confi<strong>de</strong>nce ellipses was<br />
influenced by the variability <strong>of</strong> the <strong>vector</strong> components and the<br />
sample size (smaller ellipses from a greater number <strong>of</strong> subjects<br />
with a similar SD). The shape <strong>of</strong> both the tolerance and the<br />
confi<strong>de</strong>nce ellipses was <strong>de</strong>termined by the coefficient <strong>of</strong> correlation<br />
between H 2 /R and H 2 /Xc (more flat and elongated shape<br />
with a higher correlation).<br />
The sex and BMI <strong>de</strong>pen<strong>de</strong>ncy <strong>of</strong> the <strong>vector</strong> distribution patterns<br />
within age classes (95% confi<strong>de</strong>nce ellipses) for adults is<br />
shown in Figure 1. Within a BMI and age category, <strong>vector</strong>s for<br />
women were significantly shorter than those for men. With <strong>de</strong>creasing<br />
BMI, there was a progressive shortening <strong>of</strong> the <strong>impedance</strong><br />
<strong>vector</strong>s with a combined <strong>de</strong>crease <strong>of</strong> both the H 2 /R and the<br />
H 2 /Xc components, without overlapping <strong>of</strong> confi<strong>de</strong>nce ellipses.<br />
EFFECT OF AGE ON IMPEDANCE VARIABLES 63<br />
In Figure 2, 95% confi<strong>de</strong>nce ellipses were plotted for subgroups<br />
<strong>of</strong> children and adolescents. Mean <strong>impedance</strong> <strong>vector</strong>s in children<br />
were shorter than in adults, and a gradual <strong>vector</strong> shortening was<br />
observed with <strong>de</strong>creasing age. Sex differences in <strong>vector</strong> distribution<br />
were already apparent in children, although they were less<br />
pronounced than in adults. Longer <strong>vector</strong>s were found in boys<br />
than in girls <strong>of</strong> the same age and BMI group, without a difference<br />
in mean <strong>vector</strong> direction between the sexes.<br />
In Figure 3, the age <strong>de</strong>pen<strong>de</strong>ncy <strong>of</strong> mean <strong>vector</strong> placement is<br />
apparent as a continuous down-sloping <strong>of</strong> the mean <strong>vector</strong> as the<br />
result <strong>of</strong> a <strong>de</strong>crease in the H 2 /Xc component with <strong>de</strong>creasing age.<br />
By contrast, the H 2 /R component within each sex and BMI group<br />
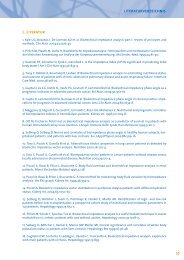
remained fairly constant with increasing age. In Figure 4, 35 795<br />
women were divi<strong>de</strong>d into 6 groups <strong>of</strong> a certain BMI and 6 age<br />
ranges. This classification required a large sample size and could<br />
therefore not be done in men because <strong>of</strong> insufficient numbers in<br />
individual BMI categories. As shown in Figure 4A, the H 2 /R<br />
component increased with increasing BMI (P 0.05 for all age<br />
groups), whereas there was no consistent change or even a slight
64 BOSY-WESTPHAL ET AL<br />
FIGURE 1. Mean <strong>impedance</strong> <strong>vector</strong>s with 95% confi<strong>de</strong>nce ellipses from subjects stratified by age and BMI groups [BMI (in kg/m 2 ) groups were as follows:<br />
18.5–25, 25–30, 30–35, 35–40, and 40–50]. Within each graph, the ellipse sequence on the left represents women and that on the right represents men.<br />
Within each sex, <strong>vector</strong> shortening is observed with <strong>de</strong>creasing BMI; ie, the lowest BMI group is represented by the shortest <strong>vector</strong> and the highest BMI group<br />
by the longest <strong>vector</strong>. H, subjects’ height; R, resistance; Xc, reactance. The figure is based on data from 29 674 men and 179 429 women. The numbers <strong>of</strong> subjects<br />
in each BMI and age category are given in Tables 1 and 2. Graphically nonoverlapping 95% confi<strong>de</strong>nce ellipses are significantly different from each other,<br />
P 0.05 (conterminous with a significant Hotelling’s T 2 test).<br />
<strong>de</strong>crease in the H 2 /R component with age. Concomitantly, a<br />
prediction equation for body composition that relied on H 2 /R, R,<br />
and weight (11) did not show an age-related increase but rather<br />
a slight <strong>de</strong>crease in percentage fat mass in these women (Figure<br />
4B). By contrast, the H 2 /Xc component <strong>de</strong>creased with increasing<br />
BMI and age (Figure 4C), which resulted in a <strong>de</strong>crease in<br />
body cell mass (calculated by the manufacturer’s algorithm as<br />
total body water/0.732 phase angle constant) with age in<br />
each BMI group (Figure 4D).<br />
DISCUSSION<br />
We established a large database <strong>of</strong> <strong>impedance</strong> <strong>vector</strong> distributions<br />
that exceeds current databases with respect to numbers<br />
and BMI and the age ranges covered. We used the database to<br />
analyze age-related changes in the <strong>vector</strong> components H 2 /R and<br />
H 2 /Xc with respect to their effects on body-composition analysis.<br />
The main result <strong>of</strong> our study was the insensitivity <strong>of</strong> conventional<br />
BIA to age-related changes in fat mass.<br />
Applications for <strong>vector</strong> BIA<br />
The RXc graph is a probability chart that relates an individual<br />
<strong>vector</strong> according to the mean value <strong>of</strong> the reference population<br />
(9). Sex-, BMI-, and age-specific <strong>vector</strong> distribution patterns 1)<br />
contribute to a better un<strong>de</strong>rstanding <strong>of</strong> the factors influencing<br />
<strong>impedance</strong> results, 2) may be used a healthy reference when<br />
individual patient data are analyzed, and 3) serve as a quality<br />
criterion for BIA results before the application <strong>of</strong> algorithms to<br />
calculate total body water or fat-free mass. The comparison with<br />
reference <strong>vector</strong> distributions allows one to discriminate between<br />
<strong>impedance</strong> values that 1) lie within the normal range (and<br />
may therefore reasonably be converted into total body water or<br />
fat mass) or 2) lie outsi<strong>de</strong> the respective reference range and thus<br />
must not be converted into total body water or fat mass. If an<br />
individual <strong>vector</strong> does not match with its sex-, BMI-, and agespecific<br />
reference distribution, this is explained by either a measurement<br />
error (eg, false placement <strong>of</strong> electro<strong>de</strong>s) or increased or<br />
<strong>de</strong>creased hydration fraction <strong>of</strong> the fat-free mass (eg, in case <strong>of</strong><br />
e<strong>de</strong>ma or <strong>de</strong>hydration). Vector BIA thus can be used as a measure<br />
<strong>of</strong> quality control to prevent misinterpretation <strong>of</strong> <strong>impedance</strong><br />
readings and thus erroneous predictions <strong>of</strong> body compartments.<br />
A comparison <strong>of</strong> an individual <strong>impedance</strong> measurement with a<br />
reference database is easily achieved by using tolerance ellipses<br />
<strong>of</strong> the RXc graph. Tolerance ellipses are bivariate percentiles<br />
indicating the probability that an individual measurement falls at
a given distance from the observed mean <strong>vector</strong> <strong>of</strong> the reference<br />
population obtained with the same type <strong>of</strong> <strong>impedance</strong> analyzer.<br />
Tolerance ellipses for the R/H and Xc/H <strong>vector</strong> components have<br />
been reported for sex-specific populations comprising age<br />
ranges <strong>of</strong> 20–69 y and BMI ranges <strong>of</strong> 19 to 30 (8, 9).<br />
Determinants <strong>of</strong> <strong>vector</strong> distribution pattern<br />
Vector length is influenced by the amount <strong>of</strong> total body water<br />
and thus fat-free mass per conductor length. Men and obese<br />
subjects had greater fat-free mass per body height along with<br />
shorter R/H or longer H 2 /R <strong>vector</strong> components (Figures 1–3; 1–3,<br />
8, 9). By contrast, <strong>vector</strong> direction (phase angle) is influenced by<br />
s<strong>of</strong>t tissue cell mass, which is modified by age in healthy subjects.<br />
Fluid overload and increasing fat mass both lead to progressive<br />
<strong>vector</strong> shortening <strong>of</strong> the classic R/H and Xc/H <strong>vector</strong> components<br />
(1–3) or <strong>vector</strong> elongation <strong>of</strong> our modified <strong>vector</strong> components<br />
H 2 /R and H 2 /Xc. Discrimination between the 2 conditions is<br />
possible, however. With increasing fat mass, the H 2 /Xc <strong>vector</strong><br />
component remains in a fixed sex-<strong>de</strong>pen<strong>de</strong>nt relation to the H 2 /R<br />
component (which is reflected by a constant phase angle with<br />
increasing BMI from 25 to 50; Figure 1). By contrast, fluid<br />
overload in renal patients was accompanied not only by <strong>vector</strong><br />
shortening (lowering <strong>of</strong> the R/H <strong>vector</strong> component) but also by<br />
EFFECT OF AGE ON IMPEDANCE VARIABLES 65<br />
FIGURE 2. Mean <strong>impedance</strong> <strong>vector</strong>s with 95% confi<strong>de</strong>nce ellipses from children and adolescents (9707 girls and 5898 boys) stratified by sex, age, and BMI<br />
groups [BMI groups (in kg/m 2 ) for each age and sex group are shown on the figure]. The numbers <strong>of</strong> subjects in each BMI and age category are given in Table<br />
3. H, subjects’ height; R, resistance; Xc, reactance. Graphically nonoverlapping 95% confi<strong>de</strong>nce ellipses are significantly different from each other, P 0.05<br />
(conterminous with a significant Hotelling’s T 2 test).<br />
<strong>vector</strong> down-sloping (lowering <strong>of</strong> phase angle), which could<br />
both be reversed after hemodialysis (3). Thus, fluid shifts occur<br />
along the major axis <strong>of</strong> a tolerance ellipse, and the upper and<br />
lower poles <strong>of</strong> the 75% tolerance ellipse represent the biological<br />
thresholds for clinically relevant <strong>de</strong>hydration and fluid overload,<br />
respectively (1, 2).<br />
Age-<strong>de</strong>pen<strong>de</strong>ncy <strong>of</strong> BIA variables<br />
There is evi<strong>de</strong>nce that body composition can be accurately<br />
estimated with conventional BIA by using sex-specific regression<br />
equations validated against a 4-compartment mo<strong>de</strong>l in the<br />
age range <strong>of</strong> 12–94 y and BMI range <strong>of</strong> 14–39 (11). However, the<br />
lack <strong>of</strong> increase in the H 2 /R component with increasing age at the<br />
same BMI (Figure 4A) might explain the insensitivity <strong>of</strong> H 2 /R to<br />
age-related changes in body composition (Figure 4B). The use <strong>of</strong><br />
a prediction equation for body composition that inclu<strong>de</strong>d both<br />
H 2 /R and Xc (12) also failed to show an increase in percentage fat<br />
mass with age at the same BMI (results not shown). With the use<br />
<strong>of</strong> dual-energy X-ray absorptiometry or a 4-compartment mo<strong>de</strong>l,<br />
mean percentages <strong>of</strong> body fat mass in 60–79-y-old women and<br />
men were shown to be 3% and 5% higher than the percentages in<br />
20–39-y-old subjects <strong>of</strong> the same BMI (13). The inclusion <strong>of</strong> age<br />
as an in<strong>de</strong>pen<strong>de</strong>nt variable in the regression equation might
66 BOSY-WESTPHAL ET AL<br />
FIGURE 3. Mean <strong>impedance</strong> <strong>vector</strong>s with 95% confi<strong>de</strong>nce ellipses from subjects (30 572 men and 183 176 women) stratified by BMI (in kg/m 2 ) and age<br />
groups. Within each graph, the ellipse sequence on the left represents women and that on the right represents men. Within each sex, <strong>vector</strong> down-sloping is<br />
observed with <strong>de</strong>creasing age, ie, the youngest group is represented by the shortest <strong>vector</strong> and the ol<strong>de</strong>st group by the longest <strong>vector</strong>, respectively. H, subjects’<br />
height; R, resistance; Xc, reactance. Graphically nonoverlapping 95% confi<strong>de</strong>nce ellipses are significantly different from each other, P 0.05 (conterminous<br />
with a significant Hotelling’s T 2 test).<br />
therefore be indispensable for a plausible result, ie, an increasing<br />
percentage fat mass with age at the same BMI. By contrast,<br />
age-related changes in body cell mass might be predictable by<br />
conventional BIA by applying prediction equations that inclu<strong>de</strong><br />
Xc (Figure 4C and D). BIA prediction equations need to be<br />
<strong>de</strong>veloped and validated in the population un<strong>de</strong>r study (14, 15).<br />
Some authors suggest that application <strong>of</strong> BIA to el<strong>de</strong>rly populations<br />
requires only uniform validation procedures in the actual<br />
study population but not age-specific equations (16).<br />
Study limitations<br />
The limitations <strong>of</strong> our study <strong>de</strong>rive from the selection criteria<br />
<strong>of</strong> the sample (ie, inquiring rather than examining participants’<br />
health status). Thus, we cannot exclu<strong>de</strong> disturbances in fluid<br />
balance due to mild cardiac or renal insufficiency. However,<br />
because <strong>of</strong> the large sample size, the low variation in results (SD<br />
<strong>of</strong> H 2 /R and H 2 /Xc), and the 95% CI, the effect <strong>of</strong> this bias should<br />
be negligible. Additionally, our study lacks in<strong>de</strong>pen<strong>de</strong>nt data on<br />
body-composition analysis (eg, measuring total body water by<br />
<strong>de</strong>uterium dilution) to confirm that individual <strong>vector</strong> placements<br />
solely <strong>de</strong>termined by electrical properties <strong>of</strong> tissue per human<br />
conductor length relate to body composition in<strong>de</strong>pen<strong>de</strong>ntly <strong>of</strong><br />
body shape and geometry. Future studies will be nee<strong>de</strong>d to examine<br />
this issue. Although we collected a huge database from<br />
centers located in different regions <strong>of</strong> Germany, our data cannot<br />
be consi<strong>de</strong>red to be representative <strong>of</strong> the German population.<br />
Because weight reduction was the main reason for monitoring<br />
nutritional status in the Precon centers, our data on overweight<br />
and obese subjects exceed the average <strong>of</strong> age- and sex-specific<br />
German population references (17). However, the aim <strong>of</strong> our<br />
study was to examine the patterns <strong>of</strong> <strong>bioelectrical</strong> <strong>impedance</strong><br />
<strong>vector</strong> distribution by BMI and age. Thus, we only required a<br />
reasonable number <strong>of</strong> cases in each BMI and age group. The lack<br />
<strong>of</strong> representativeness <strong>of</strong> our study population as a whole is not<br />
contrary to the use <strong>of</strong> our data as a reference for the sex-, age-, and<br />
BMI-<strong>de</strong>pen<strong>de</strong>nt distributions <strong>of</strong> H 2 /R and H 2 /Xc because 1) we
divi<strong>de</strong>d our subjects into subgroups according to sex and narrow<br />
ranges <strong>of</strong> BMI and age and 2) each subgroup consisted <strong>of</strong> a<br />
reasonable number <strong>of</strong> cases.<br />
AB-W and MJM were responsible for the study <strong>de</strong>sign; AB-W, SD, and<br />
R-PD were responsible for data collection; AB-W and AP were responsible<br />
for data analysis; AB-W, AP, and MJM were responsible for discussion <strong>of</strong><br />
data; and AB-W and MJM were responsible for writing <strong>of</strong> the manuscript.<br />
None <strong>of</strong> the authors had a conflict <strong>of</strong> interest.<br />
REFERENCES<br />
1. Piccoli A, Rossi B, Pillon L, Bucciante G. A new method for monitoring<br />
body fluid variation by bio<strong>impedance</strong> analysis: the RXc graph. Kidney<br />
Int 1994;46:534–9.<br />
EFFECT OF AGE ON IMPEDANCE VARIABLES 67<br />
FIGURE 4. (A) Age <strong>de</strong>pen<strong>de</strong>ncy <strong>of</strong> the H 2 /R <strong>vector</strong> component at certain BMIs. (B) Age <strong>de</strong>pen<strong>de</strong>ncy <strong>of</strong> percentage body fat mass calculated by the formula<br />
<strong>of</strong> Sun et al (11) at certain BMIs. (C) Age <strong>de</strong>pen<strong>de</strong>ncy <strong>of</strong> the H 2 /Xc <strong>vector</strong> component at certain BMIs. (D) Age <strong>de</strong>pen<strong>de</strong>ncy <strong>of</strong> body cell mass (BCM) calculated<br />
by the manufacturer’s formula (see Subjects and Methods) at certain BMIs. A total <strong>of</strong> 35 795 women in 6 BMI (in kg/m 2 ) categories were divi<strong>de</strong>d into 6 age<br />
groups as follows: BMI 17.5 to 18.5, n 163 (18–29 y), 67 (30–39 y), 36 (40–49 y), 7 (50–59 y), 8 (60–69 y), and 2 (70–80 y); BMI 19.5 to 20.5,<br />
n 481 (18–29 y), 347 (30–39 y), 186 (40–49 y), 75 (50–59 y), 33 (60–69 y), and 5 (70–80 y); BMI 24.5 to 25.5, n 2910 (18–29 y), 3774 (30–39<br />
y), 2770 (40–49 y), 1675 (50–59 y), 580 (60–69 y), and 85 (70–80 y); BMI 29.5 to 30.5, n 1881 (18–29 y), 3219 (30–39 y), 3264 (40–49 y), 2887<br />
(50–59 y), 1428 (60–69 y), and 308 (70–80 y); BMI 34.5 to 35.5, n 1004 (18–29 y), 1519 (30–39 y), 1716 (40–49 y), 1639 (50–59 y), 935 (60–69<br />
y), and 196 (70–80 y); BMI 39.5 to 40.5, n 359 (18–29 y), 596 (30–39 y), 616 (40–49 y), 623 (50–59 y), 330 (60–69 y), and 71 (70–80 y). H, subjects’<br />
height; R, resistance; Xc, reactance. ANOVA with Bonferroni post hoc test was used to compare the 6 age groups (1 18–29 y, 2 30–39 y, 3 40–49y,<br />
4 50–59 y, 5 60–69 y, and 6 70–80 y) within one BMI group. Differences between age groups within BMI groups are indicated by a number (P <br />
0.01). All differences between BMI groups within age groups were significant (P 0.05).<br />
2. Piccoli A, for the Italian HD-BIA study group. I<strong>de</strong>ntification <strong>of</strong> operational<br />
clues to dry weight prescription in hemodialysis using bio<strong>impedance</strong><br />
<strong>vector</strong> analysis. Kidney Int 1998;53:1036–43.<br />
3. Piccoli A, Brunani A, Savia G, et al. Discriminating between body fat<br />
and fluid changes in the obese adult using bio<strong>impedance</strong> <strong>vector</strong> analysis.<br />
Int J Obes Relat Metab Disord 1998;22:97–104.<br />
4. Piccoli A, Pittoni G, Facco E, Favaro E, Pillon L. Relationship between<br />
central venous pressure and bio<strong>impedance</strong> <strong>vector</strong> analysis in critically ill<br />
patients. Crit Care Med 2000;28:132–7.<br />
5. Piccoli A, Fanos V, Peruzzi L, et al. Reference values <strong>of</strong> the <strong>bioelectrical</strong><br />
<strong>impedance</strong> <strong>vector</strong> in neonates in the first week after birth. Nutrition<br />
2002;18:383–7.<br />
6. Savino F, Grasso G, Cresi F, Oggero R, Silvestro L. Bioelectrical <strong>impedance</strong><br />
<strong>vector</strong> distribution in the first year <strong>of</strong> life. Nutrition 2003;19:<br />
492–6.<br />
7. Savino F, Cresi F, Grasso G, Oggero R, Silvestro L. The biagram <strong>vector</strong>:
68 BOSY-WESTPHAL ET AL<br />
a graphical relation between reactance and phase angle measured by<br />
<strong>bioelectrical</strong> analysis in infants. Ann Nutr Metab 2004;48:84–9.<br />
8. Piccoli A, Nigrelli S, Caberlotto A, et al. Bivariate normal values <strong>of</strong> the<br />
<strong>bioelectrical</strong> <strong>impedance</strong> <strong>vector</strong> in adult and el<strong>de</strong>rly populations. Am J<br />
Clin Nutr 1995;61:269–70.<br />
9. Piccoli A, Pillon L, Dumler F. Impedance <strong>vector</strong> distribution by sex,<br />
race, body mass in<strong>de</strong>x, and age in the United States: standard reference<br />
intervals as bivariate Z scores. Nutrition 2002;18:153–67.<br />
10. Kushner RF. Bioelectrical <strong>impedance</strong> analysis: a review <strong>of</strong> principals<br />
and applications. Am Coll Nutr 1992;11:199–209.<br />
11. Sun SS, Chumlea WC, Heymsfield SB, et al. Development <strong>of</strong> <strong>bioelectrical</strong><br />
<strong>impedance</strong> analysis prediction equations for body composition<br />
with the use <strong>of</strong> a multicomponent mo<strong>de</strong>l for use in epi<strong>de</strong>miologic surveys.<br />
Am J Clin Nutr 2003;77:331–40.<br />
12. Kyle UG, Genton L, Karsegard L, Slosman DO, Pichard C. Single<br />
prediction equation for <strong>bioelectrical</strong> <strong>impedance</strong> analysis in adults aged<br />
20–94yrs. Nutrition 2001;17:248–53.<br />
13. Gallagher D, Heymsfield SB, Heo M, Jebb SA, Murgatroyd PR, Sakamoto<br />
Y. Healthy percentage <strong>of</strong> body fat ranges: an approach for <strong>de</strong>veloping<br />
gui<strong>de</strong>lines based on body mass in<strong>de</strong>x. Am J Clin Nutr 2000;72:<br />
694–701.<br />
14. Dey DK, Bosaeus I. Comparison <strong>of</strong> <strong>bioelectrical</strong> <strong>impedance</strong> prediction<br />
equations for fat-free mass in a population-based sample <strong>of</strong> 75 y olds: the<br />
NORA study. Nutrition 2003;19:858–64.<br />
15. Genton L, Karsegard VL, Kyle UG, Hans DB, Michel JP, Pichard C.<br />
Comparison <strong>of</strong> four <strong>bioelectrical</strong> <strong>impedance</strong> analysis formulas in healthy<br />
el<strong>de</strong>rly subjects. Gerontology 2001;47:315–23.<br />
16. Rouben<strong>of</strong>f R, Baumgartner RN, Harris TB, et al. Application <strong>of</strong> <strong>bioelectrical</strong><br />
<strong>impedance</strong> analysis to el<strong>de</strong>rly populations. J Gerontol A Biol Sci<br />
Med Sci 1997;52:M129–36.<br />
17. G Mensink. Übergewicht. [Overweight.] In: Beiträge zur Gesundheitsberichterstattung<br />
<strong>de</strong>s Bun<strong>de</strong>s. Was essen wir heute? Ernährungsverhalten<br />
in Deutschland. [Contributions to the German Nutrition Survey.<br />
Nutrition habits in Germany.] Berlin: Robert Koch Institut, 2002 (in<br />
German).