Patterns of bioelectrical impedance vector ... - Data-input.de
Patterns of bioelectrical impedance vector ... - Data-input.de
Patterns of bioelectrical impedance vector ... - Data-input.de

You also want an ePaper? Increase the reach of your titles
YUMPU automatically turns print PDFs into web optimized ePapers that Google loves.
a given distance from the observed mean <strong>vector</strong> <strong>of</strong> the reference<br />
population obtained with the same type <strong>of</strong> <strong>impedance</strong> analyzer.<br />
Tolerance ellipses for the R/H and Xc/H <strong>vector</strong> components have<br />
been reported for sex-specific populations comprising age<br />
ranges <strong>of</strong> 20–69 y and BMI ranges <strong>of</strong> 19 to 30 (8, 9).<br />
Determinants <strong>of</strong> <strong>vector</strong> distribution pattern<br />
Vector length is influenced by the amount <strong>of</strong> total body water<br />
and thus fat-free mass per conductor length. Men and obese<br />
subjects had greater fat-free mass per body height along with<br />
shorter R/H or longer H 2 /R <strong>vector</strong> components (Figures 1–3; 1–3,<br />
8, 9). By contrast, <strong>vector</strong> direction (phase angle) is influenced by<br />
s<strong>of</strong>t tissue cell mass, which is modified by age in healthy subjects.<br />
Fluid overload and increasing fat mass both lead to progressive<br />
<strong>vector</strong> shortening <strong>of</strong> the classic R/H and Xc/H <strong>vector</strong> components<br />
(1–3) or <strong>vector</strong> elongation <strong>of</strong> our modified <strong>vector</strong> components<br />
H 2 /R and H 2 /Xc. Discrimination between the 2 conditions is<br />
possible, however. With increasing fat mass, the H 2 /Xc <strong>vector</strong><br />
component remains in a fixed sex-<strong>de</strong>pen<strong>de</strong>nt relation to the H 2 /R<br />
component (which is reflected by a constant phase angle with<br />
increasing BMI from 25 to 50; Figure 1). By contrast, fluid<br />
overload in renal patients was accompanied not only by <strong>vector</strong><br />
shortening (lowering <strong>of</strong> the R/H <strong>vector</strong> component) but also by<br />
EFFECT OF AGE ON IMPEDANCE VARIABLES 65<br />
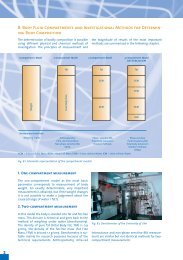
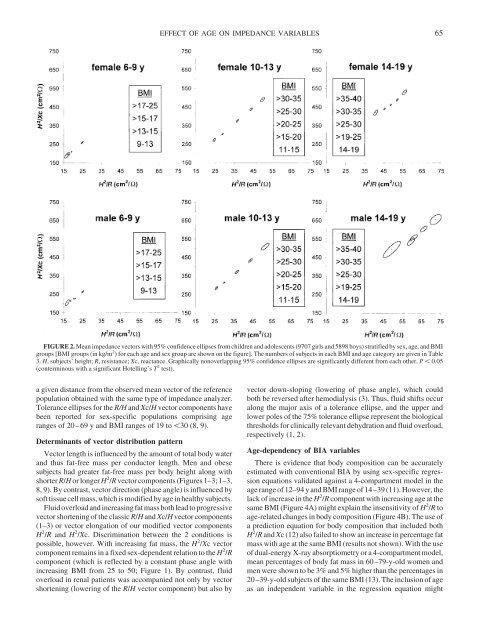
FIGURE 2. Mean <strong>impedance</strong> <strong>vector</strong>s with 95% confi<strong>de</strong>nce ellipses from children and adolescents (9707 girls and 5898 boys) stratified by sex, age, and BMI<br />
groups [BMI groups (in kg/m 2 ) for each age and sex group are shown on the figure]. The numbers <strong>of</strong> subjects in each BMI and age category are given in Table<br />
3. H, subjects’ height; R, resistance; Xc, reactance. Graphically nonoverlapping 95% confi<strong>de</strong>nce ellipses are significantly different from each other, P 0.05<br />
(conterminous with a significant Hotelling’s T 2 test).<br />
<strong>vector</strong> down-sloping (lowering <strong>of</strong> phase angle), which could<br />
both be reversed after hemodialysis (3). Thus, fluid shifts occur<br />
along the major axis <strong>of</strong> a tolerance ellipse, and the upper and<br />
lower poles <strong>of</strong> the 75% tolerance ellipse represent the biological<br />
thresholds for clinically relevant <strong>de</strong>hydration and fluid overload,<br />
respectively (1, 2).<br />
Age-<strong>de</strong>pen<strong>de</strong>ncy <strong>of</strong> BIA variables<br />
There is evi<strong>de</strong>nce that body composition can be accurately<br />
estimated with conventional BIA by using sex-specific regression<br />
equations validated against a 4-compartment mo<strong>de</strong>l in the<br />
age range <strong>of</strong> 12–94 y and BMI range <strong>of</strong> 14–39 (11). However, the<br />
lack <strong>of</strong> increase in the H 2 /R component with increasing age at the<br />
same BMI (Figure 4A) might explain the insensitivity <strong>of</strong> H 2 /R to<br />
age-related changes in body composition (Figure 4B). The use <strong>of</strong><br />
a prediction equation for body composition that inclu<strong>de</strong>d both<br />
H 2 /R and Xc (12) also failed to show an increase in percentage fat<br />
mass with age at the same BMI (results not shown). With the use<br />
<strong>of</strong> dual-energy X-ray absorptiometry or a 4-compartment mo<strong>de</strong>l,<br />
mean percentages <strong>of</strong> body fat mass in 60–79-y-old women and<br />
men were shown to be 3% and 5% higher than the percentages in<br />
20–39-y-old subjects <strong>of</strong> the same BMI (13). The inclusion <strong>of</strong> age<br />
as an in<strong>de</strong>pen<strong>de</strong>nt variable in the regression equation might