Patterns of bioelectrical impedance vector ... - Data-input.de
Patterns of bioelectrical impedance vector ... - Data-input.de
Patterns of bioelectrical impedance vector ... - Data-input.de

You also want an ePaper? Increase the reach of your titles
YUMPU automatically turns print PDFs into web optimized ePapers that Google loves.
64 BOSY-WESTPHAL ET AL<br />
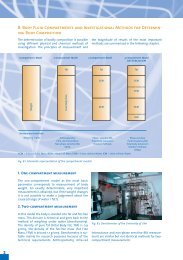
FIGURE 1. Mean <strong>impedance</strong> <strong>vector</strong>s with 95% confi<strong>de</strong>nce ellipses from subjects stratified by age and BMI groups [BMI (in kg/m 2 ) groups were as follows:<br />
18.5–25, 25–30, 30–35, 35–40, and 40–50]. Within each graph, the ellipse sequence on the left represents women and that on the right represents men.<br />
Within each sex, <strong>vector</strong> shortening is observed with <strong>de</strong>creasing BMI; ie, the lowest BMI group is represented by the shortest <strong>vector</strong> and the highest BMI group<br />
by the longest <strong>vector</strong>. H, subjects’ height; R, resistance; Xc, reactance. The figure is based on data from 29 674 men and 179 429 women. The numbers <strong>of</strong> subjects<br />
in each BMI and age category are given in Tables 1 and 2. Graphically nonoverlapping 95% confi<strong>de</strong>nce ellipses are significantly different from each other,<br />
P 0.05 (conterminous with a significant Hotelling’s T 2 test).<br />
<strong>de</strong>crease in the H 2 /R component with age. Concomitantly, a<br />
prediction equation for body composition that relied on H 2 /R, R,<br />
and weight (11) did not show an age-related increase but rather<br />
a slight <strong>de</strong>crease in percentage fat mass in these women (Figure<br />
4B). By contrast, the H 2 /Xc component <strong>de</strong>creased with increasing<br />
BMI and age (Figure 4C), which resulted in a <strong>de</strong>crease in<br />
body cell mass (calculated by the manufacturer’s algorithm as<br />
total body water/0.732 phase angle constant) with age in<br />
each BMI group (Figure 4D).<br />
DISCUSSION<br />
We established a large database <strong>of</strong> <strong>impedance</strong> <strong>vector</strong> distributions<br />
that exceeds current databases with respect to numbers<br />
and BMI and the age ranges covered. We used the database to<br />
analyze age-related changes in the <strong>vector</strong> components H 2 /R and<br />
H 2 /Xc with respect to their effects on body-composition analysis.<br />
The main result <strong>of</strong> our study was the insensitivity <strong>of</strong> conventional<br />
BIA to age-related changes in fat mass.<br />
Applications for <strong>vector</strong> BIA<br />
The RXc graph is a probability chart that relates an individual<br />
<strong>vector</strong> according to the mean value <strong>of</strong> the reference population<br />
(9). Sex-, BMI-, and age-specific <strong>vector</strong> distribution patterns 1)<br />
contribute to a better un<strong>de</strong>rstanding <strong>of</strong> the factors influencing<br />
<strong>impedance</strong> results, 2) may be used a healthy reference when<br />
individual patient data are analyzed, and 3) serve as a quality<br />
criterion for BIA results before the application <strong>of</strong> algorithms to<br />
calculate total body water or fat-free mass. The comparison with<br />
reference <strong>vector</strong> distributions allows one to discriminate between<br />
<strong>impedance</strong> values that 1) lie within the normal range (and<br />
may therefore reasonably be converted into total body water or<br />
fat mass) or 2) lie outsi<strong>de</strong> the respective reference range and thus<br />
must not be converted into total body water or fat mass. If an<br />
individual <strong>vector</strong> does not match with its sex-, BMI-, and agespecific<br />
reference distribution, this is explained by either a measurement<br />
error (eg, false placement <strong>of</strong> electro<strong>de</strong>s) or increased or<br />
<strong>de</strong>creased hydration fraction <strong>of</strong> the fat-free mass (eg, in case <strong>of</strong><br />
e<strong>de</strong>ma or <strong>de</strong>hydration). Vector BIA thus can be used as a measure<br />
<strong>of</strong> quality control to prevent misinterpretation <strong>of</strong> <strong>impedance</strong><br />
readings and thus erroneous predictions <strong>of</strong> body compartments.<br />
A comparison <strong>of</strong> an individual <strong>impedance</strong> measurement with a<br />
reference database is easily achieved by using tolerance ellipses<br />
<strong>of</strong> the RXc graph. Tolerance ellipses are bivariate percentiles<br />
indicating the probability that an individual measurement falls at