Patterns of bioelectrical impedance vector ... - Data-input.de
Patterns of bioelectrical impedance vector ... - Data-input.de
Patterns of bioelectrical impedance vector ... - Data-input.de

You also want an ePaper? Increase the reach of your titles
YUMPU automatically turns print PDFs into web optimized ePapers that Google loves.
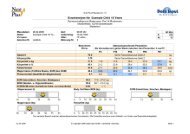
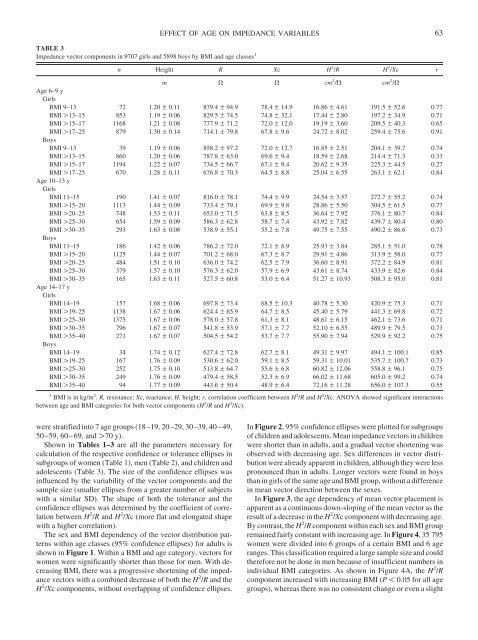
TABLE 3<br />
Impedance <strong>vector</strong> components in 9707 girls and 5898 boys by BMI and age classes 1<br />
n Height R Xc H 2 /R H 2 /Xc r<br />
m cm 2 / cm 2 /<br />
Age 6–9 y<br />
Girls<br />
BMI 9–13 72 1.20 0.11 879.4 94.9 78.4 14.9 16.86 4.61 191.5 52.6 0.77<br />
BMI 13–15 853 1.19 0.06 829.5 74.5 74.8 32.1 17.44 2.80 197.2 34.9 0.71<br />
BMI 15–17 1168 1.21 0.08 777.9 71.2 72.0 12.0 19.19 3.60 209.5 40.3 0.65<br />
BMI 17–25<br />
Boys<br />
879 1.30 0.14 714.1 79.8 67.8 9.6 24.72 8.02 259.4 75.6 0.91<br />
BMI 9–13 39 1.19 0.06 858.2 97.2 72.0 12.7 16.85 2.51 204.1 39.7 0.74<br />
BMI 13–15 860 1.20 0.06 787.8 63.0 69.6 9.4 18.59 2.68 214.4 71.3 0.33<br />
BMI 15–17 1194 1.22 0.07 734.5 66.7 67.1 9.4 20.62 9.35 225.3 44.5 0.27<br />
BMI 17–25<br />
Age 10–13 y<br />
Girls<br />
670 1.28 0.11 676.8 70.3 64.5 8.8 25.04 6.55 263.1 62.1 0.84<br />
BMI 11–15 190 1.41 0.07 816.0 78.1 74.4 9.9 24.54 3.57 272.7 55.2 0.74<br />
BMI 15–20 1113 1.44 0.09 733.4 79.1 69.9 9.8 28.86 5.50 304.5 61.5 0.77<br />
BMI 20–25 748 1.53 0.11 653.0 71.5 63.8 8.5 36.64 7.92 376.1 80.7 0.84<br />
BMI 25–30 654 1.59 0.09 586.3 62.8 58.7 7.4 43.92 7.82 439.7 80.4 0.80<br />
BMI 30–35<br />
Boys<br />
293 1.63 0.08 538.9 55.1 55.2 7.8 49.75 7.55 490.2 86.6 0.73<br />
BMI 11–15 186 1.42 0.06 786.2 72.0 72.1 8.9 25.93 3.84 285.1 51.0 0.78<br />
BMI 15–20 1125 1.44 0.07 701.2 68.0 67.3 8.7 29.91 4.86 313.9 58.0 0.77<br />
BMI 20–25 484 1.51 0.10 636.0 74.2 62.5 7.9 36.60 8.91 372.2 84.9 0.81<br />
BMI 25–30 379 1.57 0.10 576.3 62.0 57.9 6.9 43.61 8.74 433.9 82.6 0.84<br />
BMI 30–35<br />
Age 14–17 y<br />
Girls<br />
165 1.63 0.11 527.5 60.8 53.0 6.4 51.27 10.93 508.3 95.0 0.81<br />
BMI 14–19 157 1.68 0.06 697.8 73.4 68.5 10.3 40.78 5.30 420.9 75.3 0.71<br />
BMI 19–25 1138 1.67 0.06 624.4 65.9 64.7 8.5 45.40 5.79 441.3 69.8 0.72<br />
BMI 25–30 1375 1.67 0.06 578.0 57.8 61.3 8.1 48.61 6.15 462.1 73.6 0.71<br />
BMI 30–35 796 1.67 0.07 541.8 53.9 57.1 7.7 52.10 6.55 489.9 79.5 0.73<br />
BMI 35–40<br />
Boys<br />
271 1.67 0.07 504.5 54.2 53.7 7.7 55.90 7.94 529.9 92.2 0.75<br />
BMI 14–19 34 1.74 0.12 627.4 72.8 62.7 8.1 49.31 9.97 494.1 100.1 0.85<br />
BMI 19–25 167 1.76 0.09 530.6 62.0 59.1 8.5 59.31 10.01 535.7 100.7 0.73<br />
BMI 25–30 252 1.75 0.10 513.8 64.7 55.6 6.8 60.82 12.06 558.8 96.1 0.75<br />
BMI 30–35 249 1.76 0.09 479.4 58.5 52.3 6.9 66.02 11.68 605.0 99.2 0.74<br />
BMI 35–40 94 1.77 0.09 443.6 50.4 48.9 6.4 72.16 11.28 656.0 107.3 0.55<br />
1 2 2 2<br />
BMI is in kg/m . R, resistance; Xc, reactance; H, height; r, correlation coefficient between H /R and H /Xc. ANOVA showed significant interactions<br />
between age and BMI categories for both <strong>vector</strong> components (H 2 /R and H 2 /Xc).<br />
were stratified into 7 age groups (18–19, 20–29, 30–39, 40–49,<br />
50–59, 60–69, and 70 y).<br />
Shown in Tables 1–3 are all the parameters necessary for<br />
calculation <strong>of</strong> the respective confi<strong>de</strong>nce or tolerance ellipses in<br />
subgroups <strong>of</strong> women (Table 1), men (Table 2), and children and<br />
adolescents (Table 3). The size <strong>of</strong> the confi<strong>de</strong>nce ellipses was<br />
influenced by the variability <strong>of</strong> the <strong>vector</strong> components and the<br />
sample size (smaller ellipses from a greater number <strong>of</strong> subjects<br />
with a similar SD). The shape <strong>of</strong> both the tolerance and the<br />
confi<strong>de</strong>nce ellipses was <strong>de</strong>termined by the coefficient <strong>of</strong> correlation<br />
between H 2 /R and H 2 /Xc (more flat and elongated shape<br />
with a higher correlation).<br />
The sex and BMI <strong>de</strong>pen<strong>de</strong>ncy <strong>of</strong> the <strong>vector</strong> distribution patterns<br />
within age classes (95% confi<strong>de</strong>nce ellipses) for adults is<br />
shown in Figure 1. Within a BMI and age category, <strong>vector</strong>s for<br />
women were significantly shorter than those for men. With <strong>de</strong>creasing<br />
BMI, there was a progressive shortening <strong>of</strong> the <strong>impedance</strong><br />
<strong>vector</strong>s with a combined <strong>de</strong>crease <strong>of</strong> both the H 2 /R and the<br />
H 2 /Xc components, without overlapping <strong>of</strong> confi<strong>de</strong>nce ellipses.<br />
EFFECT OF AGE ON IMPEDANCE VARIABLES 63<br />
In Figure 2, 95% confi<strong>de</strong>nce ellipses were plotted for subgroups<br />
<strong>of</strong> children and adolescents. Mean <strong>impedance</strong> <strong>vector</strong>s in children<br />
were shorter than in adults, and a gradual <strong>vector</strong> shortening was<br />
observed with <strong>de</strong>creasing age. Sex differences in <strong>vector</strong> distribution<br />
were already apparent in children, although they were less<br />
pronounced than in adults. Longer <strong>vector</strong>s were found in boys<br />
than in girls <strong>of</strong> the same age and BMI group, without a difference<br />
in mean <strong>vector</strong> direction between the sexes.<br />
In Figure 3, the age <strong>de</strong>pen<strong>de</strong>ncy <strong>of</strong> mean <strong>vector</strong> placement is<br />
apparent as a continuous down-sloping <strong>of</strong> the mean <strong>vector</strong> as the<br />
result <strong>of</strong> a <strong>de</strong>crease in the H 2 /Xc component with <strong>de</strong>creasing age.<br />
By contrast, the H 2 /R component within each sex and BMI group<br />
remained fairly constant with increasing age. In Figure 4, 35 795<br />
women were divi<strong>de</strong>d into 6 groups <strong>of</strong> a certain BMI and 6 age<br />
ranges. This classification required a large sample size and could<br />
therefore not be done in men because <strong>of</strong> insufficient numbers in<br />
individual BMI categories. As shown in Figure 4A, the H 2 /R<br />
component increased with increasing BMI (P 0.05 for all age<br />
groups), whereas there was no consistent change or even a slight