DEM Quality Determines Watershed Accuracy - GIS Team
DEM Quality Determines Watershed Accuracy - GIS Team
DEM Quality Determines Watershed Accuracy - GIS Team

You also want an ePaper? Increase the reach of your titles
YUMPU automatically turns print PDFs into web optimized ePapers that Google loves.
<strong>DEM</strong> <strong>Quality</strong> <strong>Determines</strong> <strong>Watershed</strong> <strong>Accuracy</strong><br />
MicroImages, Inc. • 11th Floor - Sharp Tower 206 South 13th Street Lincoln, Nebraska 68508-2010 USA<br />
Voice (402)477-9554 FAX (402)477-9559 email info@microimages.com web www.microimages.com September 2007<br />
DRAFT<br />
Terrain Operations 12 Sep 2007<br />
500 m<br />
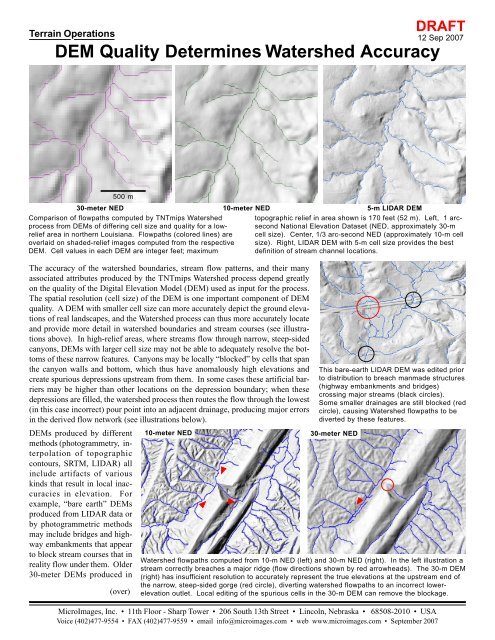
30-meter NED 10-meter NED 5-m LIDAR <strong>DEM</strong><br />
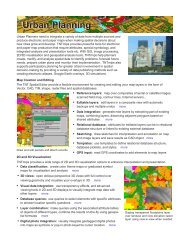
Comparison of flowpaths computed by TNTmips <strong>Watershed</strong><br />
process from <strong>DEM</strong>s of differing cell size and quality for a lowrelief<br />
area in northern Louisiana. Flowpaths (colored lines) are<br />
overlaid on shaded-relief images computed from the respective<br />
<strong>DEM</strong>. Cell values in each <strong>DEM</strong> are integer feet; maximum<br />
The accuracy of the watershed boundaries, stream flow patterns, and their many<br />
associated attributes produced by the TNTmips <strong>Watershed</strong> process depend greatly<br />
on the quality of the Digital Elevation Model (<strong>DEM</strong>) used as input for the process.<br />
The spatial resolution (cell size) of the <strong>DEM</strong> is one important component of <strong>DEM</strong><br />
quality. A <strong>DEM</strong> with smaller cell size can more accurately depict the ground elevations<br />
of real landscapes, and the <strong>Watershed</strong> process can thus more accurately locate<br />
and provide more detail in watershed boundaries and stream courses (see illustrations<br />
above). In high-relief areas, where streams flow through narrow, steep-sided<br />
canyons, <strong>DEM</strong>s with larger cell size may not be able to adequately resolve the bottoms<br />
of these narrow features. Canyons may be locally “blocked” by cells that span<br />
the canyon walls and bottom, which thus have anomalously high elevations and<br />
create spurious depressions upstream from them. In some cases these artificial barriers<br />
may be higher than other locations on the depression boundary; when these<br />
depressions are filled, the watershed process then routes the flow through the lowest<br />
(in this case incorrect) pour point into an adjacent drainage, producing major errors<br />
in the derived flow network (see illustrations below).<br />
<strong>DEM</strong>s produced by different<br />
methods (photogrammetry, interpolation<br />
of topographic<br />
contours, SRTM, LIDAR) all<br />
include artifacts of various<br />
kinds that result in local inaccuracies<br />
in elevation. For<br />
example, “bare earth” <strong>DEM</strong>s<br />
produced from LIDAR data or<br />
by photogrammetric methods<br />
may include bridges and highway<br />
embankments that appear<br />
to block stream courses that in<br />
reality flow under them. Older<br />
30-meter <strong>DEM</strong>s produced in<br />
(over)<br />
10-meter NED 30-meter NED<br />
topographic relief in area shown is 170 feet (52 m). Left, 1 arcsecond<br />
National Elevation Dataset (NED, approximately 30-m<br />
cell size). Center, 1/3 arc-second NED (approximately 10-m cell<br />
size). Right, LIDAR <strong>DEM</strong> with 5-m cell size provides the best<br />
definition of stream channel locations.<br />
This bare-earth LIDAR <strong>DEM</strong> was edited prior<br />
to distribution to breach manmade structures<br />
(highway embankments and bridges)<br />
crossing major streams (black circles).<br />
Some smaller drainages are still blocked (red<br />
circle), causing <strong>Watershed</strong> flowpaths to be<br />
diverted by these features.<br />
<strong>Watershed</strong> flowpaths computed from 10-m NED (left) and 30-m NED (right). In the left illustration a<br />
stream correctly breaches a major ridge (flow directions shown by red arrowheads). The 30-m <strong>DEM</strong><br />
(right) has insufficient resolution to accurately represent the true elevations at the upstream end of<br />
the narrow, steep-sided gorge (red circle), diverting watershed flowpaths to an incorrect lowerelevation<br />
outlet. Local editing of the spurious cells in the 30-m <strong>DEM</strong> can remove the blockage.
the United States by photogrammetric methods (manual profiling and<br />
electronic image correlation) include striping artifacts, anomalously<br />
high elevations in areas of forest cover, and patchy areas of poor elevation<br />
quality. Some of this older, poor-quality data persists locally in<br />
the current National Elevation Dataset (NED) of the United States distributed<br />
by the U.S. Geological Survey. As examples of the elevation<br />
errors that may occur, some of the production artifacts that MicroImages<br />
has encountered in the 1 arc-second (approximately 30-meter cell size)<br />
NED are tabulated and illustrated below along with color orthoimages<br />
of the problem areas.<br />
Some elevation anomalies may be evident when you view the <strong>DEM</strong>,<br />
especially when it is displayed with a color palette or with relief shading.<br />
In other cases the anomalies may only be revealed because of<br />
their effects on the initial <strong>Watershed</strong> process results, such as unfilled<br />
depressions and nested watershed polygons. Some elevation artifacts<br />
can be handled adequately by setting proper depression-filling parameters<br />
in the <strong>Watershed</strong> process, or allowing the process to automatically<br />
insert a null cell (drain) in the bottom of unfilled depressions<br />
(see the Technical Guide entitled Terrain<br />
Operations: Fill or Drain Depressions in <strong>DEM</strong>s).<br />
Other artifacts may require editing the elevation values<br />
in the <strong>DEM</strong> using the TNTmips Editor to enforce<br />
the proper drainage patterns. Plan to rerun the <strong>Watershed</strong><br />
process several times and carefully compare<br />
the interim results to other data sources such as digital<br />
2<br />
topographic maps, orthoimages, and satellite images<br />
to determine the nature of the anomalies. The imagery<br />
available online in Google Earth also provides a<br />
convenient reference for evaluating <strong>DEM</strong> problems. If<br />
these comparisons are made in TNTedit, the <strong>DEM</strong> raster<br />
can be edited to correct these conditions prior to each<br />
subsequent <strong>Watershed</strong> process run to improve watershed<br />
boundaries and drainage patterns and the many parameters<br />
computed to describe them.<br />
1<br />
Local Elevation Anomalies Encountered in<br />
1 arc-second (30-meter) NED<br />
(numbers keyed to illustrations)<br />
General poor data quality producing stream valley<br />
blockages; probably older data produced by<br />
photogrammetric methods.<br />
2 Anomalously high elevations in stream valley in<br />
area with patches of coniferous forest (dark green<br />
in leaf-off color orthophoto); data probably<br />
produced by photogrammetric methods.<br />
3<br />
4<br />
5<br />
6<br />
Highway embankment depicted in <strong>DEM</strong> blocking<br />
stream valley.<br />
Highway bridge depicted in <strong>DEM</strong> blocking stream<br />
valley.<br />
Quarry creates local artificial depression in wide<br />
stream valley.<br />
Strip-mined area with ridges removed and spoils<br />
dumped in adjacent valleys; wholesale blockage<br />
of drainages.<br />
MicroImages, Inc. 11th Floor - Sharp Tower 206 South 13th Street Lincoln, Nebraska 68508-2010 USA<br />
Voice (402)477-9554 FAX (402)477-9559 email info@microimages.com web www.microimages.com September 2007<br />
3<br />
6<br />
4<br />
5<br />
1<br />
1