Mapping Global Talent: Essays and Insights - Heidrick & Struggles
Mapping Global Talent: Essays and Insights - Heidrick & Struggles
Mapping Global Talent: Essays and Insights - Heidrick & Struggles

You also want an ePaper? Increase the reach of your titles
YUMPU automatically turns print PDFs into web optimized ePapers that Google loves.
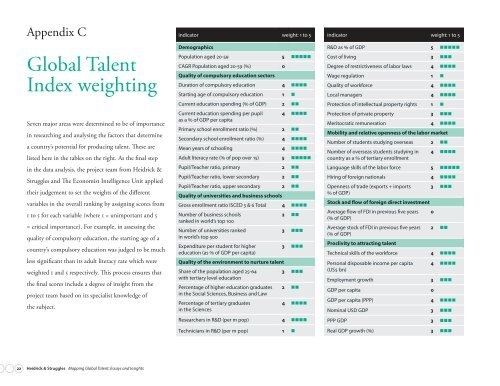
Appendix C<br />
<strong>Global</strong> <strong>Talent</strong><br />
Index weighting<br />
Seven major areas were determined to be of importance<br />
in researching <strong>and</strong> analysing the factors that determine<br />
a country’s potential for producing talent. These are<br />
listed here in the tables on the right. As the final step<br />
in the data analysis, the project team from <strong>Heidrick</strong> &<br />
<strong>Struggles</strong> <strong>and</strong> The Economist Intelligence Unit applied<br />
their judgement to set the weights of the different<br />
variables in the overall ranking by assigning scores from<br />
1 to 5 for each variable (where 1 = unimportant <strong>and</strong> 5<br />
= critical importance). For example, in assessing the<br />
quality of compulsory education, the starting age of a<br />
country’s compulsory education was judged to be much<br />
less significant than its adult literacy rate which were<br />
weighted 1 <strong>and</strong> 5 respectively. This process ensures that<br />
the final scores include a degree of insight from the<br />
project team based on its specialist knowledge of<br />
the subject.<br />
<strong>Heidrick</strong> & <strong>Struggles</strong> <strong>Mapping</strong> <strong>Global</strong> <strong>Talent</strong>: <strong>Essays</strong> <strong>and</strong> <strong>Insights</strong><br />
indicator weight: 1 to 5<br />
Demographics<br />
Population aged 20-59 nnnnn<br />
CAGR Population aged 20-59 (%) 0<br />
Quality of compulsory education sectors<br />
Duration of compulsory education nnnn<br />
Starting age of compulsory education 1 n<br />
Current education spending (% of GDP) nn<br />
Current education spending per pupil<br />
as a % of GDP per capita<br />
Primary school enrollment ratio (%) nn<br />
nnnn<br />
Secondary school enrollment ratio (%) nnnn<br />
Mean years of schooling nnnn<br />
Adult literacy rate (% of pop over 15) nnnnn<br />
Pupil/Teacher ratio, primary nn<br />
Pupil/Teacher ratio, lower secondary nn<br />
Pupil/Teacher ratio, upper secondary nn<br />
Quality of universities <strong>and</strong> business schools<br />
Gross enrollment ratio ISCED 5 & 6 Total nnnn<br />
Number of business schools<br />
ranked in world’s top 100<br />
Number of universities ranked<br />
in world’s top 500<br />
Expenditure per student for higher<br />
education (as % of GDP per capita)<br />
Quality of the environment to nurture talent<br />
Share of the population aged 25-64<br />
with tertiary level education<br />
Percentage of higher education graduates<br />
in the Social Sciences, Business <strong>and</strong> Law<br />
Percentage of tertiary graduates<br />
in the Sciences<br />
nn<br />
nnn<br />
nnn<br />
nnn<br />
nn<br />
nnnn<br />
Researchers in R&D (per m pop) nnnn<br />
Technicians in R&D (per m pop) 1 n<br />
indicator weight: 1 to 5<br />
R&D as % of GDP nnnnn<br />
Cost of living nnn<br />
Degree of restrictiveness of labor laws nnnn<br />
Wage regulation 1 n<br />
Quality of workforce nnnn<br />
Local managers nnnn<br />
Protection of intellectual property rights 1 n<br />
Protection of private property nnn<br />
Meritocratic remuneration nnnn<br />
Mobility <strong>and</strong> relative openness of the labor market<br />
Number of students studying overseas nn<br />
Number of overseas students studying in<br />
country as a % of tertiary enrollment<br />
nnnn<br />
Language skills of the labor force nnnnn<br />
Hiring of foreign nationals nnnn<br />
Openness of trade (exports + imports<br />
% of GDP)<br />
Stock <strong>and</strong> flow of foreign direct investment<br />
Average flow of FDI in previous five years<br />
(% of GDP)<br />
Average stock of FDI in previous five years<br />
(% of GDP)<br />
Proclivity to attracting talent<br />
0<br />
nnn<br />
nn<br />
Technical skills of the workforce nnnn<br />
Personal disposable income per capita<br />
(US$ bn)<br />
nnnn<br />
Employment growth nnn<br />
GDP per capita 0<br />
GDP per capita (PPP) nnnn<br />
Nominal USD GDP nnn<br />
PPP GDP nnn<br />
Real GDP growth (%) nnn