Clinical evaluation of refraction using a handheld wavefront ...
Clinical evaluation of refraction using a handheld wavefront ...
Clinical evaluation of refraction using a handheld wavefront ...

Create successful ePaper yourself
Turn your PDF publications into a flip-book with our unique Google optimized e-Paper software.
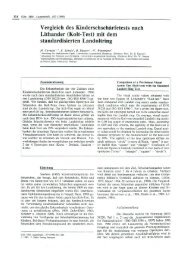
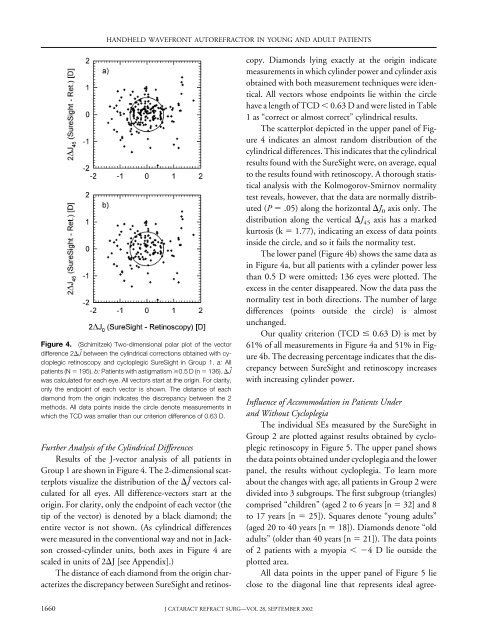
Figure 4. (Schimitzek) Two-dimensional polar plot <strong>of</strong> the vector<br />
difference 2 J between the cylindrical corrections obtained with cycloplegic<br />
retinoscopy and cycloplegic SureSight in Group 1. a: All<br />
patients (N 195). b: Patients with astigmatism 0.5D(n 136). J<br />
was calculated for each eye. All vectors start at the origin. For clarity,<br />
only the endpoint <strong>of</strong> each vector is shown. The distance <strong>of</strong> each<br />
diamond from the origin indicates the discrepancy between the 2<br />
methods. All data points inside the circle denote measurements in<br />
which the TCD was smaller than our criterion difference <strong>of</strong> 0.63 D.<br />
Further Analysis <strong>of</strong> the Cylindrical Differences<br />
Results <strong>of</strong> the J-vector analysis <strong>of</strong> all patients in<br />
Group 1 are shown in Figure 4. The 2-dimensional scatterplots<br />
visualize the distribution <strong>of</strong> the J vectors calculated<br />
for all eyes. All difference-vectors start at the<br />
origin. For clarity, only the endpoint <strong>of</strong> each vector (the<br />
tip <strong>of</strong> the vector) is denoted by a black diamond; the<br />
entire vector is not shown. (As cylindrical differences<br />
were measured in the conventional way and not in Jackson<br />
crossed-cylinder units, both axes in Figure 4 are<br />
scaled in units <strong>of</strong> 2J [see Appendix].)<br />
The distance <strong>of</strong> each diamond from the origin characterizes<br />
the discrepancy between SureSight and retinos-<br />
1660<br />
HANDHELD WAVEFRONT AUTOREFRACTOR IN YOUNG AND ADULT PATIENTS<br />
J CATARACT REFRACT SURG—VOL 28, SEPTEMBER 2002<br />
copy. Diamonds lying exactly at the origin indicate<br />
measurements in which cylinder power and cylinder axis<br />
obtained with both measurement techniques were identical.<br />
All vectors whose endpoints lie within the circle<br />
have a length <strong>of</strong> TCD 0.63 D and were listed in Table<br />
1as“correct or almost correct” cylindrical results.<br />
The scatterplot depicted in the upper panel <strong>of</strong> Figure<br />
4 indicates an almost random distribution <strong>of</strong> the<br />
cylindrical differences. This indicates that the cylindrical<br />
results found with the SureSight were, on average, equal<br />
to the results found with retinoscopy. A thorough statistical<br />
analysis with the Kolmogorov-Smirnov normality<br />
test reveals, however, that the data are normally distributed<br />
(P .05) along the horizontal J 0 axis only. The<br />
distribution along the vertical J 45 axis has a marked<br />
kurtosis (k 1.77), indicating an excess <strong>of</strong> data points<br />
inside the circle, and so it fails the normality test.<br />
The lower panel (Figure 4b) shows the same data as<br />
in Figure 4a, but all patients with a cylinder power less<br />
than 0.5 D were omitted; 136 eyes were plotted. The<br />
excess in the center disappeared. Now the data pass the<br />
normality test in both directions. The number <strong>of</strong> large<br />
differences (points outside the circle) is almost<br />
unchanged.<br />
Our quality criterion (TCD 0.63 D) is met by<br />
61% <strong>of</strong> all measurements in Figure 4a and 51% in Figure<br />
4b. The decreasing percentage indicates that the discrepancy<br />
between SureSight and retinoscopy increases<br />
with increasing cylinder power.<br />
Influence <strong>of</strong> Accommodation in Patients Under<br />
and Without Cycloplegia<br />
The individual SEs measured by the SureSight in<br />
Group 2 are plotted against results obtained by cycloplegic<br />
retinoscopy in Figure 5. The upper panel shows<br />
the data points obtained under cycloplegia and the lower<br />
panel, the results without cycloplegia. To learn more<br />
about the changes with age, all patients in Group 2 were<br />
divided into 3 subgroups. The first subgroup (triangles)<br />
comprised “children” (aged 2 to 6 years [n 32] and 8<br />
to 17 years [n 25]). Squares denote “young adults”<br />
(aged 20 to 40 years [n 18]). Diamonds denote “old<br />
adults” (older than 40 years [n 21]). The data points<br />
<strong>of</strong> 2 patients with a myopia 4 D lie outside the<br />
plotted area.<br />
All data points in the upper panel <strong>of</strong> Figure 5 lie<br />
close to the diagonal line that represents ideal agree-