tsunami inundation maps of whittier and western passage canal ...
tsunami inundation maps of whittier and western passage canal ...
tsunami inundation maps of whittier and western passage canal ...

Create successful ePaper yourself
Turn your PDF publications into a flip-book with our unique Google optimized e-Paper software.
26 Report <strong>of</strong> Investigations 2011-7<br />
A B C<br />
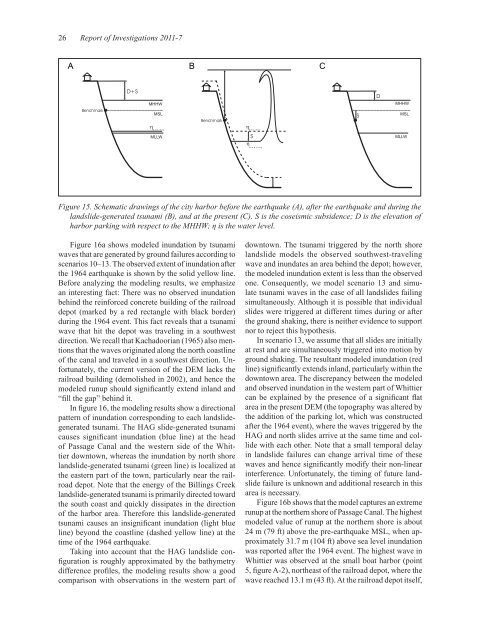
Figure 15. Schematic drawings <strong>of</strong> the city harbor before the earthquake (A), after the earthquake <strong>and</strong> during the<br />
l<strong>and</strong>slide-generated <strong>tsunami</strong> (B), <strong>and</strong> at the present (C). S is the coseismic subsidence; D is the elevation <strong>of</strong><br />
harbor parking with respect to the MHHW; η is the water level.<br />
Figure 16a shows modeled <strong>inundation</strong> by <strong>tsunami</strong><br />
waves that are generated by ground failures according to<br />
scenarios 10–13. The observed extent <strong>of</strong> <strong>inundation</strong> after<br />
the 1964 earthquake is shown by the solid yellow line.<br />
Before analyzing the modeling results, we emphasize<br />
an interesting fact: There was no observed <strong>inundation</strong><br />
behind the reinforced concrete building <strong>of</strong> the railroad<br />
depot (marked by a red rectangle with black border)<br />
during the 1964 event. This fact reveals that a <strong>tsunami</strong><br />
wave that hit the depot was traveling in a southwest<br />
direction. We recall that Kachadoorian (1965) also mentions<br />
that the waves originated along the north coastline<br />
<strong>of</strong> the <strong>canal</strong> <strong>and</strong> traveled in a southwest direction. Unfortunately,<br />
the current version <strong>of</strong> the DEM lacks the<br />
railroad building (demolished in 2002), <strong>and</strong> hence the<br />
modeled runup should signifi cantly extend inl<strong>and</strong> <strong>and</strong><br />
“fi ll the gap” behind it.<br />
In fi gure 16, the modeling results show a directional<br />
pattern <strong>of</strong> <strong>inundation</strong> corresponding to each l<strong>and</strong>slidegenerated<br />
<strong>tsunami</strong>. The HAG slide-generated <strong>tsunami</strong><br />
causes signifi cant <strong>inundation</strong> (blue line) at the head<br />
<strong>of</strong> Passage Canal <strong>and</strong> the <strong>western</strong> side <strong>of</strong> the Whittier<br />
downtown, whereas the <strong>inundation</strong> by north shore<br />
l<strong>and</strong>slide-generated <strong>tsunami</strong> (green line) is localized at<br />
the eastern part <strong>of</strong> the town, particularly near the railroad<br />
depot. Note that the energy <strong>of</strong> the Billings Creek<br />
l<strong>and</strong>slide-generated <strong>tsunami</strong> is primarily directed toward<br />
the south coast <strong>and</strong> quickly dissipates in the direction<br />
<strong>of</strong> the harbor area. Therefore this l<strong>and</strong>slide-generated<br />
<strong>tsunami</strong> causes an insignifi cant <strong>inundation</strong> (light blue<br />
line) beyond the coastline (dashed yellow line) at the<br />
time <strong>of</strong> the 1964 earthquake.<br />
Taking into account that the HAG l<strong>and</strong>slide confi<br />
guration is roughly approximated by the bathymetry<br />
difference pr<strong>of</strong>i les, the modeling results show a good<br />
comparison with observations in the <strong>western</strong> part <strong>of</strong><br />
downtown. The <strong>tsunami</strong> triggered by the north shore<br />
l<strong>and</strong>slide models the observed southwest-traveling<br />
wave <strong>and</strong> inundates an area behind the depot; however,<br />
the modeled <strong>inundation</strong> extent is less than the observed<br />
one. Consequently, we model scenario 13 <strong>and</strong> simulate<br />
<strong>tsunami</strong> waves in the case <strong>of</strong> all l<strong>and</strong>slides failing<br />
simultaneously. Although it is possible that individual<br />
slides were triggered at different times during or after<br />
the ground shaking, there is neither evidence to support<br />
nor to reject this hypothesis.<br />
In scenario 13, we assume that all slides are initially<br />
at rest <strong>and</strong> are simultaneously triggered into motion by<br />
ground shaking. The resultant modeled <strong>inundation</strong> (red<br />
line) signifi cantly extends inl<strong>and</strong>, particularly within the<br />
downtown area. The discrepancy between the modeled<br />
<strong>and</strong> observed <strong>inundation</strong> in the <strong>western</strong> part <strong>of</strong> Whittier<br />
can be explained by the presence <strong>of</strong> a signifi cant fl at<br />
area in the present DEM (the topography was altered by<br />
the addition <strong>of</strong> the parking lot, which was constructed<br />
after the 1964 event), where the waves triggered by the<br />
HAG <strong>and</strong> north slides arrive at the same time <strong>and</strong> collide<br />
with each other. Note that a small temporal delay<br />
in l<strong>and</strong>slide failures can change arrival time <strong>of</strong> these<br />
waves <strong>and</strong> hence signifi cantly modify their non-linear<br />
interference. Unfortunately, the timing <strong>of</strong> future l<strong>and</strong>slide<br />
failure is unknown <strong>and</strong> additional research in this<br />
area is necessary.<br />
Figure 16b shows that the model captures an extreme<br />
runup at the northern shore <strong>of</strong> Passage Canal. The highest<br />
modeled value <strong>of</strong> runup at the northern shore is about<br />
24 m (79 ft) above the pre-earthquake MSL, when approximately<br />
31.7 m (104 ft) above sea level <strong>inundation</strong><br />
was reported after the 1964 event. The highest wave in<br />
Whittier was observed at the small boat harbor (point<br />
5, fi gure A-2), northeast <strong>of</strong> the railroad depot, where the<br />
wave reached 13.1 m (43 ft). At the railroad depot itself,