tsunami inundation maps of whittier and western passage canal ...
tsunami inundation maps of whittier and western passage canal ...
tsunami inundation maps of whittier and western passage canal ...

Create successful ePaper yourself
Turn your PDF publications into a flip-book with our unique Google optimized e-Paper software.
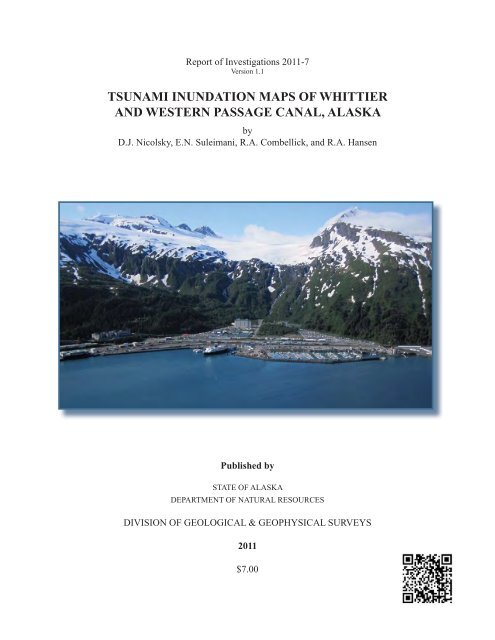
Report <strong>of</strong> Investigations 2011-7<br />
Version 1.1<br />
TSUNAMI INUNDATION MAPS OF WHITTIER<br />
AND WESTERN PASSAGE CANAL, ALASKA<br />
by<br />
D.J. Nicolsky, E.N. Suleimani, R.A. Combellick, <strong>and</strong> R.A. Hansen<br />
Published by<br />
STATE OF ALASKA<br />
DEPARTMENT OF NATURAL RESOURCES<br />
DIVISION OF GEOLOGICAL & GEOPHYSICAL SURVEYS<br />
2011<br />
$7.00
Report <strong>of</strong> Investigations 2011-7<br />
TSUNAMI INUNDATION MAPS OF WHITTIER AND<br />
WESTERN PASSAGE CANAL, ALASKA<br />
by<br />
D.J. Nicolsky, E.N. Suleimani, R.A. Combellick, <strong>and</strong> R.A. Hansen<br />
2011<br />
This DGGS Report <strong>of</strong> Investigations is a fi nal report <strong>of</strong> scientifi c research.<br />
It has received technical review <strong>and</strong> may be cited as an agency publication.<br />
Front photo. Aerial view <strong>of</strong> Whittier, Alaska, looking south over Passage Canal. Photo by Gabriel Wolken.
STATE OF ALASKA<br />
Sean Parnell, Governor<br />
DEPARTMENT OF NATURAL RESOURCES<br />
Daniel S. Sullivan, Commissioner<br />
DIVISION OF GEOLOGICAL & GEOPHYSICAL SURVEYS<br />
Robert F. Swenson, State Geologist <strong>and</strong> Director<br />
Publications produced by the Division <strong>of</strong> Geological & Geophysical Surveys (DGGS) are<br />
available for free download from the DGGS website (www.dggs.alaska.gov). Publications<br />
on hard-copy or digital media can be examined or purchased in the Fairbanks <strong>of</strong>fi ce:<br />
Alaska Division <strong>of</strong> Geological & Geophysical Surveys<br />
3354 College Rd., Fairbanks, Alaska 99709-3707<br />
Phone: (907) 451-5020 Fax (907) 451-5050<br />
dggspubs@alaska.gov<br />
www.dggs.alaska.gov<br />
Alaska State Library Alaska Resource Library & Information<br />
State Offi ce Building, 8th Floor Services (ARLIS)<br />
333 Willoughby Avenue 3150 C Street, Suite 100<br />
Juneau, Alaska 99811-0571 Anchorage, Alaska 99503<br />
Elmer E. Rasmuson Library University <strong>of</strong> Alaska Anchorage Library<br />
University <strong>of</strong> Alaska Fairbanks 3211 Providence Drive<br />
Fairbanks, Alaska 99775-1005 Anchorage, Alaska 99508<br />
ii
CONTENTS<br />
Abstract .........................................................................................................................................................................1<br />
Introduction ..................................................................................................................................................................1<br />
Project background: Regional <strong>and</strong> historical context ..............................................................................................3<br />
Setting .....................................................................................................................................................................3<br />
Tsunami waves in Passage Canal, Alaska, on March 27, 1964 ..............................................................................3<br />
Regional seismotectonics .......................................................................................................................................5<br />
L<strong>and</strong>slide <strong>tsunami</strong> hazard in Passage Canal ...........................................................................................................9<br />
Methodology <strong>and</strong> data .................................................................................................................................................9<br />
Grid development <strong>and</strong> data sources .......................................................................................................................9<br />
Numerical model <strong>of</strong> <strong>tsunami</strong> wave propagation <strong>and</strong> runup .................................................................................13<br />
Numerical model <strong>of</strong> l<strong>and</strong>slide-generated <strong>tsunami</strong> waves .....................................................................................15<br />
Tectonic <strong>tsunami</strong> sources......................................................................................................................................16<br />
Models <strong>of</strong> the 1964 Great Alaska Earthquake ..............................................................................................16<br />
Scenario 1. Repeat <strong>of</strong> the 1964 event: Source function based on coseismic deformation model<br />
by Johnson <strong>and</strong> others (1996) (JDM) ...............................................................................17<br />
Scenario 2. Repeat <strong>of</strong> the 1964 event: Source function based on coseismic deformation model<br />
by Suito <strong>and</strong> Freymueller (2009) (SDM) ..........................................................................17<br />
Models <strong>of</strong> the multi-segment Great Alaska Earthquake ...............................................................................17<br />
Scenario 3. Multi-Segment JDM event: Source function based on extension <strong>of</strong> the JDM...................17<br />
Scenario 4. Multi-Segment SDM event: Source function based on extension <strong>of</strong> the SDM ..................17<br />
Model <strong>of</strong> the Cascadia Subduction Zone Earthquake ...................................................................................17<br />
Scenario 5. Rupture <strong>of</strong> the Cascadia zone, including portions <strong>of</strong> the margin along the British<br />
Columbia <strong>and</strong> northern California shores ........................................................................19<br />
Source Models <strong>of</strong> Hypothetical Tsunamigenic Earthquakes.........................................................................19<br />
Scenario 6. Modifi ed 1964 event: Prince William Sound asperity <strong>of</strong> the Johnson deformation<br />
model (JDM) .....................................................................................................................19<br />
Scenario 7. Modifi ed 1964 event: Kodiak asperity <strong>of</strong> the JDM ...........................................................20<br />
Scenario 8. Modifi ed 1964 event: Prince William Sound asperity <strong>of</strong> the Suito deformation model<br />
(SDM) ...............................................................................................................................20<br />
Scenario 9. Modifi ed 1964 event: Kodiak asperity <strong>of</strong> the SDM ...........................................................20<br />
L<strong>and</strong>slide <strong>tsunami</strong> sources ...................................................................................................................................20<br />
Multiple submarine slope failures in Passage Canal during the 1964 earthquake .......................................20<br />
Scenario 10. Repeat <strong>of</strong> the 1964 event: Major underwater slide complexes <strong>of</strong> the 1964 earthquake—<br />
Harbor, Airport, <strong>and</strong> Glacier (HAG) l<strong>and</strong>slides ...............................................................20<br />
Hypothetical l<strong>and</strong>slide <strong>tsunami</strong> sources ........................................................................................................24<br />
Scenario 11. Hypothetical event: Major underwater slide complex <strong>of</strong>fshore <strong>of</strong> the northern shore<br />
<strong>of</strong> Passage Canal ..............................................................................................................24<br />
Scenario 12. Hypothetical event: Major underwater slide complex <strong>of</strong>fshore <strong>of</strong> the Billings Creek<br />
delta ..................................................................................................................................24<br />
Scenario 13. Hypothetical event: Simultaneous failure <strong>of</strong> underwater slide complexes described by<br />
scenarios 10–12 ................................................................................................................24<br />
Modeling results .........................................................................................................................................................24<br />
Numerical modeling <strong>of</strong> the 1964 <strong>tsunami</strong> in Passage Canal: Model verifi cation ................................................24<br />
Results <strong>of</strong> hypothetical <strong>tsunami</strong> scenarios ...........................................................................................................30<br />
Time series <strong>and</strong> other numerical results ...............................................................................................................30<br />
Sources <strong>of</strong> errors <strong>and</strong> uncertainties ......................................................................................................................36<br />
iii
Summary .....................................................................................................................................................................36<br />
Acknowledgments ......................................................................................................................................................36<br />
References cited ..........................................................................................................................................................36<br />
Appendix A. Time-series diagrams <strong>of</strong> water levels <strong>and</strong> velocities at selected locations ......................................41<br />
Appendix B. Potential rockfall-generated <strong>tsunami</strong> at Whittier, Alaska ...............................................................57<br />
TABLES<br />
Table 1. Nested grids used to compute propagation <strong>of</strong> <strong>tsunami</strong> waves generated in the Gulf <strong>of</strong> Alaska to the<br />
city <strong>of</strong> Whittier ...........................................................................................................................................10<br />
2. Fault parameters for the Yakataga–Yakutat (YY) segment ........................................................................17<br />
FIGURES<br />
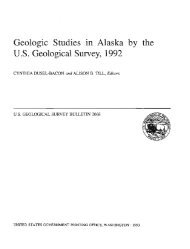
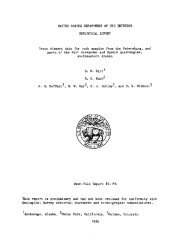
Figure 1. Map <strong>of</strong> south-central Alaska, identifying major faults <strong>and</strong> the rupture zone <strong>of</strong> the 1964 Great Alaska<br />
Earthquake ...................................................................................................................................................2<br />
2. Schematic view <strong>of</strong> the pre-earthquake city infrastructure <strong>and</strong> the extent <strong>of</strong> the 1964 <strong>tsunami</strong>, <strong>and</strong> an<br />
aerial photograph <strong>of</strong> the area in 2004 ..........................................................................................................4<br />
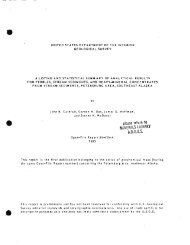
3. Seismicity map <strong>of</strong> south-central Alaska .......................................................................................................6<br />
4. Map <strong>of</strong> south-central Alaska with the rupture zone <strong>of</strong> the 1964 Great Alaska Earthquake <strong>and</strong> divisions<br />
<strong>of</strong> the Alaska–Aleutian megathrust ..............................................................................................................7<br />
5. Map showing the geologic setting <strong>of</strong> the Yakutat block with major faults ..................................................8<br />
6. Telescoping embedded bathymetry/topography grids for numerical modeling <strong>of</strong> <strong>tsunami</strong> propagation<br />
<strong>and</strong> runup ................................................................................................................................................... 11<br />
7. Map showing locations <strong>of</strong> real time kinematic GPS measurements in downtown Whittier <strong>and</strong> airport<br />
areas ...........................................................................................................................................................12<br />
8. Graphs showing measurement <strong>of</strong> sea level <strong>and</strong> predicted water level dynamics in Whittier ....................13<br />
9. Graph showing original <strong>and</strong> corrected digital elevation models (DEMs) <strong>of</strong> the Whittier downtown<br />
area .............................................................................................................................................................14<br />
10. Maps <strong>of</strong> vertical deformation <strong>of</strong> the ocean fl oor corresponding to scenarios 1–9 .....................................18<br />
11. Map <strong>of</strong> Whittier showing pre- <strong>and</strong> post-earthquake bathymetry, wave height <strong>and</strong> direction, <strong>and</strong><br />
submarine l<strong>and</strong>slides <strong>and</strong> pr<strong>of</strong>i les ..............................................................................................................21<br />
12. Pre- <strong>and</strong> post-earthquake bathymetry pr<strong>of</strong>i les along cross-sections A–A’, B–B’, <strong>and</strong> C–C’, shown in<br />
fi gure 11 .....................................................................................................................................................22<br />
13. Digitally edited digital elevation model (DEM) showing elevation in meters above the<br />
pre-earthquake mean lower low water (MLLW) level ...............................................................................23<br />
14. Illustrations showing initial thickness <strong>of</strong> l<strong>and</strong>slides at Harbor–Airport–Glacier (HAG) l<strong>and</strong>slide<br />
complex, <strong>and</strong> locations <strong>and</strong> thicknesses <strong>of</strong> the north shore <strong>and</strong> Billings Creek l<strong>and</strong>slides .......................25<br />
15. Schematic drawings <strong>of</strong> the city harbor before the earthquake, after the earthquake <strong>and</strong> during the<br />
l<strong>and</strong>slide-generated <strong>tsunami</strong>, <strong>and</strong> at the present ........................................................................................26<br />
16. Maps showing maximum computed runup caused by l<strong>and</strong>slide-generated <strong>tsunami</strong> waves in Passage<br />
Canal during the 1964 event ......................................................................................................................27<br />
17. Graph <strong>of</strong> modeled water level dynamics <strong>of</strong> l<strong>and</strong>slide-generated waves at certain locations near the<br />
Whittier waterfront .....................................................................................................................................28<br />
18. Graph <strong>of</strong> modeled water level dynamics at point 20 in the Whittier harbor during the 1964 tectonic<br />
<strong>tsunami</strong> .......................................................................................................................................................29<br />
19. Map showing observed <strong>and</strong> modeled 1964 <strong>inundation</strong> caused by tectonic <strong>and</strong> l<strong>and</strong>slide-generated<br />
waves ..........................................................................................................................................................31<br />
iv
20. Computed water level dynamics <strong>and</strong> <strong>inundation</strong> areas in the Whittier harbor, according to scenarios<br />
1 <strong>and</strong> 3 ........................................................................................................................................................32<br />
21. Map showing maximum computed potential runup by l<strong>and</strong>slide-generated <strong>tsunami</strong> waves in Passage<br />
Canal for scenarios 10–13 ..........................................................................................................................33<br />
22. Map showing modeled potential <strong>inundation</strong> by tectonic <strong>and</strong> l<strong>and</strong>slide-generated waves for selected<br />
scenarios .....................................................................................................................................................34<br />
23. Map showing maximum composite potential <strong>inundation</strong> from tectonic <strong>and</strong> l<strong>and</strong>slide-generated waves<br />
for all scenarios shown in fi gure 21, <strong>and</strong> maximum composite fl ow depths over dry l<strong>and</strong> .......................25<br />
v
Tsunami <strong>inundation</strong> <strong>maps</strong> <strong>of</strong> Whittier <strong>and</strong><br />
<strong>western</strong> Passage Canal, Alaska<br />
by<br />
D.J. Nicolsky 1 , E.N. Suleimani 1 , R.A. Combellick 2 , <strong>and</strong> R.A. Hansen 1<br />
Abstract<br />
The purpose <strong>of</strong> this study is to evaluate potential <strong>tsunami</strong> hazards for the community <strong>of</strong> Whittier <strong>and</strong><br />
<strong>western</strong> Passage Canal area. We numerically model the extent <strong>of</strong> <strong>inundation</strong> due to <strong>tsunami</strong> waves generated<br />
from earthquake <strong>and</strong> l<strong>and</strong>slide sources. Tsunami scenarios include a repeat <strong>of</strong> the <strong>tsunami</strong> triggered<br />
by the 1964 Great Alaska Earthquake, as well as <strong>tsunami</strong> waves generated by a hypothetically extended<br />
1964 rupture, a hypothetical Cascadia megathrust earthquake, hypothetical earthquakes in Prince William<br />
Sound, <strong>and</strong> Kodiak asperities <strong>of</strong> the 1964 rupture. Local underwater l<strong>and</strong>slide events in Passage Canal are<br />
also considered as credible <strong>tsunami</strong>genic scenarios. Results <strong>of</strong> numerical modeling combined with historical<br />
observations in the region are intended to provide guidance to local emergency management agencies in<br />
<strong>tsunami</strong> hazard assessment, evacuation planning, <strong>and</strong> public education for reducing future <strong>tsunami</strong> damage.<br />
INTRODUCTION<br />
Subduction <strong>of</strong> the Pacifi c plate under the North<br />
American plate resulted in numerous great earthquakes<br />
<strong>and</strong> still has the greatest potential to generate <strong>tsunami</strong>s in<br />
Alaska. The Aleutian megathrust (shown in fi g. 1), where<br />
the Pacifi c plate is being subducted, is the most seismically<br />
active <strong>tsunami</strong>genic fault zone in the U.S. Several<br />
historic <strong>tsunami</strong>s that were generated by earthquakes on<br />
the Alaska–Aleutian subduction zone have resulted in<br />
widespread damage <strong>and</strong> loss <strong>of</strong> life after traveling across<br />
the Pacifi c for hours <strong>and</strong> impacting exposed locations<br />
around the ocean. However, <strong>tsunami</strong>s originating in the<br />
vicinity <strong>of</strong> the Alaska Peninsula, Aleutian Isl<strong>and</strong>s, <strong>and</strong><br />
Gulf <strong>of</strong> Alaska are considered to be a near-fi eld hazard<br />
for Alaska, <strong>and</strong> can reach Alaska’s coastal communities<br />
within minutes <strong>of</strong> the earthquake. Saving lives <strong>and</strong><br />
property depends on how well a community is prepared,<br />
which makes it essential to estimate the potential fl ooding<br />
<strong>of</strong> the coastal zone in the event <strong>of</strong> a local or distant<br />
<strong>tsunami</strong>.<br />
On March 27, 1964, the Prince William Sound area<br />
<strong>of</strong> Alaska was struck by the largest earthquake ever<br />
recorded in North America. This M w 9.2 megathrust<br />
earthquake generated the most destructive <strong>tsunami</strong> in<br />
Alaska history <strong>and</strong>, farther south, impacted the west<br />
coast <strong>of</strong> the United States <strong>and</strong> Canada. In addition to the<br />
major tectonic <strong>tsunami</strong> generated by an ocean fl oor displacement<br />
between the trench <strong>and</strong> coastline, more than<br />
20 local <strong>tsunami</strong>s were generated by l<strong>and</strong>slides in coastal<br />
Alaska. They arrived almost immediately after shaking<br />
was felt, leaving no time for warning or evacuation. Of<br />
the 131 fatalities associated with this earthquake, 122<br />
were caused by <strong>tsunami</strong> waves (L<strong>and</strong>er, 1996). Local<br />
<strong>tsunami</strong>s caused most <strong>of</strong> the damage <strong>and</strong> accounted for<br />
76 percent <strong>of</strong> <strong>tsunami</strong> fatalities in Alaska. The city <strong>of</strong><br />
Whittier (shown in fi g. 2), in Passage Canal, greatly suffered<br />
from local l<strong>and</strong>slide-generated waves. Although a<br />
tectonic <strong>tsunami</strong> was not noticed by local residents <strong>and</strong><br />
its effect on the port infrastructure remains unknown, the<br />
town sustained great damage <strong>and</strong> 13 people perished in<br />
the <strong>tsunami</strong>s. Because local l<strong>and</strong>slide-generated <strong>tsunami</strong>s<br />
were responsible for most <strong>of</strong> the damage in Whittier<br />
during the 1964 earthquake, the potential occurrence<br />
<strong>of</strong> similar events must be evaluated for comprehensive<br />
<strong>inundation</strong> mapping <strong>and</strong> for development <strong>of</strong> <strong>tsunami</strong><br />
evacuation <strong>maps</strong>.<br />
The production <strong>of</strong> <strong>tsunami</strong> evacuation <strong>maps</strong> for a<br />
community consists <strong>of</strong> several stages. First, we develop<br />
hypothetical <strong>tsunami</strong> scenarios on the basis <strong>of</strong> credible<br />
potential <strong>tsunami</strong>genic earthquakes <strong>and</strong> submarine<br />
l<strong>and</strong>slides. Then we perform model simulations for<br />
each <strong>of</strong> these scenarios. The results are compared with<br />
any historical <strong>tsunami</strong> observations, if such data exist.<br />
Finally, we develop a “worst case” <strong>inundation</strong> line that<br />
encompasses the maximum extent <strong>of</strong> fl ooding based on<br />
model simulation <strong>of</strong> all source scenarios <strong>and</strong> historical<br />
observations. The “worst case” <strong>inundation</strong> line becomes<br />
a basis for local <strong>tsunami</strong> hazard planning <strong>and</strong> development<br />
<strong>of</strong> evacuation <strong>maps</strong>.<br />
The <strong>tsunami</strong> <strong>inundation</strong> <strong>maps</strong> <strong>of</strong> Whittier <strong>and</strong> Passage<br />
Canal described in this report represent the results<br />
1 Alaska Earthquake Information Center, Geophysical Institute, University <strong>of</strong> Alaska, P.O. Box 757320, Fairbanks, Alaska 99775-7320<br />
2 Alaska Division <strong>of</strong> Geological & Geophysical Surveys, 3354 College Rd., Fairbanks, Alaska 99709-3707
2 Report <strong>of</strong> Investigations 2011-7<br />
140°W<br />
145°W<br />
150°W<br />
155°W<br />
160°W<br />
165°W<br />
170°W<br />
175°W<br />
Tintina<br />
Kaltag<br />
64°N<br />
Denali<br />
Iditarod-Nixon fork<br />
Denali<br />
62°N<br />
Totschunda<br />
Whittier<br />
Lake Clark<br />
Chugach-St. Elias<br />
60°N<br />
Bruin Bay Castle Mnt.<br />
58°N<br />
Aleutian Megathrust<br />
1964 MW9.2<br />
56°N<br />
54°N<br />
miles<br />
0 125<br />
250 kilometers<br />
500<br />
0 125 250 500<br />
Figure 1. Map <strong>of</strong> south-central Alaska identifying major faults (dark purple lines) <strong>and</strong> the rupture zone <strong>of</strong> the 1964 Great Alaska Earthquake (light shaded area).<br />
Red triangles indicate active volcanoes.
<strong>of</strong> the continued collaboration between agencies 3 to<br />
produce <strong>inundation</strong> <strong>maps</strong> for many Alaskan coastal<br />
communities. In this report, we generally provide both<br />
metric <strong>and</strong> imperial units <strong>of</strong> measure. If it is necessary to<br />
quote some existing data, we state the data in the original<br />
<strong>and</strong> metric units <strong>of</strong> measure. Recall that one foot (1 ft)<br />
is approximately 0.305 meters (0.305 m), <strong>and</strong> one mile<br />
(1 mi) is approximately 1.609 kilometers (1.609 km).<br />
PROJECT BACKGROUND: REGIONAL<br />
AND HISTORICAL CONTEXT<br />
SETTING<br />
The port <strong>of</strong> Whittier is near the <strong>western</strong> end <strong>of</strong><br />
Passage Canal, about 60 mi southeast <strong>of</strong> Anchorage at<br />
approximately 60°46’ N latitude <strong>and</strong> 148°41’ W longitude.<br />
The port was built in 1942–1943 to provide an<br />
all-weather terminal for the Alaska Railroad. Since its<br />
construction in the 1940s, Whittier has been a focal point<br />
for the fl ow <strong>of</strong> supplies <strong>and</strong> equipment from tidewater<br />
to Anchorage <strong>and</strong> the interior <strong>of</strong> Alaska. Whittier was<br />
severely damaged by the 1964 earthquake <strong>and</strong> <strong>tsunami</strong><br />
waves. The loss <strong>of</strong> a major port facility, coupled with<br />
destruction <strong>of</strong> those in Seward <strong>and</strong> Valdez, impeded<br />
post-earthquake supply distribution to other earthquakeaffected<br />
areas such as Anchorage <strong>and</strong> Fairbanks<br />
(Kachadoorian, 1965).<br />
The port <strong>of</strong> Whittier has developed considerably<br />
since the 1964 earthquake; its economy is more diversifi<br />
ed <strong>and</strong> includes tourism, commercial fi shing, <strong>and</strong><br />
fi sh processing. Whittier hosts around 45 cruise ship<br />
dockings per year, is a port for the state ferry system<br />
(Alaska Division <strong>of</strong> Community Advocacy, 2005),<br />
<strong>and</strong> its availability as an all-weather port makes it an<br />
important supply center for interior Alaska. Much <strong>of</strong><br />
the state’s economic activity <strong>and</strong> infrastructure are still<br />
located on or near the coast, ports, <strong>and</strong> harbors—areas<br />
inundated in 1964. Figure 2a shows the pre-earthquake<br />
city infrastructure <strong>and</strong> a blue line that marks the observed<br />
<strong>inundation</strong> limit after the 1964 <strong>tsunami</strong>. Docks, railroad,<br />
<strong>and</strong> tourism activities are currently located within the<br />
previous <strong>inundation</strong> area, as shown in fi gure 2b. Many<br />
<strong>of</strong> these facilities have been constructed or relocated<br />
since 1964, <strong>and</strong> the confi guration <strong>of</strong> the shoreline has<br />
changed signifi cantly.<br />
The retreat <strong>of</strong> glaciers that carved Passage Canal left<br />
a steep-walled, U-shaped fjord (bathymetry contours<br />
<strong>of</strong> the <strong>canal</strong> are presented later in the report). The main<br />
Tsunami <strong>inundation</strong> <strong>maps</strong> <strong>of</strong> Whittier <strong>and</strong> <strong>western</strong> Passage Canal, Alaska 3<br />
harbor <strong>and</strong> port facilities are built mostly on the southern<br />
shore <strong>of</strong> Passage Canal on a fan-shaped delta formed<br />
by Whittier Creek. The delta is approximately 3.2 km<br />
(2 mi) wide, 2.4 km (1.5 mi) long, <strong>and</strong> is formed by<br />
unconsolidated deposits <strong>of</strong> outwash <strong>and</strong> stream gravel<br />
(Kachadoorian, 1965). The creek delta slopes fairly<br />
uniformly from sea level to approximately 27.5 m (90 ft)<br />
in elevation. The head <strong>of</strong> Passage Canal is a low-lying<br />
deltaic area with a width <strong>of</strong> about 3.7 km (2.3 mi) <strong>and</strong><br />
length 3.7 km (2.3 mi); the seaward slope is approximately<br />
26 m/ km (140 ft/mi). In the southern part <strong>of</strong><br />
this lowl<strong>and</strong>, several creeks fl ow into the ocean from<br />
Portage Pass, Shakespeare Glacier, <strong>and</strong> Learnard Glacier.<br />
When Learnard Glacier retreated, it left a moraine with<br />
irregular, hummocky topography at the northern part<br />
<strong>of</strong> the lowl<strong>and</strong>.<br />
TSUNAMI WAVES IN PASSAGE CANAL,<br />
ALASKA, ON MARCH 27, 1964<br />
The following account <strong>of</strong> the <strong>tsunami</strong> waves at Whittier<br />
is taken from Kachadoorian (1965) unless otherwise<br />
noted. The M w 9.2 Alaska earthquake <strong>of</strong> March 27, 1964,<br />
at Whittier was characterized by strong ground motion<br />
generally in an east–west direction, although some<br />
residents stated that the motion was in a north-northwest–south-southeast<br />
direction. The seismic motion<br />
accelerated to its maximum intensity in about one-half<br />
minute, maintained its strength for one <strong>and</strong> one-half<br />
minutes, <strong>and</strong> then gradually subsided. Eyewitnesses who<br />
were on the bedrock reported that the motion was <strong>of</strong> a<br />
jarring type, while the ones located on unconsolidated<br />
sediments described the motion as a rolling or “round<strong>and</strong>-round”<br />
type. The post-earthquake studies by the<br />
U.S. Geological Survey (USGS) determined that the<br />
l<strong>and</strong> subsided in Whittier by 1.6 m (5.3 ft), <strong>and</strong> the l<strong>and</strong><br />
shifted laterally by about 8.2 m (27 ft), almost transverse<br />
to Passage Canal, in a southeast direction (Wilson <strong>and</strong><br />
Tørum, 1972).<br />
Whittier, unlike many coastal communities damaged<br />
by the 1964 earthquake, had a limited record <strong>of</strong> <strong>tsunami</strong><br />
waves on marigrams. The sequence <strong>of</strong> waves in Passage<br />
Canal was reconstructed from observations provided by<br />
eyewitnesses. We note that for these reasons there are<br />
inherent uncertainties in estimates <strong>of</strong> wave time arrivals<br />
<strong>and</strong> wave heights.<br />
At least three waves were observed during the earthquake<br />
or immediately after it (Kachadoorian, 1965). A<br />
minute after the shaking began, a glassy wave, containing<br />
no debris, apparently no suspended sediment, <strong>and</strong><br />
traces <strong>of</strong> turbulence, rose to the altitude 4 <strong>of</strong> 7.6 m (25 ft)<br />
3 To help mitigate the hazard that earthquakes <strong>and</strong> <strong>tsunami</strong>s pose to Alaska coastal communities, the Alaska Tsunami Mapping Team<br />
(ATMT) was created. It consists <strong>of</strong> personnel from the Geophysical Institute at the University <strong>of</strong> Alaska Fairbanks <strong>and</strong> from the<br />
State <strong>of</strong> Alaska Division <strong>of</strong> Geological & Geophysical Surveys. The ATMT participates in the National Tsunami Hazard Mitigation<br />
Program by evaluating <strong>and</strong> mapping potential <strong>inundation</strong> <strong>of</strong> selected parts <strong>of</strong> the Alaska coastline using numerical <strong>tsunami</strong> modeling.<br />
4 Unless otherwise noted, altitudes are based on a pre-earthquake datum <strong>and</strong> do not refl ect the 1.6 m (5.3 ft) regional subsidence <strong>of</strong> the<br />
Whittier area during the earthquake. Datum for subaerial contours is mean sea level (MSL). For example, a 12.2 m (40 ft) wave has an<br />
altitude <strong>of</strong> 10.6 m (34.7 ft) because the earthquake occurred at a 0.3 m (1 ft) tide, or 1.6 m (5.3 ft) below the MSL (Kachadoorian, 1965).
A<br />
B<br />
Figure 2. (A) Schematic view <strong>of</strong> the pre-earthquake city infrastructure <strong>and</strong> the extent <strong>of</strong> the 1964 <strong>tsunami</strong> (adopted from Kachadoorian,<br />
1965, plate 1). The blue line indicates the observed extent <strong>of</strong> the <strong>tsunami</strong> <strong>inundation</strong>. (B) The 2004 aerial photography <strong>of</strong> Whittier<br />
reveals that most <strong>of</strong> the tourist attractions are within the 1964 <strong>inundation</strong> zone.
above sea level, which at that time was 0.3 m (1 ft) above<br />
the mean lower low water (MLLW) level. The wave rose<br />
rapidly <strong>and</strong> immediately receded. Then, a minute to a<br />
minute <strong>and</strong> one-half later, a muddy 12.2-m (40-ft)-high<br />
breaking wave inundated the port facilities <strong>and</strong> ran up to<br />
an elevation <strong>of</strong> 10.7 m (35 ft), approximately 2.7 m (9 ft)<br />
above the ground level at the Alaska Railroad depot. The<br />
third wave hit the town approximately 45 seconds after<br />
the second one, <strong>and</strong> was a breaking wave <strong>and</strong> similar<br />
in nature to the second wave, except its amplitude was<br />
smaller, reaching an elevation <strong>of</strong> 9.2 m (30 ft) near the<br />
depot. There are no eyewitnesses to waves that struck the<br />
shore at other locations along Passage Canal. However,<br />
the <strong>inundation</strong> line was clearly evident from scattered<br />
debris <strong>and</strong> marks on fresh snow. The most elevated location<br />
that was inundated by waves was 31.7 m (104 ft)<br />
above mean sea level (MSL), along the northern shore<br />
<strong>of</strong> Passage Canal. Near the airstrip, the wave topped<br />
6.1 m (20 ft) altitude, while one-quarter mile north the<br />
<strong>inundation</strong> line was at 25 m (82 ft) elevation. In Whittier,<br />
the maximum altitude reached by the wave was 13.1 m<br />
(43 ft) at the small boat harbor northeast <strong>of</strong> the Alaska<br />
Railroad depot. On the waterfront area waves reached<br />
the altitude <strong>of</strong> 7.9 m (26 ft).<br />
Unlike residents <strong>of</strong> Valdez <strong>and</strong> Cordova, who observed<br />
high waves late in the evening, Whittier residents<br />
noticed no ‘strange’ waves in Passage Canal other than<br />
the three that struck during <strong>and</strong> immediately after the<br />
earthquake. The tectonic <strong>tsunami</strong>, which should have<br />
arrived in Whittier no later than one hour after the<br />
earthquake, was probably not observed <strong>and</strong> its damage<br />
to the port <strong>of</strong> Whittier remains unknown. There are<br />
several plausible explanations for water dynamics in<br />
Passage Canal during the shaking <strong>and</strong> immediately after<br />
it. Kachadoorian (1965) argued that the observed ‘glassy<br />
hump’ <strong>of</strong> water was caused by a submarine l<strong>and</strong>slide.<br />
However, the presented explanation <strong>of</strong> the secondary<br />
wave—that it was generated when a l<strong>and</strong>slide came to<br />
rest in the middle <strong>of</strong> Passage Canal—is arguable because<br />
<strong>of</strong> the assumed vertical water velocity. Later, Wilson <strong>and</strong><br />
Tørum (1968) considered a resonant trinodal seiche,<br />
caused by an inertial effect <strong>of</strong> the water as Passage<br />
Canal was suddenly pushed against it. Although this<br />
hypothesis is plausible, the lateral l<strong>and</strong> motion requires<br />
specifi c dynamics that match certain resonance periods.<br />
Although it is diffi cult to qualify the fi rst observed wave,<br />
there is a general agreement that the second <strong>and</strong> third<br />
waves were l<strong>and</strong>slide-generated. The l<strong>and</strong>slides occurred<br />
in delta sediments at the head <strong>of</strong> Passage Canal, in delta<br />
sediments <strong>and</strong> fi ll at the Whittier waterfront, <strong>and</strong> possibly<br />
in a submarine lateral moraine along the northern<br />
shore <strong>of</strong> Passage Canal. It is highly probable that these<br />
l<strong>and</strong>slides did not occur simultaneously, but rather at two<br />
or three different times during the earthquake.<br />
Tsunami <strong>inundation</strong> <strong>maps</strong> <strong>of</strong> Whittier <strong>and</strong> <strong>western</strong> Passage Canal, Alaska 5<br />
At the time <strong>of</strong> the earthquake only 70 people were<br />
living in Whittier, <strong>and</strong> 13 <strong>of</strong> them perished during the<br />
<strong>tsunami</strong>. Waves completely destroyed the small boat<br />
harbor, stub pier, car-barge slip dock, U.S. Army storage<br />
tanks, a lumber camp (12 <strong>of</strong> the 13 dead were in the<br />
lumber camp), <strong>and</strong> damaged the FAA station, airstrip,<br />
highway, <strong>and</strong> railroad bridges spanning Whittier Creek.<br />
According to Kachadoorian (1965), the total damage to<br />
the federal <strong>and</strong> private enterprises in Whittier was in<br />
excess <strong>of</strong> $5 million in 1964 dollars 5 . Higher estimates<br />
<strong>of</strong> damage were derived by Tudor (1964), who estimated<br />
that the <strong>tsunami</strong>s at Whittier were responsible for about<br />
$10 million. Relative to its population, Whittier must<br />
be considered to have sustained the heaviest damage<br />
among all Alaska communities that were affected by<br />
the 1964 earthquake.<br />
REGIONAL SEISMOTECTONICS<br />
Passage Canal is on the northeastern shore <strong>of</strong> the<br />
Kenai Peninsula, near a plate boundary where the Pacifi c<br />
<strong>and</strong> North American plates converge along the Aleutian<br />
Megathrust (DeMets <strong>and</strong> others, 1990; Page <strong>and</strong> others,<br />
1991). Whittier is in the northeast section <strong>of</strong> the Aleutian<br />
Megathrust, where the megathrust is strongly coupled<br />
<strong>and</strong> has a shallow dip angle <strong>of</strong> about 7 degrees. This<br />
area has produced some <strong>of</strong> the largest earthquakes in the<br />
world, such as the M w 9.2 Great Alaska Earthquake <strong>of</strong><br />
1964 that caused 285,000 km 2 area <strong>of</strong> surface deformation<br />
(Plafker, 1969).<br />
Figure 3 shows pre- <strong>and</strong> post-1964 seismic activity<br />
in south-central Alaska with locations determined by<br />
the Alaska Earthquake Information Center (AEIC) at<br />
the University <strong>of</strong> Alaska Fairbanks. Doser <strong>and</strong> Brown<br />
(2001) fi nd that the central <strong>and</strong> southern Kenai Peninsula<br />
has been seismically quiet at the M w >5 level since the<br />
1964 event, while the Prince William Sound area has<br />
continued to experience seismic activity similar to its<br />
history prior to the 1964 earthquake. The events with<br />
moment magnitude less than 5 are shown as dots <strong>and</strong><br />
color coded according to depth. Prior to installation <strong>of</strong><br />
the seismic network in Alaska in the early 1970s, only<br />
larger events with M w ≥6 could be reliably located. Since<br />
the installation <strong>of</strong> the network, events <strong>of</strong> much smaller<br />
magnitude have been regularly located.<br />
According to the segmentation model <strong>of</strong> Nishenko<br />
<strong>and</strong> Jacob (1990), south-central Alaska includes three<br />
segments <strong>of</strong> the megathrust: the Yakataga–Yakutat (YY),<br />
Prince William Sound (PWS), <strong>and</strong> Kodiak Isl<strong>and</strong> (KI)<br />
segments, all shown in fi gure 4. Using seismic wavefront<br />
data, Christensen <strong>and</strong> Beck (1994) show that there were<br />
two areas <strong>of</strong> high moment release, representing the two<br />
major asperities <strong>of</strong> the 1964 rupture zone: the Prince Wil-<br />
5 $1.00 in 1964 had about the same buying power as $6.99 in 2010.
6 Report <strong>of</strong> Investigations 2011-7<br />
liam Sound asperity with an average slip <strong>of</strong> 18 m (59 ft),<br />
<strong>and</strong> the Kodiak asperity with an average slip <strong>of</strong> 10 m<br />
(33 ft). Analysis <strong>of</strong> historical earthquake data in PWS<br />
<strong>and</strong> KI segments (Nishenko <strong>and</strong> Jacob, 1990) showed<br />
that the KI segment produced signifi cant megathrust<br />
earthquakes more frequently <strong>and</strong> also independently <strong>of</strong><br />
the PWS segment. Paleoseismic data also show that the<br />
KI segment ruptured independently in a large earthquake<br />
about 500 years ago, about 360 years more recently than<br />
<br />
<br />
<br />
<br />
<br />
<br />
Background seismicity, depth<br />
0-33 km<br />
33-75 km<br />
75-125 km<br />
125+ km<br />
<br />
Anchorage<br />
<br />
Whittier<br />
Seward<br />
the penultimate great earthquake that ruptured both the<br />
KI <strong>and</strong> PWS segments (Carver <strong>and</strong> Plafker, 2008).<br />
The results <strong>of</strong> joint inversion <strong>of</strong> <strong>tsunami</strong> <strong>and</strong> geodetic<br />
data from the 1964 earthquake (Johnson <strong>and</strong> others,<br />
1996) also suggest the division <strong>of</strong> the rupture zone into<br />
two different segments. These segments have different<br />
recurrence intervals, with estimates <strong>of</strong> the recurrence<br />
interval for the KI segment being as low as 60 years<br />
(Johnson <strong>and</strong> others, 1996). On the basis <strong>of</strong> all published<br />
Valdez<br />
7 <strong>and</strong> above 5 to 6.9<br />
145<br />
Cordova<br />
<br />
Before 3/27/1964<br />
After 1/1/1965<br />
Figure 3. Earthquakes in south-central Alaska, from the Alaska Earthquake Information Center catalog. Small<br />
dots (barely visible) correspond to earthquakes with magnitude less than 5. Medium circles show signifi cant<br />
earthquakes (magnitude 5 <strong>and</strong> greater) <strong>and</strong> large circles show powerful earthquakes before (purple) <strong>and</strong> after<br />
(light blue) the Great Alaska Earthquake <strong>of</strong> March 27, 1964. The main shock <strong>and</strong> aftershocks <strong>of</strong> that event are<br />
not included in the plot.
paleoseismic data for the region, Carver <strong>and</strong> Plafker<br />
(2008) calculate that the median intervals between the<br />
past eight great earthquakes in the PWS segment <strong>of</strong><br />
the eastern Aleutian seismic zone range from 333 to<br />
875 years, <strong>and</strong> average 589 years.<br />
The Yakataga–Yakutat area at the eastern end <strong>of</strong><br />
the megathrust is a complex collision zone where the<br />
Yakutat microplate moves northwest toward central<br />
Alaska at 48 mm/yr (Carver <strong>and</strong> Plafker, 2008). This<br />
segment translates the predominantly strike-slip motion<br />
on its eastern side to a shallow-dipping subduction on<br />
its west side (Nishenko <strong>and</strong> Jacob, 1990). The southern<br />
<strong>and</strong> eastern boundaries <strong>of</strong> the Yakutat block are well<br />
defi ned, but a collection <strong>of</strong> distributed fold <strong>and</strong> thrust<br />
zones, splay faults, <strong>and</strong> mountain-building regions complicates<br />
the northern <strong>and</strong> <strong>western</strong> edges <strong>of</strong> the block, as<br />
shown in fi gure 5. We note that the interaction between<br />
the Yakutat block <strong>and</strong> the Pacifi c <strong>and</strong> North American<br />
plates is complex <strong>and</strong> poorly understood. Plafker <strong>and</strong><br />
Thatcher (2008) reevaluated the mechanisms <strong>of</strong> the two<br />
great Yakutat Bay earthquakes <strong>of</strong> September 1899 <strong>and</strong><br />
showed that coseismic deformation was onshore uplift,<br />
explaining the absence <strong>of</strong> a <strong>tsunami</strong> in the Gulf <strong>of</strong> Alaska.<br />
There were, however, several local <strong>tsunami</strong>s observed in<br />
<br />
<br />
<br />
<br />
<br />
Tsunami <strong>inundation</strong> <strong>maps</strong> <strong>of</strong> Whittier <strong>and</strong> <strong>western</strong> Passage Canal, Alaska 7<br />
bays <strong>and</strong> fjords that were triggered by submarine slides<br />
<strong>and</strong> collapses <strong>of</strong> glacier walls. Plafker <strong>and</strong> Thatcher<br />
(2008) conclude that the 1899 earthquake sequence<br />
most likely did not rupture through the <strong>of</strong>fshore portion<br />
<strong>of</strong> the Yakataga seismic gap, a region between the 1964<br />
rupture area <strong>and</strong> the focal area <strong>of</strong> the 1899 earthquakes.<br />
This fi nding suggests that the YY segment has a high<br />
potential for a future <strong>tsunami</strong>genic earthquake.<br />
In a paleoseismic study <strong>of</strong> regional l<strong>and</strong> subsidence<br />
at Kenai Peninsula sites, Hamilton <strong>and</strong> Shennan<br />
(2005) estimated coseismic subsidence during the 1964<br />
earthquake <strong>and</strong> two earlier events. It was shown that the<br />
earthquake dated to 1,500–1,400 years BP produced<br />
more than twice the subsidence caused by the 1964<br />
earthquake. By comparing the Kenai Peninsula sites<br />
with other sites around Cook Inlet, the authors fi nd that<br />
each <strong>of</strong> the three great earthquakes in the study had a<br />
different pattern <strong>of</strong> coseismic subsidence. Recent work<br />
by Shennan <strong>and</strong> others (2008) tests the hypothesis that in<br />
some seismic cycles, megathrust segments can, as proposed<br />
in the segmentation model by Nishenko <strong>and</strong> Jacob<br />
(1990), rupture simultaneously to produce earthquakes<br />
greater than any in recorded history. Shennan <strong>and</strong> others<br />
(2008) present geologic evidence <strong>of</strong> six prehistoric<br />
<br />
KI<br />
1964 rupture area<br />
Anchorage<br />
Whittier<br />
Seward<br />
PWS<br />
Figure 4. Map <strong>of</strong> south-central Alaska with the rupture zone <strong>of</strong> the 1964 Great Alaska Earthquake <strong>and</strong> segments <strong>of</strong><br />
the Alaska–Aleutian megathrust: the Prince William Sound (PWS), Kodiak Isl<strong>and</strong> (KI) <strong>and</strong> Yakataga–Yakutat<br />
(YY) segments. Stars indicate epicenters <strong>of</strong> two earthquakes <strong>of</strong> September 1899.<br />
Valdez<br />
Gulf <strong>of</strong> Alaska<br />
YY
-140°<br />
-144°<br />
-148°<br />
Whittier<br />
8 Report <strong>of</strong> Investigations 2011-7<br />
Prince<br />
William<br />
Sound<br />
Montague<br />
Isl<strong>and</strong><br />
60°<br />
Malaspina fault<br />
Gulf <strong>of</strong> Alaska<br />
Patton Bay fault<br />
Yakutat terrane<br />
Explanation<br />
Terrane-bounding thrust faults<br />
58°<br />
Neogene thrust faults<br />
Approximately located faults<br />
P a c i f i c O c e a n<br />
A l e u t i a n M e g a t h r u s t<br />
Inferred or concealed faults<br />
Terrane-bounding strike-slip<br />
faults showing sense <strong>of</strong> slip<br />
miles<br />
0 25<br />
50 100<br />
kilometers<br />
0 25 50 100<br />
Yakutat terrane<br />
Figure 5. Geologic setting <strong>of</strong> the Yakutat block with major faults, from Plafker <strong>and</strong> Thatcher (2008).
major <strong>tsunami</strong>genic earthquakes in the Kenai Peninsula<br />
area <strong>of</strong> south-central Alaska in the past 4,000 years<br />
based on radiocarbon ages <strong>of</strong> tidal marsh deposits in<br />
Girdwood. Their paper presents paleoseismic evidence<br />
that earthquakes approximately 900 <strong>and</strong> 1,500 years BP<br />
simultaneously ruptured three adjacent segments <strong>of</strong> the<br />
Aleutian Megathrust: the PWS <strong>and</strong> KI segments, <strong>and</strong> the<br />
Yakutat microplate (the YY segment). The rupture area<br />
<strong>of</strong> these earthquakes was estimated to be 23,000 km 2<br />
greater than that <strong>of</strong> the M w 9.2 Great Alaska Earthquake<br />
<strong>of</strong> 1964, <strong>and</strong> with a 15 percent larger seismic moment.<br />
This demonstrates that an underst<strong>and</strong>ing <strong>of</strong> the most<br />
recent great earthquakes in the area is insuffi cient for<br />
comprehensive <strong>tsunami</strong> hazard assessment in southcentral<br />
Alaska, <strong>and</strong> that detailed studies <strong>of</strong> multiple great<br />
earthquakes are required. We develop several hypothetical<br />
<strong>tsunami</strong>genic earthquake models <strong>and</strong> describe them<br />
later in the text. For each model we perform a numerical<br />
modeling experiment to estimate the impact <strong>of</strong> <strong>tsunami</strong><br />
waves on Whittier.<br />
LANDSLIDE TSUNAMI HAZARD IN<br />
PASSAGE CANAL<br />
Tsunamis caused by submarine slope failures are a<br />
serious hazard in glacial fjords such as Passage Canal.<br />
Massive underwater slope failures typically generate<br />
large waves that are usually observed while the ground is<br />
still shaking. A primary reason for submarine l<strong>and</strong>slides<br />
is the accumulation <strong>of</strong> sediments on steep underwater<br />
slopes. Recent results <strong>of</strong> sediment chemistry monitoring<br />
in Port Valdez, located in a glacial fjord similar to Passage<br />
Canal, demonstrated high sediment accumulation<br />
rates <strong>of</strong> about 15 mm (0.6 in) per year at the head <strong>of</strong><br />
Valdez Bay (Savoie <strong>and</strong> others, 2006). During an earthquake,<br />
dynamic forces imposed by seismic accelerations<br />
add to the gravitational force <strong>and</strong> consequently cause<br />
sliding <strong>of</strong> the unconsolidated sediments (Hampton <strong>and</strong><br />
others, 2002). Lemke (1967), Wilson <strong>and</strong> Tørum (1968),<br />
Plafker <strong>and</strong> others (1969), <strong>and</strong> Shannon <strong>and</strong> Hilts (1973)<br />
conducted geologic investigations after the 1964 earthquake<br />
in numerous locations around south-central <strong>and</strong><br />
southeastern Alaska. From these studies, we conclude<br />
that the major factors contributing to the total volume<br />
<strong>and</strong> aerial extent <strong>of</strong> the slide material are the duration <strong>of</strong><br />
ground motion, the confi guration <strong>of</strong> underwater slopes,<br />
<strong>and</strong> the type <strong>of</strong> sediment forming these slopes—unconsolidated<br />
or fi ne-grained materials. Hampton <strong>and</strong> others<br />
(1996) add that high artesian pressure within aquifers <strong>of</strong><br />
the delta, combined with the extra load caused by waterfront<br />
artifi cial fi ll associate with shoreline development,<br />
also contributes to the slope failures. Further, Bornhold<br />
<strong>and</strong> others (2001) identify earthquakes, extreme low<br />
tides, <strong>and</strong> construction activities in ports <strong>and</strong> harbors as<br />
the most common triggering mechanisms for underwater<br />
slope failures.<br />
Tsunami <strong>inundation</strong> <strong>maps</strong> <strong>of</strong> Whittier <strong>and</strong> <strong>western</strong> Passage Canal, Alaska 9<br />
Kulikov <strong>and</strong> others (1998) analyze <strong>tsunami</strong> catalog<br />
data for the north Pacifi c coast <strong>and</strong> show that southcentral<br />
<strong>and</strong> southeastern Alaska have a long recorded<br />
history <strong>of</strong> <strong>tsunami</strong> waves generated by submarine <strong>and</strong><br />
subaerial l<strong>and</strong>slides, avalanches, <strong>and</strong> rockfalls. The authors<br />
also found, in the majority <strong>of</strong> cases, that tectonic<br />
<strong>tsunami</strong>s arriving in bays <strong>and</strong> fjords from the open ocean<br />
had relatively small wave height, but a great number <strong>of</strong><br />
local l<strong>and</strong>slide-generated <strong>tsunami</strong>s had much larger wave<br />
height. For example, the l<strong>and</strong>slide-generated <strong>tsunami</strong><br />
in Whittier caused severe damage while the tectonic<br />
<strong>tsunami</strong> was not even noticed.<br />
Bornhold <strong>and</strong> others (2001) address the problem <strong>of</strong><br />
estimating the hazard <strong>of</strong> l<strong>and</strong>slide-generated <strong>tsunami</strong><br />
waves for British Columbia <strong>and</strong> Alaska coasts. Such<br />
estimation for a coastal community requires assessment<br />
<strong>of</strong> locations <strong>of</strong> potential underwater failures <strong>and</strong><br />
the physical parameters <strong>of</strong> the underwater materials.<br />
The most probable locations <strong>of</strong> unstable sediment accumulations<br />
in the <strong>western</strong> part <strong>of</strong> Passage Canal are the<br />
slopes <strong>of</strong> the Whittier Creek delta, the moraine deposits<br />
at the head <strong>of</strong> the <strong>canal</strong> <strong>and</strong> along the northern coast, <strong>and</strong><br />
artifi cial fi lls in the harbor area. Bornhold <strong>and</strong> others<br />
(2001) outline specifi c features for long-term prediction<br />
<strong>of</strong> l<strong>and</strong>slide-generated <strong>tsunami</strong>s at selected sites, <strong>and</strong><br />
develop a long-term approach for estimating potential<br />
<strong>tsunami</strong> <strong>inundation</strong>. The approach consists <strong>of</strong> two<br />
steps. First, it is necessary to analyze historical events<br />
<strong>and</strong> compare modeling results with observations at the<br />
physical site, <strong>and</strong> then simulate hypothetical <strong>tsunami</strong><br />
scenarios. We follow Bornhold <strong>and</strong> others (2001) <strong>and</strong><br />
employ their methodology to estimate the local <strong>tsunami</strong><br />
hazard at Whittier.<br />
METHODOLOGY AND DATA<br />
GRID DEVELOPMENT AND DATA<br />
SOURCES<br />
One <strong>of</strong> the challenges in <strong>tsunami</strong> modeling is that<br />
the governing equations for water dynamics are continuous.<br />
In this work, we discretize the shallow water<br />
equations in spherical coordinates on Arakawa C-grid<br />
using a fi nite difference method. To resolve a wave,<br />
the grid must be fi ne enough, with at least four points<br />
per wavelength (Titov <strong>and</strong> Synolakis, 1995), however,<br />
more points than that are <strong>of</strong>ten necessary to achieve<br />
satisfactory accuracy (for example, Titov <strong>and</strong> Synolakis,<br />
1997). To compute a detailed map <strong>of</strong> potential <strong>tsunami</strong><br />
<strong>inundation</strong> triggered by local <strong>and</strong> distant earthquakes,<br />
we employ a series <strong>of</strong> nested computational grids. A<br />
nested grid allows for higher resolution in areas where<br />
it is needed, without expending computer resources in<br />
areas where it is not. The bathymetric <strong>and</strong> topographic<br />
relief in each nested grid is based on digital elevation<br />
models (DEMs) developed at the National Geophysical
10 Report <strong>of</strong> Investigations 2011-7<br />
Data Center (NGDC), National Oceanic & Atmospheric<br />
Administration (NOAA), in Boulder, Colorado. The<br />
extent <strong>of</strong> each grid used for Whittier mapping is shown<br />
in fi gure 6 <strong>and</strong> listed in table 1. The coarsest grid, whose<br />
resolution is 2-arc-minute, or approximately 2 km, spans<br />
the central <strong>and</strong> northern Pacifi c Ocean, while the highest<br />
resolution grid is localized near Passage Canal, including<br />
Shotgun Cove <strong>and</strong> a part <strong>of</strong> Blackstone Bay. The spatial<br />
resolution <strong>of</strong> the high-resolution grid satisfi es NOAA<br />
minimum recommended requirements for computation<br />
<strong>of</strong> <strong>tsunami</strong> <strong>inundation</strong> (National Tsunami Hazard Mapping<br />
Program [NTHMP], 2010).<br />
The bathymetry data for the 2-arc-minute resolution<br />
grid, whose extent is shown in fi gure 6, is extracted from<br />
the ETOPO2 data set (NOAA, National Geophysical<br />
Data Center). To develop 15m, 8/3-, 8- <strong>and</strong> 24- arcsecond<br />
resolution grids, shoreline, bathymetric, <strong>and</strong><br />
topographic digital datasets were obtained from several<br />
U.S. federal <strong>and</strong> academic agencies, including: NOAA’s<br />
National Ocean Service (NOS), Offi ce <strong>of</strong> Coast Survey,<br />
<strong>and</strong> NGDC; the U.S. Fish <strong>and</strong> Wildlife Service (FWS);<br />
the U.S. Geological Survey (USGS); <strong>and</strong> the U.S. Army<br />
Corps <strong>of</strong> Engineers (USACE). All data were shifted to<br />
World Geodetic System 1984 (WGS 84) horizontal <strong>and</strong><br />
Mean Higher High Water (MHHW) vertical datums. The<br />
FWS statewide Alaska digital coastline was employed<br />
to create a coastline <strong>of</strong> the Prince William Sound region.<br />
Bathymetric datasets used in the compilation <strong>of</strong> the<br />
Prince William Sound DEMs included NOS hydrographic<br />
surveys, a recent USACE harbor survey, NOAA<br />
Electronic Navigational Charts, multibeam swath sonar<br />
surveys, <strong>and</strong> NGDC trackline surveys. Topographic datasets<br />
<strong>of</strong> Prince William Sound were obtained from the<br />
USGS National Elevation Dataset 2-arc-second gridded<br />
topography <strong>and</strong> 1-arc-second NASA Space Shuttle Radar<br />
Topography. The data sources <strong>and</strong> methodology used<br />
to develop high resolution, 8/3-, 8-, <strong>and</strong> 24-arc-second<br />
DEMs are described in great detail by Caldwell <strong>and</strong><br />
others (2009); Lim <strong>and</strong> others (2009).<br />
Accuracy <strong>of</strong> the high-resolution DEM developed by<br />
NOAA is determined by the topographic datasets with<br />
the vertical accuracy <strong>of</strong> 10–15 m(33–50 ft) (Caldwell<br />
<strong>and</strong> others, 2009). Since the DEM can posses large vertical<br />
errors near the shoreline, prediction <strong>of</strong> the potential<br />
<strong>inundation</strong> can be inaccurate. Hence, the topographic<br />
datasets are augmented with high-accuracy data, that is, a<br />
real time kinematic (RTK) GPS survey within the harbor<br />
area <strong>and</strong> along near-shore areas in Whittier. The survey<br />
was conducted November 13–14, 2009, <strong>and</strong> locations<br />
<strong>of</strong> the GPS measurements are shown as red triangles in<br />
fi gure 7. The collected GPS measurements had 0.03–0.05<br />
m (1.2–2 in) lateral <strong>and</strong> vertical accuracy with respect to<br />
the so-called base station (Leica Geosystem AG, 2002).<br />
Therefore, to achieve sub-meter accuracy <strong>of</strong> all GPS<br />
measurements with respect to the MHHW datum, the<br />
relative position <strong>of</strong> the base station must be determined<br />
with respect to the MHHW datum with sub-meter accuracy.<br />
Such base-station accuracy can be achieved if<br />
the base station is located at a well known benchmark<br />
or monument. Since access to the benchmark in Whittier<br />
was restricted, we used the following technique to<br />
establish the vertical datum.<br />
During the survey, at some partially enclosed locations,<br />
such as the small boat harbor, where the water<br />
level was relatively constant, we took GPS measurements<br />
<strong>of</strong> the sea surface height, schematically shown<br />
by the red arrow in fi gure 8a. Sea level was measured at<br />
low <strong>and</strong> high tides as well as at some intermediate tide<br />
stages. Then we computed the difference, denoted by<br />
H 2 , between the GPS elevations <strong>of</strong> the sea level <strong>and</strong> the<br />
elevation <strong>of</strong> the base station, shown by the blue arrow.<br />
Since all GPS measurements have several centimeter accuracy<br />
relative to each other, dynamics <strong>of</strong> the tide level,<br />
H 2 , with respect to the base station is also known to have<br />
an accuracy <strong>of</strong> several centimeters. Given the tide level,<br />
H 1 (t), with respect to the MHHW datum (predictions by<br />
NOAA, http://tides<strong>and</strong>currents.noaa.gov/), it is easy to<br />
calculate the vertical shift between MHHW <strong>and</strong> base<br />
Table 1. Nested grids used to compute propagation <strong>of</strong> <strong>tsunami</strong> waves generated in the Gulf <strong>of</strong> Alaska to the city<br />
<strong>of</strong> Whittier. The high-resolution grid is used to compute the <strong>inundation</strong>. Note that the grid resolution in meters<br />
is not uniform <strong>and</strong> is used to illustrate grid fi neness near Whittier. The fi rst dimension is the longitudinal grid<br />
resolution, while the second is the latitudinal grid resolution.<br />
Resolution<br />
Grid arc- meters West–East North–South<br />
name seconds (near Whittier) boundaries boundaries<br />
Northern Pacifi c 2’ x 2’ 1,850 x 3,700 120°00’E – 100°00’W 10°00’N – 65°00’N<br />
Kodiak–Kenai 24” x 24” 370 x 740 145°00’W – 156°00’W 55°00’N – 62°00’N<br />
Coarse PWS 8” x 8” 120 x 245 145°00’W – 150°00’W 58°30’N – 61°30’N<br />
Fine PWS 8/3” x 8/3” 40 x 82 145°20’W – 148°46’W 59°40’N – 61°20’N<br />
High resolution 8/9” x 8/15” 14 x 16 148°45’W – 148°30’W 60°45’N – 60°51’N
Northern Pacifi c<br />
Level 0, 2 arc-minute<br />
Kodiak - Kenai<br />
Level 1, 24 arc-second<br />
Red rectangles mark areas <strong>of</strong> grid refi nement.<br />
Figure 6. Telescoping embedded bathymetry/topography<br />
grids for numerical modeling <strong>of</strong> <strong>tsunami</strong> propagation<br />
<strong>and</strong> runup. The coarsest grid, Level 0, covers the central<br />
<strong>and</strong> northern Pacifi c Ocean. Location <strong>of</strong> each embedded<br />
grid is marked by a red rectangle.<br />
Tsunami <strong>inundation</strong> <strong>maps</strong> <strong>of</strong> Whittier <strong>and</strong> <strong>western</strong> Passage Canal, Alaska 11<br />
Prince William Sound<br />
Level 2, 8 arc-second<br />
Prince William Sound<br />
Level 3, 8/3 arc-second
12 Report <strong>of</strong> Investigations 2011-7<br />
<br />
<br />
<br />
<br />
Figure 7. Locations <strong>of</strong> real time kinematic (RTK) GPS measurements (noted with red triangles) in downtown Whittier <strong>and</strong> airport areas. The yellow line indicates<br />
the observed extent <strong>of</strong> the <strong>tsunami</strong> <strong>inundation</strong>.
A<br />
B<br />
Water level (meters), MHHW datum<br />
1<br />
0<br />
<br />
<br />
<br />
H 1 (t) (NOAA predictions)<br />
station datums by fi tting the measured sea heights to<br />
the predicted ones, as shown in fi gure 8b. We apply the<br />
same shift to all collected GPS measurements, <strong>and</strong> thus<br />
convert the entire survey to the MHHW datum.<br />
We emphasize that the accuracy <strong>of</strong> converting the<br />
survey to the MHHW datum depends on the accuracy <strong>of</strong><br />
NOAA’s Tides <strong>and</strong> Currents prediction. Comparison <strong>of</strong><br />
the tide data at Cordova <strong>and</strong> Valdez to the corresponding<br />
NOAA predictions shows that the deviation is less than<br />
0.6 m (2 ft). The largest discrepancy on November 14,<br />
2009, was 0.45 m (1.5 ft) at Cordova <strong>and</strong> 0.20 m (0.7<br />
ft) at Valdez. We hypothesize that the error between the<br />
actual <strong>and</strong> predicted tides is approximately the same in<br />
Whittier. Hence, we estimate that the error <strong>of</strong> converting<br />
the observations to the MHHW datum does not exceed<br />
1 m (3.3 ft) in fl at-lying areas where there are no abrupt<br />
topographic changes. Finally, we note that the collected<br />
GPS measurements are recorded in WGS84 horizontal<br />
datum, with the horizontal accuracy <strong>of</strong> approximately<br />
3–5 m (10–16 ft) (Leica Geosystem AG, 2002). We<br />
interpolate between the collected measurements in<br />
Tsunami <strong>inundation</strong> <strong>maps</strong> <strong>of</strong> Whittier <strong>and</strong> <strong>western</strong> Passage Canal, Alaska 13<br />
GPS<br />
Base station<br />
H (t) = Base station GPS elevation –<br />
2 = Base station GPS elevation –<br />
Sea level point GPS elevation<br />
Sea level point GPS elevation<br />
Predicted water level<br />
Fitted GPS measurements<br />
<br />
6:00AM 11/13/2009 12:00PM 6:00PM 12:00AM<br />
Time (hours)<br />
6:00AM 11/14/2009 12:00PM 6:00PM<br />
Figure 8. A. Measurement <strong>of</strong> sea level in the WGS84 datum <strong>and</strong> the relation <strong>of</strong> the WGS84 datum to the MHHW<br />
datum. B. Predicted water level dynamics in Whittier <strong>and</strong> the fi tted GPS measurements <strong>of</strong> the water level in<br />
the MHHW datum.<br />
GPS<br />
certain areas <strong>of</strong> fl at topography such as the railroad<br />
tracks, harbor parking area, <strong>and</strong> ferry terminal, taking<br />
into account relatively sparse distribution <strong>of</strong> the GPS<br />
measurements. In fi gure 9, we show the original <strong>and</strong><br />
adjusted DEMs within the Whittier downtown area.<br />
Note that the harbor parking area, railroad depot, <strong>and</strong><br />
tracks have a more uniform horizontal level <strong>and</strong> are more<br />
realistic (City Manager M. Earnest, oral commun. during<br />
2009 visit to Whittier).<br />
NUMERICAL MODEL OF TSUNAMI WAVE<br />
PROPAGATION AND RUNUP<br />
NOAA recently published a technical memor<strong>and</strong>um<br />
that outlines major requirements for numerical models<br />
used in <strong>inundation</strong> mapping <strong>and</strong> <strong>tsunami</strong> forecasting, <strong>and</strong><br />
describes a procedure for model evaluation ( Synolakis<br />
<strong>and</strong> others, 2007). There are two major components to<br />
this process. The fi rst is model validation, which ensures<br />
that the model correctly solves appropriate equations <strong>of</strong><br />
motion by comparing model results with known solutions.<br />
This is achieved through analytical <strong>and</strong> laboratory
14 Report <strong>of</strong> Investigations 2011-7<br />
meters<br />
A<br />
5<br />
4<br />
<br />
3<br />
2<br />
1<br />
<br />
0<br />
<br />
meters<br />
B<br />
5<br />
4<br />
<br />
3<br />
2<br />
1<br />
<br />
0<br />
<br />
Figure 9. Original (A) <strong>and</strong> corrected (B) 15 m (49 ft) resolution DEMs <strong>of</strong> the Whittier downtown. The corrections are based on the GPS measurements converted<br />
to the MHHW datum. The elevation is in meters above the MHHW datum.
enchmarking. The second component is model verifi -<br />
cation, or testing the model, using observations <strong>of</strong> real<br />
events through fi eld data benchmarking.<br />
The numerical model that is currently used by the<br />
Alaska Earthquake Information Center (AEIC) for <strong>tsunami</strong><br />
<strong>inundation</strong> mapping has been validated through a<br />
set <strong>of</strong> analytical benchmarks, <strong>and</strong> tested against laboratory<br />
<strong>and</strong> fi eld data (Nicolsky <strong>and</strong> others, 2011). The<br />
model solves nonlinear shallow water equations using<br />
a fi nite-difference method on a staggered grid. For any<br />
coarse–fi ne pair <strong>of</strong> computational grids, we apply a time<br />
explicit numerical scheme as follows. First, we compute<br />
the water fl ux within a coarse-resolution grid. These<br />
calculated fl ux values are used to defi ne the water fl ux<br />
on a boundary <strong>of</strong> the fi ne-resolution grid. Next, the water<br />
level <strong>and</strong> then the water fl ux are calculated over the<br />
fi ne-resolution grid. Finally, the water level computed<br />
in the fi ne-resolution grid is used to defi ne the water<br />
level within the area <strong>of</strong> the coarse-resolution grid that<br />
coincides with the fi ne grid. Despite the fact that nested<br />
grids decrease the total number <strong>of</strong> grid cells needed to<br />
preserve computational accuracy within certain regions<br />
<strong>of</strong> interest, actual simulations are still unrealistic if parallel<br />
computing is not implemented. Here, we use the<br />
Portable Extensible Toolkit for Scientifi c computation<br />
(PETSc), which provides sets <strong>of</strong> tools for the parallel<br />
numerical solution <strong>of</strong> shallow water equations. In particular,<br />
each computational grid listed in table 1 can be<br />
subdivided among an arbitrary number <strong>of</strong> processors.<br />
The above-mentioned passing <strong>of</strong> information between<br />
the water fl ux <strong>and</strong> level is implemented effi ciently using<br />
PETSc subroutines.<br />
We assess hazards related to tectonic <strong>and</strong> l<strong>and</strong>slidegenerated<br />
<strong>tsunami</strong>s in Passage Canal by performing<br />
model simulations for each hypothetical earthquake <strong>and</strong><br />
l<strong>and</strong>slide source scenario. In the output <strong>of</strong> the numerical<br />
model, each <strong>of</strong> the grid points has either a value <strong>of</strong> 0 if no<br />
<strong>inundation</strong> occurs or 1 if seawater reaches the grid point<br />
at any time. The <strong>inundation</strong> line approximately follows<br />
the 0.5 contour between these 0- <strong>and</strong> 1-point values but<br />
was adjusted visually to accommodate obstacles or local<br />
variations in topography not represented by the DEM.<br />
Although the developed algorithm has passed through<br />
the rigorous benchmarking procedures (Nicolsky <strong>and</strong><br />
others, 2011), the uncertainty in a location <strong>of</strong> the <strong>inundation</strong><br />
line is still present. However, this uncertainty is to<br />
a greater degree unknown because the <strong>inundation</strong> line<br />
is the result <strong>of</strong> a complex modeling process. Affecting<br />
the accuracy <strong>of</strong> the <strong>inundation</strong> line are many factors on<br />
which the model depends, including suitability <strong>of</strong> the<br />
earthquake source model, accuracy <strong>of</strong> the bathymetric<br />
<strong>and</strong> topographic data, <strong>and</strong> the adequacy <strong>of</strong> the numerical<br />
model in representing the generation, propagation, <strong>and</strong><br />
runup <strong>of</strong> <strong>tsunami</strong> waves. In this report, we do not attempt<br />
Tsunami <strong>inundation</strong> <strong>maps</strong> <strong>of</strong> Whittier <strong>and</strong> <strong>western</strong> Passage Canal, Alaska 15<br />
to adjust the modeled <strong>inundation</strong> limits to account for<br />
these uncertainty factors.<br />
We note that there are several limitations <strong>of</strong> the<br />
model. One <strong>of</strong> importance is that it does not take into<br />
account the periodic change <strong>of</strong> sea level due to tides. We<br />
conducted all model runs using bathymetric data that<br />
correspond to MHHW, with the exception <strong>of</strong> numerical<br />
modeling <strong>of</strong> the 1964 <strong>tsunami</strong> for the purpose <strong>of</strong> model<br />
validation. The 1964 runs were conducted using the stage<br />
<strong>of</strong> tide at the time <strong>of</strong> the earthquake, approximately Mean<br />
Low Water. For the generation mechanism, we modeled<br />
earthquakes <strong>and</strong> l<strong>and</strong>slides as potential sources <strong>of</strong> <strong>tsunami</strong><br />
waves. In this region, it was important to include<br />
l<strong>and</strong>slide <strong>tsunami</strong> sources because underwater l<strong>and</strong>slides<br />
<strong>and</strong> their resultant <strong>tsunami</strong>s caused a signifi cant portion<br />
<strong>of</strong> the damage in Passage Canal during the 1964 Great<br />
Alaska Earthquake.<br />
NUMERICAL MODEL OF LANDSLIDE-<br />
GENERATED TSUNAMI WAVES<br />
To simulate <strong>tsunami</strong> waves produced by multiple<br />
underwater slope failures in Passage Canal on March 27,<br />
1964, we used a numerical model <strong>of</strong> a viscous underwater<br />
slide with full interactions between the deforming<br />
slide <strong>and</strong> the water waves that it generates. This model<br />
was initially proposed by Jiang <strong>and</strong> LeBlond (1992).<br />
Fine <strong>and</strong> others (1998) improved the model by including<br />
realistic bathymetry, <strong>and</strong> by correcting errors in the<br />
governing equations. The Fine model’s assumptions<br />
<strong>and</strong> applicability to simulating underwater mudfl ows<br />
are discussed by Jiang <strong>and</strong> LeBlond (1992, 1994) in<br />
their formulation <strong>of</strong> the viscous slide model. The model<br />
uses long-wave approximation for water waves <strong>and</strong><br />
the deforming slide, which means that the wavelength<br />
is much greater than the local water depth, <strong>and</strong> the<br />
slide thickness is much smaller than the characteristic<br />
length <strong>of</strong> the slide along the slope (Jiang <strong>and</strong> LeBlond,<br />
1994). Assier-Rzadkiewicz <strong>and</strong> others (1997) argued<br />
that the long-wave approximation could be inaccurate<br />
for steeper slopes exceeding 10 degrees. Rabinovich<br />
<strong>and</strong> others (2003) studied the validity <strong>of</strong> the long-wave<br />
approximation for slopes greater than 10 degrees <strong>and</strong><br />
found that for a slope <strong>of</strong> 16 degrees, the possible error<br />
was 8 percent, <strong>and</strong> for the maximum slope in their study<br />
<strong>of</strong> 23 degrees, the possible error was 15 percent. Since<br />
the average pre-earthquake <strong>of</strong>fshore slopes from 10 to<br />
30 degrees in the vicinity <strong>of</strong> Whittier, the possible error<br />
introduced by a slide moving down these higher gradient<br />
slopes could be signifi cantly higher, <strong>and</strong> further scientifi c<br />
studies are necessary.<br />
The advantage <strong>of</strong> the vertically integrated model by<br />
Jiang <strong>and</strong> LeBlond (1992) is its ability to simulate runup<br />
<strong>of</strong> real l<strong>and</strong>slide <strong>tsunami</strong> events using high-resolution<br />
numerical grids. Although model runs require the use
16 Report <strong>of</strong> Investigations 2011-7<br />
<strong>of</strong> high-performance computing, the computational<br />
times are still reasonable. This model was successfully<br />
applied to simulate a <strong>tsunami</strong> event in Skagway Harbor,<br />
one <strong>of</strong> numerous fjords in southeastern Alaska, where<br />
<strong>tsunami</strong> waves were generated by a submarine l<strong>and</strong>slide<br />
on November 3, 1994 (Fine <strong>and</strong> others, 1998; Thomson<br />
<strong>and</strong> others, 2001). The results <strong>of</strong> numerical simulations<br />
were in good agreement with the tide gauge record in<br />
Skagway Harbor. Rabinovich <strong>and</strong> others (2003) simulated<br />
potential underwater l<strong>and</strong>slides in British Columbia<br />
fjords, with settings similar to Passage Canal, <strong>and</strong> demonstrated<br />
that this model can also be used for <strong>tsunami</strong><br />
hazard assessment.<br />
TECTONIC TSUNAMI SOURCES<br />
One <strong>of</strong> the most destructive tectonic <strong>tsunami</strong>s in<br />
Alaska history was triggered by the 1964 Great Alaska<br />
Earthquake, during which the Prince William Sound<br />
(PWS) <strong>and</strong> Kodiak Isl<strong>and</strong> (KI) segments ruptured simultaneously<br />
(Christensen <strong>and</strong> Beck, 1994). Shennan <strong>and</strong><br />
others (2009) present geologic evidence that the PWS<br />
<strong>and</strong> KI segments <strong>of</strong> the 1964 rupture area <strong>and</strong> a portion<br />
<strong>of</strong> the Yakutat microplate ruptured simultaneously in<br />
the past, <strong>and</strong> could have produced more devastating<br />
<strong>tsunami</strong>s. Another hypothetical <strong>tsunami</strong>genic earthquake<br />
worth considering is a rupture <strong>of</strong> the Cascadia subduction<br />
zone, involving the Juan de Fuca Plate underlying<br />
the Pacifi c Ocean, from mid-Vancouver Isl<strong>and</strong> in British<br />
Columbia, southwest Canada, along the Pacifi c Northwest<br />
coast.<br />
Before we begin describing all <strong>tsunami</strong> sources<br />
that were considered, we note some assumptions in our<br />
modeling technique. First, an initial displacement <strong>of</strong> the<br />
ocean surface is equal to the vertical displacement <strong>of</strong> the<br />
ocean fl oor induced by the earthquake rupture process.<br />
Second, the fi nite speed <strong>of</strong> the rupture propagation along<br />
the fault is not taken into account. We consider the ocean<br />
bottom displacement to be instantaneous. Third, the<br />
initial topography is modifi ed to account for coseismic<br />
deformation <strong>of</strong> l<strong>and</strong> due to the earthquake.<br />
Models <strong>of</strong> the 1964 Great Alaska Earthquake<br />
The 1964 <strong>tsunami</strong> was generated in the trench <strong>and</strong><br />
upper-plate fold-<strong>and</strong>-thrust belt area <strong>of</strong> the subduction<br />
zone (Plafker <strong>and</strong> others, 2000). It affected numerous<br />
communities along the Pacifi c Northwest coast, Hawaii,<br />
<strong>and</strong> Alaska. This <strong>tsunami</strong> was studied in depth by several<br />
investigators (Plafker, 1967; Wilson <strong>and</strong> Tørum,<br />
1968; Lemke, 1967). Plafker (1967) gives a detailed<br />
description <strong>of</strong> the motion observed on the Patton Bay<br />
fault during the Great Alaska Earthquake <strong>of</strong> 1964, <strong>and</strong><br />
provides a full report <strong>of</strong> the surface rupture <strong>and</strong> fault<br />
motion, as well as several pieces <strong>of</strong> evidence suggesting<br />
that the fault continues on the ocean fl oor well past the<br />
region where it is currently mapped. Holdahl <strong>and</strong> Sauber<br />
(1994) applied Plafker’s description to construct their<br />
model <strong>of</strong> the Patton Bay fault, which was used in an<br />
inversion <strong>of</strong> geodetic data. Johnson <strong>and</strong> others (1996)<br />
used the results <strong>of</strong> Holdahl <strong>and</strong> Sauber (1994) to augment<br />
their joint inversion <strong>of</strong> geodetic <strong>and</strong> <strong>tsunami</strong> data <strong>and</strong><br />
to further reconstruct coseismic deformation models <strong>of</strong><br />
the 1964 earthquake.<br />
In this study, we use two coseismic deformation<br />
models <strong>of</strong> the 1964 earthquake, the Johnson <strong>and</strong> others<br />
(1996) <strong>and</strong> the Suito <strong>and</strong> Freymueller (2009) models<br />
to generate the vertical displacements <strong>of</strong> the sea fl oor<br />
during the earthquake. We hereafter reference Johnson<br />
<strong>and</strong> others (1996) as the Johnson deformation model<br />
(JDM) <strong>and</strong> Suito <strong>and</strong> Freymueller (2009) as the Suito<br />
deformation model (SDM).<br />
Johnson <strong>and</strong> others (1996) derive a detailed slip<br />
distribution for the 1964 earthquake, which has eight<br />
subfaults representing the KI asperity <strong>and</strong> nine subfaults<br />
in the PWS asperity. One subfault was assigned to represent<br />
the Patton Bay fault. Johnson <strong>and</strong> others (1996) <strong>and</strong><br />
Holdahl <strong>and</strong> Sauber (1994) used only the mapped extent<br />
<strong>of</strong> the fault, approximately 72 km, despite evidence<br />
suggesting that the fault may extend much farther to the<br />
southwest. For example, Suito <strong>and</strong> Freymueller (2009)<br />
found that they could not fi t all the GPS data accurately<br />
unless they extended the fault past the tip <strong>of</strong> the Kenai<br />
Peninsula. In the same report, Suito <strong>and</strong> Freymueller<br />
(2009) develop a coseismic deformation model <strong>of</strong> the<br />
1964 earthquake based on a three-dimensional (3-D) viscoelastic<br />
model, which implements a realistic geometry<br />
with an elastic slab having low dip angle. This coseismic<br />
model is not based on an inversion, but it resembles a<br />
recently published inversion model (Ichinose <strong>and</strong> others,<br />
2007) as well as some previously proposed models<br />
(Holdahl <strong>and</strong> Sauber, 1994; Johnson <strong>and</strong> others, 1996;<br />
Santini <strong>and</strong> others, 2003).<br />
The main difference between JDM <strong>and</strong> SDM is<br />
that the latter incorporates slightly higher slip near the<br />
downdip end <strong>of</strong> the rupture, to explain the horizontal<br />
displacements. Additionally, the rupture in the SDM is<br />
assumed to occur deeper than in the JDM. Consequently,<br />
the deeper subfaults in the SDM produce smoother variation<br />
<strong>of</strong> the sea fl oor deformation than in the JDM. Both<br />
models introduce the Patton Bay splay fault to explain<br />
the excessive uplift at Montague Isl<strong>and</strong>. It is assumed in<br />
the JDM that the extent <strong>of</strong> this splay fault was not much<br />
larger than its subaerial outcrop on Montague Isl<strong>and</strong>.<br />
On the other h<strong>and</strong>, it is assumed in the SDM that the<br />
same fault extends much farther to the west than was<br />
previous assumed by Holdahl <strong>and</strong> Sauber (1994) <strong>and</strong><br />
Johnson <strong>and</strong> others (1996). We note that although the<br />
Patton Bay fault slipped approximately 10 m (33 ft) at<br />
the south<strong>western</strong> tip <strong>of</strong> Montague Isl<strong>and</strong>, there has yet<br />
to be a comprehensive submarine survey to document<br />
the extent <strong>of</strong> that splay fault.
Scenario 1. Repeat <strong>of</strong> the 1964 event: Source function<br />
based on coseismic deformation model by Johnson <strong>and</strong><br />
others (1996) (JDM)<br />
The 1964 earthquake vertical coseismic displacement<br />
is modeled as rupture by eight subfaults representing the<br />
Kodiak asperity <strong>and</strong> nine subfaults in the Prince William<br />
Sound asperity. One subfault was assigned to represent<br />
the Patton Bay fault, although the contribution <strong>of</strong> this<br />
fault to the far-fi eld <strong>tsunami</strong> waveform was negligible.<br />
The fault parameters required to compute sea fl oor deformation<br />
are the epicenter location, area, dip, rake, strike,<br />
<strong>and</strong> amount <strong>of</strong> slip on the fault. We use the equations <strong>of</strong><br />
Okada (1985) to calculate distribution <strong>of</strong> coseismic uplift<br />
<strong>and</strong> subsidence resulting from this slip distribution. This<br />
source function was previously applied to calculation <strong>of</strong><br />
1964 <strong>tsunami</strong> <strong>inundation</strong> in Kodiak <strong>and</strong> Kachemak Bay<br />
communities. The results are described in Suleimani <strong>and</strong><br />
others (2002, 2005). The vertical ground/ocean fl oor<br />
displacement according to the JDM is shown in fi gure 10.<br />
Scenario 2. Repeat <strong>of</strong> the 1964 event: Source function<br />
based on coseismic deformation model by Suito <strong>and</strong><br />
Freymueller (2009) (SDM)<br />
This coseismic deformation model <strong>of</strong> the 1964<br />
earthquake is based on a 3-D viscoelastic model, incorporating<br />
a realistic geometry with an elastic slab having<br />
low dip angle. The vertical ground/ocean fl oor displacement<br />
according to the SDM is shown in fi gure 10.<br />
Models <strong>of</strong> the multi segment Great Alaska<br />
Earthquake<br />
A recent study by Shennan <strong>and</strong> others (2008) presents<br />
geologic evidence that the Prince William Sound<br />
<strong>and</strong> Kodiak Isl<strong>and</strong> segments <strong>of</strong> the 1964 rupture area<br />
<strong>and</strong> a portion <strong>of</strong> the Yakutat microplate may rupture<br />
simultaneously. To evaluate whether this event would<br />
make a plausible <strong>tsunami</strong> scenario for Whittier, we have<br />
constructed a source function <strong>of</strong> the multi-segment rupture<br />
that encompasses the 1964 rupture.<br />
We apply the following constraints based on the<br />
hypothetical earthquake model <strong>of</strong> Shennan <strong>and</strong> others<br />
(2008). The extended source function includes three<br />
segments <strong>of</strong> the Aleutian megathrust: the Prince William<br />
Tsunami <strong>inundation</strong> <strong>maps</strong> <strong>of</strong> Whittier <strong>and</strong> <strong>western</strong> Passage Canal, Alaska 17<br />
Table 2. Fault parameters for the Yakataga–Yakutat (YY) segment<br />
Sound (PWS), Kodiak Isl<strong>and</strong> (KI), <strong>and</strong> Yakataga–<br />
Yakutat (YY) segments. The total seismic moment is<br />
about 15 percent greater than that <strong>of</strong> the 1964 earthquake.<br />
The new source function produces coseismic vertical uplifts<br />
along the Gulf <strong>of</strong> Alaska coastline segment between<br />
the Copper River basin <strong>and</strong> Yakataga area, in order to<br />
match the coseismic deformation pattern to paleoseismic<br />
data (Shennan <strong>and</strong> others, 2008).<br />
To construct a rupture model for the YY segment,<br />
we assume four subfaults whose parameters are listed in<br />
table 2. We calculate coseismic deformations produced<br />
by this segment using Okada’s algorithm (Okada, 1985),<br />
<strong>and</strong> then combine them with the 1964 coseismic deformations<br />
produced either by the JDM or by the SDM.<br />
Scenario 3. Multi-segment JDM event: Source function<br />
based on extension <strong>of</strong> the JDM<br />
The model in scenario 1 is extended by including<br />
a rupture model for the YY segment. The coseismic<br />
deformation pattern for the extended 1964 rupture is<br />
shown in fi gure 10.<br />
Scenario 4. Multi-segment SDM event: Source function<br />
based on extension <strong>of</strong> the SDM<br />
The model in scenario 2 is extended by including<br />
a rupture model for the YY segment. The coseismic<br />
deformation pattern for the extended 1964 rupture is<br />
shown in fi gure 10.<br />
Model <strong>of</strong> the Cascadia Subduction Zone<br />
Earthquake<br />
Paleoseismic records reveal that great <strong>tsunami</strong>genic<br />
earthquakes repeatedly occur in the Cascadia subduction<br />
zone with irregular intervals averaging about 500 years<br />
(Atwater, 1987), <strong>of</strong>ten accompanied by a <strong>tsunami</strong>. The<br />
latest trans-Pacifi c <strong>tsunami</strong> generated by an earthquake<br />
at Cascadia occurred in January 1700 (Satake <strong>and</strong> others,<br />
1996; Atwater <strong>and</strong> others, 2005). Probably owing<br />
to low population density along the Alaska coast, the<br />
impact <strong>of</strong> this <strong>tsunami</strong> on local communities was not<br />
noticed. Multiple models <strong>of</strong> the Cascadia zone rupture<br />
are suggested by Satake <strong>and</strong> others (2003) <strong>and</strong> Priest<br />
<strong>and</strong> others (2009) <strong>and</strong> in references therein. These<br />
models describe hypothetical coseismic displacement<br />
Lat Long Depth Length Width Strike Dip Rake Slip<br />
(deg. N) (deg. W) (km) (km) (km) (deg.) (deg.) (deg.) (m)<br />
59.17 144.12 1 50.1 190 256 12 90 15<br />
59.36 143.23 3 51.1 141 250.4 10 90 15<br />
59.54 142.42 5 47.8 114.8 245.8 6 90 15<br />
59.94 141.21 5 79.7 99.6 237.8 8 90 15
18 Report <strong>of</strong> Investigations 2011-7<br />
Scenario 1 Scenario 4<br />
60 <br />
55 <br />
60 <br />
55 <br />
205 <br />
205 <br />
Vertical seafloor deformation (JDM), m<br />
210 <br />
Vertical seafloor deformation (SDM), m<br />
210 <br />
215 <br />
Scenario 2 Scenario 5<br />
215 <br />
Scenario 3 Scenario 6<br />
220 <br />
220 <br />
Vertical seafloor deformation (Extended 1964 rupture based on the JDM), m<br />
5<br />
60 <br />
55 <br />
205 <br />
210 <br />
215 <br />
220 <br />
Figure 10. Vertical deformations <strong>of</strong> the ocean fl oor corresponding to scenarios 1–9.<br />
5<br />
4<br />
3<br />
2<br />
1<br />
0<br />
1<br />
2<br />
3<br />
4<br />
5<br />
4<br />
3<br />
2<br />
1<br />
0<br />
5<br />
4<br />
3<br />
2<br />
1<br />
0<br />
1<br />
2<br />
3<br />
4<br />
5<br />
1<br />
2<br />
3<br />
4<br />
5<br />
Vertical seafloor deformation (Extended 1964 rupture based on the SDM), m<br />
5<br />
60 <br />
55 <br />
50 <br />
45 <br />
40 <br />
35 <br />
60 <br />
55 <br />
60 <br />
55 <br />
205 <br />
205 <br />
Vertical seafloor deformation (Cascadia rupture), m<br />
210 <br />
215 <br />
210 <br />
220 <br />
225 <br />
215 <br />
230 <br />
220 <br />
235 <br />
Vertical seafloor deformation (PWS asperity <strong>of</strong> the JDM), m<br />
205 <br />
210 <br />
215 <br />
220 <br />
240 <br />
4<br />
3<br />
2<br />
1<br />
0<br />
1<br />
2<br />
3<br />
4<br />
5<br />
5<br />
4<br />
3<br />
2<br />
1<br />
0<br />
1<br />
2<br />
3<br />
4<br />
5<br />
5<br />
4<br />
3<br />
2<br />
1<br />
0<br />
1<br />
2<br />
3<br />
4<br />
5
Scenario 7<br />
60 <br />
55 <br />
Vertical seafloor deformation (KI asperity <strong>of</strong> the JDM), m<br />
205 <br />
Scenario 8<br />
60 <br />
55 <br />
210 <br />
Figure 10 (cont’d). Vertical deformations <strong>of</strong> the<br />
ocean fl oor corresponding to scenarios 1–9.<br />
Tsunami <strong>inundation</strong> <strong>maps</strong> <strong>of</strong> Whittier <strong>and</strong> <strong>western</strong> Passage Canal, Alaska 19<br />
215 <br />
220 <br />
Vertical seafloor deformation (PWS asperity <strong>of</strong> the SDM), m<br />
205 <br />
Scenario 9<br />
60 <br />
55 <br />
210 <br />
215 <br />
220 <br />
Vertical seafloor deformation (KI asperity <strong>of</strong> the SDM), m<br />
205 <br />
210 <br />
215 <br />
220 <br />
5<br />
4<br />
3<br />
2<br />
1<br />
0<br />
1<br />
2<br />
3<br />
4<br />
5<br />
5<br />
4<br />
3<br />
2<br />
1<br />
0<br />
1<br />
2<br />
3<br />
4<br />
5<br />
5<br />
4<br />
3<br />
2<br />
1<br />
0<br />
1<br />
2<br />
3<br />
4<br />
5<br />
fi elds <strong>of</strong> the Cascadia rupture, with various levels <strong>of</strong><br />
detail. Since the Cascadia subduction zone earthquake<br />
is considered to be a medium fi eld <strong>tsunami</strong> source to the<br />
south-central Alaska coast, a relatively simple “worst<br />
case, but credible” rupture <strong>of</strong> the Cascadia subduction<br />
zone is used in this report.<br />
Scenario 5. Rupture <strong>of</strong> the Cascadia zone, including<br />
portions <strong>of</strong> the margin along the British Columbia <strong>and</strong><br />
northern California shores<br />
Tsunami heights in Japanese historical records<br />
can constrain the slip distance <strong>of</strong> the 1700 Cascadia<br />
earthquake (Satake <strong>and</strong> others, 1996) but do not well<br />
constrain the downdip limit <strong>of</strong> the rupture (Wang <strong>and</strong><br />
others, 2003). A conservative approach for Cascadia is<br />
to assume that full coseismic rupture takes place over<br />
the entire locked zone <strong>and</strong> the slip decreases linearly<br />
downdip halfway into the present effective transition<br />
zone. The most recently updated <strong>and</strong> probably more<br />
reasonable model assumes that the slip distribution in<br />
the downdip direction is bell shaped (Geological Survey<br />
<strong>of</strong> Canada, K. Wang, written commun., 2010), which is<br />
different from what was used to model the coseismic deformation<br />
shown in fi gure 14 <strong>of</strong> Wang <strong>and</strong> others (2003).<br />
In this report, the assumed rupture recovers 1,200 years<br />
equivalent <strong>of</strong> plate convergence (Oregon Department <strong>of</strong><br />
Geology <strong>and</strong> Mineral Industries, R. Witter, oral commun.,<br />
2010), about 36 m (120 ft) slip <strong>and</strong> its magnitude<br />
M w ≈ 9 <strong>and</strong> is shown in fi gure 10.<br />
Source models <strong>of</strong> hypothetical <strong>tsunami</strong>genic<br />
earthquakes<br />
The results <strong>of</strong> joint inversion <strong>of</strong> <strong>tsunami</strong> <strong>and</strong> geodetic<br />
data from the 1964 earthquake (Johnson <strong>and</strong> others,<br />
1996) support the division <strong>of</strong> the rupture zone into two<br />
different segments: the Kodiak block <strong>and</strong> the Prince<br />
William Sound (PWS) block. These zones have different<br />
recurrence intervals, with estimates <strong>of</strong> the recurrence<br />
interval for the Kodiak segment being as low as 60 years<br />
(Johnson <strong>and</strong> others, 1996). Therefore, we consider<br />
four scenarios in which these two segments <strong>of</strong> the 1964<br />
rupture area are separate hypothetical <strong>tsunami</strong> sources.<br />
Scenario 6. Modifi ed 1964 event: Prince William Sound<br />
asperity <strong>of</strong> the JDM<br />
This event is a hypothetical earthquake that ruptures<br />
nine subfaults <strong>of</strong> the Prince William Sound asperity with<br />
some slip on the Patton Bay fault from the deformation<br />
model by Johnson <strong>and</strong> others (1996). Vertical coseismic<br />
deformations for this scenario are shown in fi gure 10.
20 Report <strong>of</strong> Investigations 2011-7<br />
Scenario 7. Modifi ed 1964 event: Kodiak asperity <strong>of</strong><br />
the JDM<br />
This event is a hypothetical earthquake that ruptures<br />
eight subfaults in the Kodiak asperity from the deformation<br />
model by Johnson <strong>and</strong> others (1996). Vertical<br />
coseismic deformations for this scenario are shown in<br />
fi gure 10.<br />
Scenario 8. Modifi ed 1964 event: Prince William Sound<br />
asperity <strong>of</strong> the SDM<br />
This event is a hypothetical earthquake that ruptures<br />
the Prince William Sound asperity from the deformation<br />
model by Suito <strong>and</strong> Freymueller (2009). Vertical<br />
coseismic deformations for this scenario are shown in<br />
fi gure 10.<br />
Scenario 9. Modifi ed 1964 event: Kodiak asperity <strong>of</strong><br />
the SDM<br />
This event is a hypothetical earthquake that ruptures<br />
the Kodiak asperity from the deformation model by Suito<br />
<strong>and</strong> Freymueller (2009). Vertical coseismic deformations<br />
for this scenario are shown in fi gure 10.<br />
LANDSLIDE TSUNAMI SOURCES<br />
Multiple submarine slope failures in Passage<br />
Canal during the 1964 earthquake<br />
A description <strong>and</strong> analysis <strong>of</strong> the damage resulting<br />
from waves generated by submarine l<strong>and</strong>slide at the port<br />
<strong>of</strong> Whittier during the 1964 earthquake is provided in<br />
Kachadoorian (1965). The report also presents convincing<br />
evidence that massive submarine l<strong>and</strong>slides were<br />
triggered by the earthquake. Pre- <strong>and</strong> post-earthquake<br />
bathymetric data <strong>and</strong> sub-bottom pr<strong>of</strong>i les <strong>of</strong> the <strong>western</strong><br />
part <strong>of</strong> Passage Canal are shown in fi gure 11. The l<strong>and</strong>slides<br />
in the <strong>western</strong> part <strong>of</strong> Passage Canal occurred on<br />
slopes ranging from 20 degrees <strong>of</strong>fshore <strong>of</strong> the airstrip<br />
to 31 degrees at the marginal wharf. The largest change<br />
in the submarine slope was produced by the airstrip<br />
l<strong>and</strong>slide. Unfortunately, there is currently no additional<br />
information as to whether or where the l<strong>and</strong>slides occurred<br />
in the central <strong>and</strong> eastern parts <strong>of</strong> Passage Canal.<br />
On the basis <strong>of</strong> pre- <strong>and</strong> post-earthquake bathymetry<br />
pr<strong>of</strong>i les, we approximate an initial distribution <strong>of</strong> the<br />
slide as follows. We digitized the pre- <strong>and</strong> post-earthquake<br />
bathymetry along A–A′, B–B′, <strong>and</strong> C–C′ pr<strong>of</strong>i le<br />
lines, shown by solid line segments in fi gure 11. The<br />
digitized pre- <strong>and</strong> post-earthquake bathymetry along<br />
these pr<strong>of</strong>i les is shown in fi gure 12, by lines with hollow<br />
square <strong>and</strong> circle symbols, respectively. We also plot the<br />
present-day bathymetry along the pr<strong>of</strong>i les in fi gure 12 by<br />
a line marked with solid circles. Note that for the sake <strong>of</strong><br />
validating simulations <strong>of</strong> the events <strong>of</strong> 1964, we edited 6<br />
6 For calculating <strong>inundation</strong> <strong>of</strong> potential <strong>tsunami</strong>s, the unedited DEM is used.<br />
the DEM to remove post-earthquake constructions such<br />
as the breakwater, the cruise ship terminal, <strong>and</strong> some<br />
parts <strong>of</strong> the small boat harbor. The edited DEM is shown<br />
in fi gure 13. The comparison <strong>of</strong> the post-earthquake<br />
bathymetry to the present-day depth contours along the<br />
shown pr<strong>of</strong>i les reveals that there are several discrepancies<br />
between the two pr<strong>of</strong>i les. The differences can be<br />
explained by digitizing, surveying, <strong>and</strong> measuring errors.<br />
Nevertheless, the present-day bathymetry pr<strong>of</strong>i les<br />
quantitatively match the post-earthquake pr<strong>of</strong>i les in the<br />
area <strong>of</strong> l<strong>and</strong>slide.<br />
We digitally add some material above the present-day<br />
bathymetry to match the pre-earthquake A–A′, B–B′,<br />
<strong>and</strong> C–C′ pr<strong>of</strong>i les. The modeled l<strong>and</strong>slide thicknesses<br />
are shown in fi gure 12 by lines marked with solid triangles.<br />
Figure 14a shows locations <strong>and</strong> thicknesses <strong>of</strong><br />
three complexes: the Harbor, Airport, <strong>and</strong> Glacier (HAG)<br />
l<strong>and</strong>slides. The Harbor <strong>and</strong> Airport l<strong>and</strong>slide pr<strong>of</strong>i les fi t<br />
the pre-earthquake bathymetry pr<strong>of</strong>i les, while there is<br />
little or no constraint on the Glacier l<strong>and</strong>slide, whose<br />
existence is clearly marked in fi gure 11. We assume that<br />
the pre-earthquake bathymetry in the region occupied<br />
by the Glacier l<strong>and</strong>slide had the same slope as the preearthquake<br />
bathymetry in the location <strong>of</strong> the Harbor<br />
<strong>and</strong> Airport l<strong>and</strong>slides. Additionally, we assume that<br />
the volume <strong>of</strong> the Glacier l<strong>and</strong>slide is half the volume<br />
<strong>of</strong> the Airport l<strong>and</strong>slide. Based on these assumptions,<br />
we estimate that the total volume <strong>of</strong> these l<strong>and</strong>slides is<br />
about 15 million m 3 . After conducting several numerical<br />
experiments we conclude that the Airport l<strong>and</strong>slide was<br />
a major contributor to the <strong>tsunami</strong> waves at the Whittier<br />
waterfront.<br />
Scenario 10. Repeat <strong>of</strong> the 1964 event: Major underwater<br />
slide complexes <strong>of</strong> the 1964 earthquake—Harbor,<br />
Airport, <strong>and</strong> Glacier (HAG) l<strong>and</strong>slides.<br />
Figure 14a shows three slide complexes in the upper<br />
bay that were the major contributors to the locally<br />
generated waves that inundated the city <strong>of</strong> Whittier. The<br />
initial l<strong>and</strong>slide thicknesses are approximated from the<br />
bathymetric difference pr<strong>of</strong>i les. The total volume for<br />
these slide complexes is approximately 15 million m 3 .<br />
Hypothetical l<strong>and</strong>slide <strong>tsunami</strong> sources<br />
Kachadoorian (1965) provides a description <strong>of</strong><br />
l<strong>and</strong>slides at the head <strong>of</strong> Passage Canal during the 1964<br />
event <strong>and</strong> hypothesizes regarding a l<strong>and</strong>slide <strong>of</strong>fshore <strong>of</strong><br />
Billings Creek delta. Kachadoorian (1965) also mentions<br />
that the waves that struck the west coastline <strong>of</strong> Passage<br />
Canal originated along the north coastline <strong>of</strong> the <strong>canal</strong><br />
<strong>and</strong> traveled southwest. Consequently, we consider<br />
another possible l<strong>and</strong>slide location on the northern shore<br />
<strong>of</strong> Passage Canal. Unfortunately, there is no bathymetry
Tsunami <strong>inundation</strong> <strong>maps</strong> <strong>of</strong> Whittier <strong>and</strong> <strong>western</strong> Passage Canal, Alaska 21<br />
Figure 11. Map <strong>of</strong> Whittier, showing pre- <strong>and</strong> post-earthquake bathymetry, wave height <strong>and</strong> direction, <strong>and</strong> submarine l<strong>and</strong>slides <strong>and</strong> pr<strong>of</strong>i les (from Kachadoorian, 1965, plate 3).
22 Report <strong>of</strong> Investigations 2011-7<br />
Depth, m<br />
Depth, m<br />
Depth, m<br />
0<br />
50<br />
100<br />
150<br />
200<br />
0<br />
50<br />
100<br />
150<br />
200<br />
0<br />
50<br />
100<br />
150<br />
200<br />
A<br />
B<br />
C<br />
Figure 12. Pre- <strong>and</strong> post-earthquake bathymetry pr<strong>of</strong>i les along cross-sections A–A’, B to bend in section B–B’,<br />
<strong>and</strong> C–C’, shown in fi gure 11. The pr<strong>of</strong>i les are adopted from fi gure 11 <strong>and</strong> are supplemented with present-day<br />
bathymetry <strong>and</strong> modeled 1964 slide pr<strong>of</strong>i les. The present-day bathymetry pr<strong>of</strong>i les are shown by blue lines with<br />
solid blue circles. The modeled pre-1964 bathymetry pr<strong>of</strong>i les are shown by red lines with solid red triangles.<br />
The vertical scale is exaggerated.<br />
A’<br />
Bend in<br />
section B–B’<br />
C’
meters<br />
<br />
C<br />
<br />
<br />
40<br />
<br />
B<br />
<br />
<br />
<br />
Tsunami <strong>inundation</strong> <strong>maps</strong> <strong>of</strong> Whittier <strong>and</strong> <strong>western</strong> Passage Canal, Alaska 23<br />
A<br />
<br />
A<br />
<br />
<br />
<br />
0<br />
0<br />
<br />
<br />
0<br />
<br />
C<br />
<br />
<br />
<br />
0<br />
0<br />
<br />
<br />
B<br />
<br />
0<br />
<br />
<br />
<br />
<br />
<br />
<br />
<br />
Figure 13. Digitally edited 15m- (49-ft-) resolution digital elevation model (DEM). Elevation is in meters above the pre−earthquake MLLW level. The present-day<br />
wave breaker <strong>and</strong> cruise ship terminal are removed from the DEM to model the 1964 bathymetry <strong>and</strong> topography. Elevation is shown with respect to the MLLW<br />
datum.
24 Report <strong>of</strong> Investigations 2011-7<br />
data to adequately constrain locations <strong>and</strong> thicknesses<br />
<strong>of</strong> underwater slides anywhere in Passage Canal, except<br />
at its head.<br />
Scenario 11. Hypothetical event: Major underwater<br />
slide complex <strong>of</strong>fshore <strong>of</strong> the northern shore <strong>of</strong> Passage<br />
Canal.<br />
We assume that the failure surfaces correspond to<br />
the post-earthquake bottom <strong>of</strong> Passage Canal. The total<br />
volume <strong>of</strong> sediments is approximately 10 million m 3 .<br />
The slide thickness <strong>and</strong> location are shown in fi gure 14b.<br />
Scenario 12. Hypothetical event: Major underwater<br />
slide complex <strong>of</strong>fshore <strong>of</strong> the Billings Creek delta.<br />
We assume that the failure surfaces correspond to<br />
the post-earthquake bottom <strong>of</strong> Passage Canal. The total<br />
volume <strong>of</strong> sediments is approximately 10 million m 3 .<br />
The slide thickness <strong>and</strong> location are shown in fi gure 14b.<br />
Scenario 13. Hypothetical event: Simultaneous failure<br />
<strong>of</strong> underwater slide complexes described by scenarios<br />
10–12.<br />
We assume that the slide-prone unconsolidated deposits<br />
described by scenarios 10–12 are initially at rest,<br />
then are simultaneously triggered into sliding by ground<br />
shaking, <strong>and</strong> move thereafter only under the force <strong>of</strong><br />
gravity. The total volume <strong>of</strong> sediments is approximately<br />
35 million m 3 .<br />
MODELING RESULTS<br />
NUMERICAL MODELING OF THE 1964<br />
TSUNAMI IN PASSAGE CANAL: MODEL<br />
VERIFICATION<br />
In this section, we compare <strong>inundation</strong> modeling<br />
results <strong>of</strong> the 1964 <strong>tsunami</strong> in Passage Canal with observations—the<br />
limit <strong>of</strong> highest wave <strong>and</strong> wave directions<br />
shown in fi gure 11. To model <strong>inundation</strong> <strong>of</strong> coastal areas,<br />
we use a series <strong>of</strong> nested grids. Recall that the lowest<br />
resolution 2-arc-minute grid spans the Gulf <strong>of</strong> Alaska,<br />
while the fi nest resolution 15 m (49.2 ft) grid covers Passage<br />
Canal. We note again that the high-resolution DEM<br />
is digitally edited to remove post-1964 construction such<br />
as the cruise ship terminal <strong>and</strong> harbor. At the time <strong>of</strong> the<br />
main shock the water level was 0.3 m (1 ft) above the<br />
MLLW (Kachadoorian, 1965). A sketch <strong>of</strong> the water level<br />
in Passage Canal just before the earthquake is shown<br />
in fi gure 15a. During the earthquake, the Whittier area<br />
subsided by S ≈ 1.6 m (5.3 ft). Unfortunately, it is not<br />
known when the subsidence occurred chronologically—<br />
before, during, or after the l<strong>and</strong>slide-generated <strong>tsunami</strong>.<br />
In this report, we assume that the subsidence occurred<br />
within a few seconds after the main shock. A sketch <strong>of</strong><br />
the Whittier harbor <strong>and</strong> l<strong>and</strong>slide-generated <strong>tsunami</strong> during<br />
the earthquake is shown in fi gure 15b. To reconstruct<br />
the sea level at Whittier after the earthquake but before<br />
arrival <strong>of</strong> the tectonic <strong>tsunami</strong>, we fi rst convert the edited<br />
DEM from the post-earthquake MHHW datum to the<br />
pre-earthquake MHHW datum by adding the subsidence<br />
S, fi gure 15c. Then the sea level in the adjusted DEM is<br />
set to 0.3 m (1 ft) positive <strong>of</strong>fset from the MLLW level 7<br />
in the adjusted DEM.<br />
Although the residents <strong>of</strong> Whittier did not notice<br />
the tectonic <strong>tsunami</strong> wave, we model its impact on the<br />
city infrastructure. The source <strong>of</strong> local waves in Passage<br />
Canal ceased shortly after the end <strong>of</strong> ground shaking, so<br />
we can assume that the l<strong>and</strong>slide-generated <strong>and</strong> tectonic<br />
<strong>tsunami</strong>s can be considered independent events, <strong>and</strong><br />
hence modeled separately.<br />
The fi rst observed “glassy hump” <strong>of</strong> water during<br />
the earthquake (Wilson <strong>and</strong> Tørum, 1968) is attributed<br />
to a seiche wave generated by the 8.3 m (27 ft) horizontal<br />
translation <strong>of</strong> the entire area transverse to Passage<br />
Canal. We refer to Wilson <strong>and</strong> Tørum (1968), in which<br />
quantitative estimates <strong>of</strong> this seiche wave have been<br />
derived. Shortly after subsidence <strong>of</strong> the glassy hump<br />
<strong>of</strong> water, the second muddy bore <strong>of</strong> water inundated<br />
the downtown area <strong>of</strong> Whittier. The second wave has<br />
been attributed to the l<strong>and</strong>slide-generated <strong>tsunami</strong> <strong>and</strong><br />
is modeled in this report.<br />
We assume that the slide-prone unconsolidated deposits<br />
are initially at rest <strong>and</strong> are triggered into sliding<br />
by ground shaking. The slide material moves thereafter<br />
only under the force <strong>of</strong> gravity. Shannon <strong>and</strong> Hilts (1973)<br />
conducted a subsurface geotechnical investigation <strong>of</strong><br />
materials that failed in settings similar to Resurrection<br />
Bay, Alaska, during the 1964 earthquake, fi nding that the<br />
density <strong>of</strong> the slide material ranged from 2,000 kg/m 3 to<br />
2,110 kg/m 3 (125 lb/ft 3 to 132 lb/ft 3 ). Unfortunately, there<br />
are no measurements <strong>of</strong> the slide viscosity, but sensitivity<br />
studies by Rabinovich <strong>and</strong> others (2003) demonstrate<br />
that the infl uence <strong>of</strong> kinematic viscosity on <strong>tsunami</strong> wave<br />
heights is not signifi cant. We assume slide density <strong>of</strong><br />
ρ=2,000 kg/m 3 (125 lb /ft 3 ) <strong>and</strong> slide kinematic viscosity<br />
<strong>of</strong> μ=0.05 m 2 /s (0.54 ft 2 /s). The slide thickness is shown<br />
in fi gure 14. At the open boundary <strong>of</strong> the numerical<br />
grid, we specify the radiation boundary condition for<br />
the water waves. We numerically model triggering <strong>of</strong><br />
l<strong>and</strong>slide <strong>and</strong> simulate the l<strong>and</strong>slide-generated <strong>tsunami</strong><br />
waves in Passage Canal for 5 minutes with the 0.01<br />
second time step.<br />
7 The tidal range at Whittier is 3.7 m (12.1 ft) from MHHW to MLLW. We note that currently MLLW is1.99 m (6.52 ft) below MSL as opposed<br />
to 1.92 m (6.3 ft) in 1964, when Kachadoorian reported it. In this work the change in the MLLW datum as well as the post-seismic rebound<br />
in Whittier were assumed to be negligibly small.
A<br />
B<br />
A)<br />
60°4730<br />
60°4700<br />
60°4630<br />
B)<br />
60°4900<br />
60°4830<br />
60°4800<br />
60°4730<br />
60°4700<br />
60°4630<br />
Tsunami <strong>inundation</strong> <strong>maps</strong> <strong>of</strong> Whittier <strong>and</strong> <strong>western</strong> Passage Canal, Alaska 25<br />
Bathymetry pr<strong>of</strong>i les<br />
Modeled MLLW 1964 shoreline<br />
-148°43 -148°42 -148°41 -148°40<br />
Modeled MLLW 1964 shoreline<br />
Airport<br />
L<strong>and</strong>slide<br />
North Shore<br />
L<strong>and</strong>slide<br />
Glacier<br />
L<strong>and</strong>slide<br />
Harbor<br />
L<strong>and</strong>slide<br />
Billings Creek<br />
L<strong>and</strong>slide<br />
-148°43 -148°42 -148°41 -148°40 -148°39 -148°38 -148°37 -148°36<br />
meters<br />
meters<br />
Figure 14. Illustrations showing initial thickness <strong>of</strong> l<strong>and</strong>slides. (A) Harbor–Airport–Glacier (HAG) l<strong>and</strong>slide<br />
complex, with a volume <strong>of</strong> 15 million m 3 (530 million ft 3 ). (B) Locations <strong>and</strong> thicknesses <strong>of</strong> the north shore <strong>and</strong><br />
Billings Creek l<strong>and</strong>slides. The volume <strong>of</strong> each l<strong>and</strong>slide is 10 million m 3 (350 million ft 3 ). The locations <strong>of</strong> bathymetry<br />
pr<strong>of</strong>i les used to constrain the HAG l<strong>and</strong>slide are shown by green lines (A); simulated pre-earthquake<br />
MLLW shoreline is shown by a dashed yellow line (B).
26 Report <strong>of</strong> Investigations 2011-7<br />
A B C<br />
Figure 15. Schematic drawings <strong>of</strong> the city harbor before the earthquake (A), after the earthquake <strong>and</strong> during the<br />
l<strong>and</strong>slide-generated <strong>tsunami</strong> (B), <strong>and</strong> at the present (C). S is the coseismic subsidence; D is the elevation <strong>of</strong><br />
harbor parking with respect to the MHHW; η is the water level.<br />
Figure 16a shows modeled <strong>inundation</strong> by <strong>tsunami</strong><br />
waves that are generated by ground failures according to<br />
scenarios 10–13. The observed extent <strong>of</strong> <strong>inundation</strong> after<br />
the 1964 earthquake is shown by the solid yellow line.<br />
Before analyzing the modeling results, we emphasize<br />
an interesting fact: There was no observed <strong>inundation</strong><br />
behind the reinforced concrete building <strong>of</strong> the railroad<br />
depot (marked by a red rectangle with black border)<br />
during the 1964 event. This fact reveals that a <strong>tsunami</strong><br />
wave that hit the depot was traveling in a southwest<br />
direction. We recall that Kachadoorian (1965) also mentions<br />
that the waves originated along the north coastline<br />
<strong>of</strong> the <strong>canal</strong> <strong>and</strong> traveled in a southwest direction. Unfortunately,<br />
the current version <strong>of</strong> the DEM lacks the<br />
railroad building (demolished in 2002), <strong>and</strong> hence the<br />
modeled runup should signifi cantly extend inl<strong>and</strong> <strong>and</strong><br />
“fi ll the gap” behind it.<br />
In fi gure 16, the modeling results show a directional<br />
pattern <strong>of</strong> <strong>inundation</strong> corresponding to each l<strong>and</strong>slidegenerated<br />
<strong>tsunami</strong>. The HAG slide-generated <strong>tsunami</strong><br />
causes signifi cant <strong>inundation</strong> (blue line) at the head<br />
<strong>of</strong> Passage Canal <strong>and</strong> the <strong>western</strong> side <strong>of</strong> the Whittier<br />
downtown, whereas the <strong>inundation</strong> by north shore<br />
l<strong>and</strong>slide-generated <strong>tsunami</strong> (green line) is localized at<br />
the eastern part <strong>of</strong> the town, particularly near the railroad<br />
depot. Note that the energy <strong>of</strong> the Billings Creek<br />
l<strong>and</strong>slide-generated <strong>tsunami</strong> is primarily directed toward<br />
the south coast <strong>and</strong> quickly dissipates in the direction<br />
<strong>of</strong> the harbor area. Therefore this l<strong>and</strong>slide-generated<br />
<strong>tsunami</strong> causes an insignifi cant <strong>inundation</strong> (light blue<br />
line) beyond the coastline (dashed yellow line) at the<br />
time <strong>of</strong> the 1964 earthquake.<br />
Taking into account that the HAG l<strong>and</strong>slide confi<br />
guration is roughly approximated by the bathymetry<br />
difference pr<strong>of</strong>i les, the modeling results show a good<br />
comparison with observations in the <strong>western</strong> part <strong>of</strong><br />
downtown. The <strong>tsunami</strong> triggered by the north shore<br />
l<strong>and</strong>slide models the observed southwest-traveling<br />
wave <strong>and</strong> inundates an area behind the depot; however,<br />
the modeled <strong>inundation</strong> extent is less than the observed<br />
one. Consequently, we model scenario 13 <strong>and</strong> simulate<br />
<strong>tsunami</strong> waves in the case <strong>of</strong> all l<strong>and</strong>slides failing<br />
simultaneously. Although it is possible that individual<br />
slides were triggered at different times during or after<br />
the ground shaking, there is neither evidence to support<br />
nor to reject this hypothesis.<br />
In scenario 13, we assume that all slides are initially<br />
at rest <strong>and</strong> are simultaneously triggered into motion by<br />
ground shaking. The resultant modeled <strong>inundation</strong> (red<br />
line) signifi cantly extends inl<strong>and</strong>, particularly within the<br />
downtown area. The discrepancy between the modeled<br />
<strong>and</strong> observed <strong>inundation</strong> in the <strong>western</strong> part <strong>of</strong> Whittier<br />
can be explained by the presence <strong>of</strong> a signifi cant fl at<br />
area in the present DEM (the topography was altered by<br />
the addition <strong>of</strong> the parking lot, which was constructed<br />
after the 1964 event), where the waves triggered by the<br />
HAG <strong>and</strong> north slides arrive at the same time <strong>and</strong> collide<br />
with each other. Note that a small temporal delay<br />
in l<strong>and</strong>slide failures can change arrival time <strong>of</strong> these<br />
waves <strong>and</strong> hence signifi cantly modify their non-linear<br />
interference. Unfortunately, the timing <strong>of</strong> future l<strong>and</strong>slide<br />
failure is unknown <strong>and</strong> additional research in this<br />
area is necessary.<br />
Figure 16b shows that the model captures an extreme<br />
runup at the northern shore <strong>of</strong> Passage Canal. The highest<br />
modeled value <strong>of</strong> runup at the northern shore is about<br />
24 m (79 ft) above the pre-earthquake MSL, when approximately<br />
31.7 m (104 ft) above sea level <strong>inundation</strong><br />
was reported after the 1964 event. The highest wave in<br />
Whittier was observed at the small boat harbor (point<br />
5, fi gure A-2), northeast <strong>of</strong> the railroad depot, where the<br />
wave reached 13.1 m (43 ft). At the railroad depot itself,
60 ° 47 30<br />
60 ° 47 00<br />
60 ° 46 30<br />
<br />
Tsunami <strong>inundation</strong> <strong>maps</strong> <strong>of</strong> Whittier <strong>and</strong> <strong>western</strong> Passage Canal, Alaska 27<br />
<br />
<br />
<br />
<br />
<br />
<br />
<br />
<br />
<br />
-148 ° 43 -148 ° 42 -148 ° 41 -148 ° 40<br />
<br />
<br />
Figure 16. Maximum computed runup caused by l<strong>and</strong>slide-generated <strong>tsunami</strong> waves in Passage Canal during the<br />
1964 event. (A) Modeled <strong>inundation</strong> lines for scenarios 10–13. (B) Maximum modeled runup heights within<br />
the <strong>inundation</strong> zone for Scenario 13. Runup height is in meters above the pre-earthquake MLLW datum. The<br />
yellow line represents observed <strong>inundation</strong> caused by the 1964 <strong>tsunami</strong>. The modeled MLLW shoreline before<br />
the earthquake is shown by a dashed yellow line.
28 Report <strong>of</strong> Investigations 2011-7<br />
according to eyewitnesses, the wave was about 12.2 m<br />
(40 ft) high. Figure 17 shows water level dynamics at<br />
several locations along the Whittier waterfront. We note<br />
that the model captures well the observed wave heights at<br />
the eastern part <strong>of</strong> Whittier (points 2 <strong>and</strong> 5, fi gure A-2),<br />
however, the modeled extent <strong>of</strong> <strong>inundation</strong> is farther<br />
inl<strong>and</strong> than the observed extent along Depot Road. At the<br />
location <strong>of</strong> the completely destroyed Columbia Lumber<br />
Co. (point 6, fi gure A-2) on the right bank <strong>of</strong> Whittier<br />
Creek, the modeled wave reached an altitude <strong>of</strong> 9 m (29<br />
ft) above ground, suffi cient to totally disintegrate industrial<br />
buildings <strong>and</strong> scatter debris as shown in the aerial<br />
photography after the 1964 event (Kachadoorian, 1965).<br />
Although the model captures the south–southwesttraveling<br />
waves that struck the southern shore <strong>of</strong> Passage<br />
Canal about 1,300 m (4,270 ft) west <strong>of</strong> Whittier Creek<br />
with tremendous force (Kachadoorian, 1965), the height<br />
<strong>of</strong> the modeled wave seems to be underpredicted. The<br />
reported runup in this area was approximately 15 m (49<br />
ft), whereas the numerically modeled runup is about 7<br />
m (23 ft). The disparity between modeling results <strong>and</strong><br />
observation reveal the likelihood that multiple l<strong>and</strong>slides<br />
occurred at the northern shore <strong>of</strong> Passage Canal;<br />
however, without adequate bathymetry it is diffi cult to<br />
constrain their locations <strong>and</strong> thicknesses.<br />
Water level above ground (meters)<br />
10<br />
9<br />
8<br />
7<br />
6<br />
5<br />
4<br />
3<br />
2<br />
1<br />
Preliminary computations show that it takes approximately<br />
60 minutes for <strong>tsunami</strong> waves generated<br />
in the Gulf <strong>of</strong> Alaska outside <strong>of</strong> Prince William Sound<br />
to travel into the Whittier harbor. The 1964 earthquake<br />
occurred at 5:30 p.m. local time in Whittier when tides<br />
were 0.3 m (1 ft) above the MLLW. We note that the<br />
difference between the MHHW <strong>and</strong> MLLW in Whittier<br />
is 3.7 m (12 ft). Figure 18 shows simulated water level<br />
dynamics in the Whittier harbor <strong>and</strong> suggests that the<br />
maximum height <strong>of</strong> the waves that hit Whittier was<br />
about 3.5 m (11.5 ft) at the MLW tide, if the local 1.6 m<br />
(5.3 ft) subsidence is taken into account. Note that this<br />
wave height is within the tidal range for the community<br />
<strong>and</strong> does not produce fl ooding since the harbor parking<br />
lot elevation is approximately 2–3 m (6.6–9.8 ft) above<br />
the MHHW water level. The computed <strong>inundation</strong>s<br />
by <strong>tsunami</strong> waves generated by the JDM, SDM, <strong>and</strong><br />
l<strong>and</strong>slides as well as the observed 1964 <strong>inundation</strong> zone<br />
in Whittier are shown in fi gure 19. The dashed yellow<br />
line represents 0 m (0 ft) elevation with respect to the<br />
sea level in Whittier at the time <strong>of</strong> the earthquake. The<br />
modeled <strong>inundation</strong> by JDM <strong>and</strong> SDM almost coincide<br />
with the shoreline, except for low-lying areas at the<br />
head <strong>of</strong> Passage Canal. This explains why the residents<br />
<strong>of</strong> Whittier did not observe the arrival <strong>of</strong> tectonic waves<br />
after the earthquake.<br />
Point 2, elevation 8.1 m (26.6 ft)<br />
Point 5, elevation 6.4 m (21 ft)<br />
Point 6, elevation 7.4 m (24.3 ft)<br />
Point 16, elevation 7.4 m (24.3 ft)<br />
0<br />
0 1 2 3 4 5<br />
Time after the earthquake (minutes)<br />
Figure 17. Modeled water level dynamics <strong>of</strong> l<strong>and</strong>slide-generated waves at certain locations near the Whittier<br />
waterfront. Locations <strong>of</strong> points 2, 5, 6, <strong>and</strong> 16 are shown in fi gure A-1.
The JDM <strong>of</strong> the 1964 rupture<br />
The SDM <strong>of</strong> the 1964 rupture<br />
3<br />
Tsunami <strong>inundation</strong> <strong>maps</strong> <strong>of</strong> Whittier <strong>and</strong> <strong>western</strong> Passage Canal, Alaska 29<br />
2<br />
1<br />
Water level (meters)<br />
0<br />
0 6 12 18 24<br />
<br />
Time after the earthquake (hours)<br />
Figure 18. Modeled water level dynamics at point 20 in the Whittier harbor (see fi gure A-1 for location) during the 1964 tectonic <strong>tsunami</strong>, based on the SDM <strong>and</strong> JDM. Water level<br />
is in meters with respect to the post-earthquake MLLW datum.
30 Report <strong>of</strong> Investigations 2011-7<br />
RESULTS OF HYPOTHETICAL TSUNAMI<br />
SCENARIOS<br />
We performed numerical calculations for all the<br />
above-mentioned scenarios. For scenarios that describe<br />
tectonic <strong>tsunami</strong>s, we modeled the water dynamics in<br />
each grid (listed in table 1) <strong>and</strong> computed the extent <strong>of</strong><br />
<strong>inundation</strong> only in the high-resolution grid. For scenarios<br />
related to the l<strong>and</strong>slide-generated <strong>tsunami</strong>s, we simulate<br />
the water dynamics <strong>and</strong> only in the high resolution grid<br />
<strong>and</strong> compute the runup therein.<br />
We begin discussion <strong>of</strong> our modeling results by<br />
noting that a potential rupture <strong>of</strong> the Yakataga segment<br />
predicts subsidence <strong>of</strong> the ocean bottom in the Prince<br />
William Sound (PWS) area, while the Johnson <strong>and</strong> Suito<br />
deformation models (JDM <strong>and</strong> SDM; scenarios 1 <strong>and</strong><br />
2, respectively) suggest an uplift in this region. For the<br />
sake <strong>of</strong> brevity, we consider only the JDM rupture. The<br />
vertical displacement <strong>of</strong> the multi-segment JDM rupture<br />
(scenario 3) in the PWS region is less than that produced<br />
by the JDM rupture (scenario1). Since the leading wave<br />
arrives at Passage Canal from the PWS region, the<br />
height <strong>of</strong> the leading wave caused by the multi-segment<br />
JDM rupture is less than that due to the JDM rupture.<br />
In fi gure 20a, we show the computed sea level dynamics<br />
inside the Whittier harbor for the JDM (scenario 1)<br />
<strong>and</strong> the multi-segment JDM rupture (scenario 3). Note<br />
that the modeled tectonic <strong>tsunami</strong> generated in scenario<br />
3 is approximately 0.3 m (1 ft) less than for scenario<br />
1, even though the rupture in scenario 3 models a far<br />
greater earthquake. The wave from the rupturing YY<br />
segment arrives approximately 2 hours after the onset<br />
<strong>of</strong> the earthquake <strong>and</strong> generates additional oscillations<br />
on top <strong>of</strong> the already existing <strong>tsunami</strong>. These oscillations<br />
superimpose <strong>and</strong> produce a large wave 7 hours<br />
after the earthquake, shown by an arrow in fi gure 20a.<br />
Note that the modeled <strong>inundation</strong>s in scenarios 1 <strong>and</strong><br />
3 are signifi cantly different within the city <strong>of</strong> Whittier.<br />
Although the difference in the modeled wave height is<br />
relatively small, the computed <strong>inundation</strong> area is different<br />
due to ground leveling, developing the parking<br />
lot, <strong>and</strong> the non-linear nature <strong>of</strong> the runup. Figure 20b<br />
shows computed <strong>inundation</strong> zones for <strong>tsunami</strong> waves,<br />
generated by a potential rupture <strong>of</strong> the 1964 Great Alaska<br />
Earthquake (scenario 1) <strong>and</strong> its extension over the YY<br />
segment (scenario 3).<br />
Analysis <strong>of</strong> <strong>tsunami</strong>s triggered by rupturing <strong>of</strong> the<br />
Kodiak Isl<strong>and</strong> (KI) asperity <strong>of</strong> the 1964 event reveals<br />
that the waves arriving at Whittier do not exceed 0.5 m<br />
(1.6 ft) height <strong>and</strong> can produce only a moderate <strong>inundation</strong><br />
in low-lying areas. The comparison <strong>of</strong> numerical<br />
results, related to rupturing <strong>of</strong> the entire 1964 zone<br />
<strong>and</strong> its PWS asperity alone, shows that the modeled<br />
<strong>inundation</strong> zones are identical in Whittier, since the<br />
<strong>tsunami</strong> primarily arrives at Passage Canal from the<br />
PWS region. Finally, we compare potential inunda-<br />
tion by the l<strong>and</strong>slide-generated <strong>tsunami</strong>s, for instance,<br />
scenarios 10–13 in fi gure 21. Scenario 13 produces the<br />
greatest <strong>inundation</strong> <strong>and</strong> can be considered one <strong>of</strong> the<br />
worst credible scenarios. Therefore, we only plot the<br />
following potential <strong>inundation</strong> zones in fi gure 22. The<br />
<strong>inundation</strong> zones related to scenario 1 (the JDM <strong>of</strong> the<br />
1964 rupture), scenario 2 (the SDM <strong>of</strong> the 1964 rupture),<br />
scenario 5 (the Cascadia Zone rupture), <strong>and</strong> scenario<br />
13 (failing <strong>of</strong> all potential l<strong>and</strong>slides) are delineated by<br />
green, blue, light blue, <strong>and</strong> red lines, respectively. The<br />
observed 1964 <strong>inundation</strong> is shown by the solid yellow<br />
line, whereas the present-day shore (MHHW datum) is<br />
outlined by a dashed yellow line.<br />
Figure 23 shows the maximum composite calculated<br />
extent <strong>of</strong> <strong>inundation</strong> for all 13 scenarios, <strong>and</strong> the maximum<br />
composite fl ow depths over dry l<strong>and</strong>. Note that the<br />
<strong>tsunami</strong> fl ow depth is one <strong>of</strong> the important indicators <strong>of</strong><br />
potential damage, <strong>and</strong> must be differentiated from runup<br />
height (Synolakis <strong>and</strong> Bernard, 2006). For easier visual<br />
reference, we indicate the values <strong>of</strong> 0.5 m (1.6 ft), which<br />
approximately corresponds to a knee height, <strong>and</strong> 2 m<br />
(6.6 ft), which is just above the average person’s body<br />
height. In several areas in the <strong>western</strong> section <strong>of</strong> the<br />
tidal fl ats, the 1964 <strong>inundation</strong> limit extends beyond the<br />
maximum estimated <strong>inundation</strong>. We did not adjust the<br />
maximum calculated <strong>inundation</strong> extent in these areas to<br />
match the 1964 limit, because observations in this area<br />
are not particularly reliable.<br />
TIME SERIES AND OTHER<br />
NUMERICAL RESULTS<br />
To help emergency managers assess the <strong>tsunami</strong> hazard<br />
in Whittier, we supplement the <strong>inundation</strong> <strong>maps</strong> with<br />
the time series <strong>of</strong> the modeled water level <strong>and</strong> velocity<br />
dynamics at certain locations around Passage Canal. The<br />
locations are chosen <strong>and</strong> recommended (oral commun.<br />
with the city manager) both within the developed areas<br />
<strong>and</strong> <strong>of</strong>fshore from a proposed subdivision in Shotgun<br />
Cove. For each location shown by a number in fi gure<br />
A-1 (A <strong>and</strong> B), we plot the sea level <strong>and</strong> water velocity<br />
in fi gures A-2 <strong>and</strong> A-3. The zero time corresponds to<br />
the epicenter origin time. Elevations <strong>of</strong> onshore locations<br />
correspond to the post-earthquake MHHW datum,<br />
while for <strong>of</strong>fshore locations we use the pre-earthquake<br />
datum to show the height <strong>of</strong> arriving <strong>tsunami</strong> waves. The<br />
dashed lines show the water level after the <strong>tsunami</strong>. Since<br />
velocity magnitude is calculated as water fl ux divided<br />
by water depth, the velocity value can have large uncertainties<br />
if the water depth is small. In the plots provided,<br />
the velocity is computed only where the water depth is<br />
greater than 0.3 m (1 ft).<br />
Analysis <strong>of</strong> the time series plot shows that the northern<br />
shore slide can create a devastating wave directed<br />
towards the eastern part <strong>of</strong> the city, (for example, points<br />
1, 2, 4, <strong>and</strong> 5), while the potential HAG slides can also
The 1964 earthquake JDM<br />
The 1964 earthquake SDM<br />
L<strong>and</strong>slide, scenario 13<br />
Observed 1964 <strong>inundation</strong><br />
Modeled MLLW 1964 shoreline<br />
<br />
Tsunami <strong>inundation</strong> <strong>maps</strong> <strong>of</strong> Whittier <strong>and</strong> <strong>western</strong> Passage Canal, Alaska 31<br />
<br />
<br />
<br />
<br />
Figure 19. Observed <strong>and</strong> modeled 1964 <strong>inundation</strong> caused by tectonic <strong>and</strong> l<strong>and</strong>slide-generated waves. The yellow line represents the observed <strong>inundation</strong> after the<br />
1964 <strong>tsunami</strong>. The modeled MLLW shoreline before the earthquake is shown by a dashed yellow line. The DEM height corresponds to the pre-earthquake sea<br />
level datum.
32 Report <strong>of</strong> Investigations 2011-7<br />
impact the <strong>western</strong> part <strong>of</strong> Whittier, (for example, points<br />
6, 8, <strong>and</strong> 14). Note that points 3 <strong>and</strong> 15 are not inundated<br />
if the northern <strong>and</strong> HAG l<strong>and</strong>slides fail separately, but<br />
are inundated if they fail together, as shown in fi gure 21.<br />
Unfortunately, it is impossible to determine the timing<br />
<strong>of</strong> potential failures, <strong>and</strong> it is recommended to consider<br />
that points 3 <strong>and</strong> 15 can be fl ooded. Although the Billings<br />
Creek slide produces a relatively small wave (for<br />
A<br />
<br />
B<br />
<br />
<br />
1<br />
<br />
<br />
<br />
<br />
<br />
6<br />
<br />
<br />
° <br />
<br />
<br />
<br />
°<br />
°<br />
<br />
example, points 19 <strong>and</strong> 25), it can devastate the southern<br />
shore <strong>of</strong> Passage Canal. The numerical calculations<br />
show that the runup from this slide at certain areas near<br />
Shotgun Cove can reach up to 10 m (33 ft). Large uncertainties<br />
in the digital elevation model (DEM) east <strong>of</strong><br />
Whittier, particularly along the shore <strong>of</strong> Shotgun Cove,<br />
impede development <strong>of</strong> <strong>inundation</strong> <strong>maps</strong> east <strong>of</strong> the<br />
Whittier downtown.<br />
<br />
<br />
° ° ° °<br />
<br />
<br />
Figure 20. (A) Computed water level dynamics in the Whittier harbor, according to scenarios 1 <strong>and</strong> 3. The water<br />
level is plotted with respect to the sea level just prior to the earthquake, to show the height <strong>of</strong> <strong>tsunami</strong> wave<br />
crests. Arrival <strong>of</strong> the fi rst wave from the rupturing YY segment <strong>and</strong> a local maximum <strong>of</strong> the water level are<br />
shown by arrows. The dashed lines (fi nal level) show the water level after the <strong>tsunami</strong> passes. (B) Computed<br />
<strong>inundation</strong> areas, according to scenarios 1 <strong>and</strong> 3.
148°40'30"W<br />
148°42'0"W<br />
60°47'30"N<br />
Scenario 13, combined slide<br />
Scenario 10, HAG slides<br />
Scenario 11, northern shore slide<br />
Scenario 12, Billings Creek slide<br />
Observed 1964 <strong>inundation</strong><br />
Present-day MHHW shoreline<br />
60°47'30"N<br />
0 125 250 500 meters<br />
0 0.125 0.25 0.5 miles<br />
60°47'0"N<br />
Tsunami <strong>inundation</strong> <strong>maps</strong> <strong>of</strong> Whittier <strong>and</strong> <strong>western</strong> Passage Canal, Alaska 33<br />
60°47'0"N<br />
60°46'30"N<br />
60°46'30"N<br />
148°40'30"W<br />
148°42'0"W<br />
Figure 21. Maximum computed potential runup by l<strong>and</strong>slide-generated <strong>tsunami</strong> waves in Passage Canal for scenarios 10–13. The yellow line represents observed <strong>inundation</strong><br />
after the 1964 <strong>tsunami</strong>. The present-day MHHW shoreline is shown by a dashed yellow line. Locations <strong>of</strong> points 3 <strong>and</strong> 15 are shown by rectangles.
34 Report <strong>of</strong> Investigations 2011-7<br />
148°40'30"W<br />
148°42'0"W<br />
60°47'30"N<br />
Scenario 1, Rupture <strong>of</strong> the 1964 earthquake, based on the JDM<br />
Scenario 2, Rupture <strong>of</strong> the 1964 earthquake, based on the SDM<br />
Scenario 5, Rupture <strong>of</strong> the Cascadia zone<br />
Scenario 13, combined slide<br />
Observed 1964 <strong>inundation</strong><br />
60°47'30"N<br />
Present-day MHHW shoreline<br />
0 125 250 500 meters<br />
0 0.125 0.25 0.5 miles<br />
60°47'0"N<br />
60°47'0"N<br />
60°46'30"N<br />
60°46'30"N<br />
148°40'30"W<br />
148°42'0"W<br />
Figure 22. Modeled potential <strong>inundation</strong> by tectonic <strong>and</strong> l<strong>and</strong>slide-generated waves for the selected scenarios. The DEM corresponds to the present-day MHHW datum. Due to the steep topography,<br />
<strong>inundation</strong> areas for several <strong>tsunami</strong> scenarios have a common boundary, <strong>and</strong> the plotted extents <strong>of</strong> the <strong>inundation</strong> areas may overlay each other.
148°40'30"W<br />
148°42'0"W<br />
Maximum Inundation<br />
2.0m (6.6 ft) <strong>inundation</strong> depth<br />
60°47'30"N<br />
0.5m (1.6 ft) <strong>inundation</strong> depth<br />
Present-day MHHW shoreline<br />
Observed 1964 <strong>inundation</strong><br />
60°47'30"N<br />
0 125 250 500 meters<br />
0 0.125 0.25 0.5 miles<br />
60°47'0"N<br />
Tsunami <strong>inundation</strong> <strong>maps</strong> <strong>of</strong> Whittier <strong>and</strong> <strong>western</strong> Passage Canal, Alaska 35<br />
60°47'0"N<br />
60°46'30"N<br />
60°46'30"N<br />
148°40'30"W<br />
148°42'0"W<br />
Figure 23. Maximum composite potential <strong>inundation</strong> due to tectonic <strong>and</strong> l<strong>and</strong>slide-generated waves for all scenarios shown in fi gure 21, <strong>and</strong> the maximum composite fl ow<br />
depths over dry l<strong>and</strong>. The DEM corresponds to the present-day MHHW datum.
36 Report <strong>of</strong> Investigations 2011-7<br />
SOURCES OF ERRORS AND<br />
UNCERTAINTIES<br />
The hydrodynamic model used to calculate <strong>tsunami</strong><br />
propagation <strong>and</strong> runup is a nonlinear fl ux-formulated<br />
shallow water model (Nicolsky <strong>and</strong> others, 2011). It<br />
passed the validation tests required for models used in<br />
production <strong>of</strong> <strong>tsunami</strong> <strong>inundation</strong> <strong>maps</strong> (Synolakis <strong>and</strong><br />
others, 2007).<br />
The source mechanism remains the biggest unknown<br />
in the problem <strong>of</strong> <strong>tsunami</strong> modeling. Since the<br />
initial condition for the modeling is determined by the<br />
displacement <strong>of</strong> the ocean bottom, the largest source<br />
<strong>of</strong> errors is the earthquake model. When the <strong>tsunami</strong> is<br />
generated in the vicinity <strong>of</strong> the coast, the direction <strong>of</strong> the<br />
incoming waves, their amplitudes, <strong>and</strong> times <strong>of</strong> arrival<br />
are determined by the initial displacements <strong>of</strong> the ocean<br />
surface in the source area because the distance to the<br />
shore is too small for the waves to disperse. Therefore,<br />
the near-fi eld <strong>inundation</strong> modeling results are especially<br />
sensitive to the fi ne structure <strong>of</strong> the <strong>tsunami</strong> source. The<br />
modeling process is highly sensitive to errors when the<br />
complexity <strong>of</strong> the source function is combined with its<br />
proximity to the coastal zone.<br />
During development <strong>of</strong> the <strong>tsunami</strong> <strong>inundation</strong> <strong>maps</strong>,<br />
a spatially averaged ground subsidence is assumed for<br />
the entire city <strong>of</strong> Whittier. However, during a potential<br />
earthquake, soil compaction in areas <strong>of</strong> unconsolidated<br />
deposits in the coastal area might occur <strong>and</strong> an extent<br />
<strong>of</strong> the <strong>tsunami</strong> <strong>inundation</strong> could be farther l<strong>and</strong>ward.<br />
Finally we mention that the horizontal resolution <strong>of</strong> the<br />
grid used for <strong>inundation</strong> modeling is 15 m (49 ft). This<br />
scale is limited by the resolution <strong>of</strong> the topographic <strong>and</strong><br />
bathymetric data used for the grid construction. The 15<br />
m (49 ft) resolution is high enough to describe major<br />
relief features, but small topographic features, buildings,<br />
<strong>and</strong> other facilities cannot be accurately resolved by the<br />
existing model.<br />
SUMMARY<br />
We present the results <strong>of</strong> numerical modeling <strong>of</strong><br />
earthquake-generated <strong>tsunami</strong> waves for the Whittier<br />
area <strong>and</strong> <strong>western</strong> Passage Canal, Alaska. The <strong>maps</strong> showing<br />
the results <strong>of</strong> our modeling have been completed<br />
using the best information available, <strong>and</strong> are believed<br />
to be accurate, however, their preparation required<br />
many assumptions. We considered several tectonic <strong>and</strong><br />
l<strong>and</strong>slide scenarios <strong>and</strong> provide an estimate <strong>of</strong> maximum<br />
credible <strong>tsunami</strong> <strong>inundation</strong>. Actual conditions during a<br />
<strong>tsunami</strong> event may vary from those considered, so the<br />
accuracy cannot be guaranteed. The limits <strong>of</strong> <strong>inundation</strong><br />
shown should be used only as a guideline for emergency<br />
planning <strong>and</strong> response action. Actual areas inundated<br />
will depend on specifi cs <strong>of</strong> the earth deformations, on<br />
l<strong>and</strong> construction, <strong>and</strong> tide level, <strong>and</strong> they may differ<br />
from areas shown on the map. The information on this<br />
map is intended to permit state <strong>and</strong> local agencies to plan<br />
emergency evacuation <strong>and</strong> <strong>tsunami</strong> response actions in<br />
the event <strong>of</strong> a major <strong>tsunami</strong>genic earthquake. These<br />
results are not intended for l<strong>and</strong>-use regulation.<br />
ACKNOWLEDGMENTS<br />
This project was supported by the National Oceanic<br />
<strong>and</strong> Atmospheric Administration grants 27-014d <strong>and</strong> 06-<br />
028a through Cooperative Institute for Arctic Research.<br />
Numerical calculations for this work were supported by a<br />
grant <strong>of</strong> High Performance Computing (HPC) resources<br />
from the Arctic Region Supercomputing Center (ARSC)<br />
at the University <strong>of</strong> Alaska Fairbanks as part <strong>of</strong> the U.S.<br />
Department <strong>of</strong> Defense High Performance Computing<br />
Modernization Program. Reviews by Dr. Timothy Walsh<br />
<strong>and</strong> Dr. Juan Horrillo improved the report <strong>and</strong> <strong>maps</strong>. We<br />
thank R. Grapenthin <strong>and</strong> B. Witte for their help with the<br />
RTK GPS survey in Whittier.<br />
REFERENCES CITED<br />
Alaska Division <strong>of</strong> Community Advocacy, 2005, Seward<br />
community overview: State <strong>of</strong> Alaska Community<br />
Database Online, http://www.commerce.state.ak.us/<br />
dca/commdb/CF_BLOCK.cfm.<br />
Assier-Rzadkiewicz, S., Mariotti, C., <strong>and</strong> Heinrich, P.,<br />
1997, Numerical simulation <strong>of</strong> submarine l<strong>and</strong>slides<br />
<strong>and</strong> their hydraulic effects: Journal <strong>of</strong> Waterway,<br />
Port, Coastal, <strong>and</strong> Ocean Engineering, v. 123, no. 4,<br />
p. 149–157.<br />
Atwater, B.F., 1987, Evidence for great Holocene earthquakes<br />
along the outer coast <strong>of</strong> Washington State:<br />
Science, v. 236, p. 942–944.<br />
Atwater, B.F., Musumi-Rokkaku, Satoku, Satake, Kenji,<br />
Tsuji, Yoshinobu, Ueda, Kazue, <strong>and</strong> Yamaguchi,<br />
D.K., 2005, The orphan <strong>tsunami</strong> <strong>of</strong> 1700—Japanese<br />
clues to a parent earthquake in North America: U.S.<br />
Geological Survey Pr<strong>of</strong>essional Paper 1707 (prepared<br />
in cooperation with the Geological Survey <strong>of</strong><br />
Japan, the University <strong>of</strong> Tokyo, <strong>and</strong> the University<br />
<strong>of</strong> Washington, <strong>and</strong> published in association with<br />
University <strong>of</strong> Washington Press), 133 p.<br />
Bornhold, B.D., Thomson, R.E., Rabinovich, A.B.,<br />
Kulikov, E.A., <strong>and</strong> Fine, I.V., 2001, Risk <strong>of</strong> l<strong>and</strong>slidegenerated<br />
<strong>tsunami</strong>s for the coast <strong>of</strong> British Columbia<br />
<strong>and</strong> Alaska, in Mahmoud, M., van Everdingen, R.,<br />
<strong>and</strong> Carss, J., eds., An earth odyssey—Proceedings<br />
<strong>of</strong> the 54th Canadian Geotechnical Society Conference:<br />
Richmond, B.C., Bitech Publishers, Ltd.,<br />
p. 1,450–1,454.
Caldwell, R.J., Eakins, B.W., <strong>and</strong> Lim, E., 2009,<br />
Digital elevation models <strong>of</strong> Prince William Sound,<br />
Alaska—Procedures, Data Sources <strong>and</strong> Analysis:<br />
Boulder, Colorado, National Geophysical Data<br />
Center, NOAA, 43 p., www.ngdc.noaa.gov/dem/<br />
report/download/1305.<br />
Carver, G.A., <strong>and</strong> Plafker, George, 2008, Paleoseismicity<br />
<strong>and</strong> neotectonics <strong>of</strong> the Aleutian subduction zone—<br />
An overview, in Freymueller, J.T., Haeussler, P.J.,<br />
Wesson, R.L, <strong>and</strong> Ekström, G., eds., Active tectonics<br />
<strong>and</strong> seismic potential <strong>of</strong> Alaska: American Geophysical<br />
Union Geophysical Monograph 179, p. 43–63.<br />
Christensen, D.H., <strong>and</strong> Beck, S.L., 1994, The rupture<br />
process <strong>and</strong> tectonic implications <strong>of</strong> the Great 1964<br />
Prince William Sound Earthquake: Pure <strong>and</strong> Applied<br />
Geophysics, v. 142, no. 1, p. 29–53.<br />
DeMets, Charles, Gordon, R.C., Argus, D.F., <strong>and</strong> Stein,<br />
Seth, 1990, Current plate motions: Geophysical Journal<br />
International, v. 101, no. 2, p. 425–478.<br />
Doser, D.I., <strong>and</strong> Brown, W.A., 2001, A study <strong>of</strong> historic<br />
earthquakes <strong>of</strong> the Prince William Sound, Alaska,<br />
region: Bulletin <strong>of</strong> the Seismological Society <strong>of</strong><br />
America, v. 91, no. 4, p. 842–857.<br />
Fine, I.V., Rabinovich, A.B., Kulikov, E.A., Thomson,<br />
R.E., <strong>and</strong> Bornhold, B.D., 1998, Numerical modeling<br />
<strong>of</strong> l<strong>and</strong>slide-generated <strong>tsunami</strong>s with application to<br />
the Skagway Harbor <strong>tsunami</strong> <strong>of</strong> November 3, 1994,<br />
in Proceedings, International Conference on Tsunamis:<br />
Paris, France, May 26–28, 1998, Commissariat<br />
à l’Energie Atomique (CEA), p. 211–223.<br />
Hamilton, Sarah, <strong>and</strong> Shennan, Ian, 2005, Late Holocene<br />
great earthquakes <strong>and</strong> relative sea-level change at<br />
Kenai, southern Alaska: Journal <strong>of</strong> Quaternary Science,<br />
v. 20, no. 2, p. 95–111.<br />
Hampton, M.A., Lee, H.J., <strong>and</strong> Locat, Jacques, 1996,<br />
Submarine l<strong>and</strong>slides: Reviews <strong>of</strong> Geophysics, v. 34,<br />
no. 1, p. 33–59.<br />
Hampton, M.A., Lemke, R.W., <strong>and</strong> Coulter, H.W., 2002,<br />
Submarine l<strong>and</strong>slides that had a signifi cant impact on<br />
man <strong>and</strong> his activities—Seward <strong>and</strong> Valdez, Alaska,<br />
in Schwab, W.C., Lee, H.J., <strong>and</strong> Twichell, D.C., eds.,<br />
Submarine l<strong>and</strong>slides—Selected studies in the U.S.<br />
Exclusive Economic Zone: U.S. Geological Survey<br />
Bulletin 2002, p. 123–134.<br />
Holdahl, S.R., <strong>and</strong> Sauber, Jeanne, 1994, Coseismic slip<br />
in the 1964 Prince William Sound earthquake—A<br />
new geodetic inversion: Pure <strong>and</strong> Applied Geophysics,<br />
v. 142, no. 1, p. 55–82.<br />
Ichinose, Gene, Somerville, Paul, Thio, H.K., Graves,<br />
Robert, <strong>and</strong> O’Connell, Dan, 2007, Rupture process<br />
<strong>of</strong> the 1964 Prince William Sound, Alaska,<br />
earthquake from the combined inversion <strong>of</strong> seismic,<br />
<strong>tsunami</strong>, <strong>and</strong> geodetic data: Journal <strong>of</strong> Geophysical<br />
Research, v. 112, no. B07, p. 306, 21 p.,<br />
doi:10.1029/2006JB004728.<br />
Tsunami <strong>inundation</strong> <strong>maps</strong> <strong>of</strong> Whittier <strong>and</strong> <strong>western</strong> Passage Canal, Alaska 37<br />
Jiang, Lin, <strong>and</strong> LeBlond, P.H., 1992, The coupling <strong>of</strong><br />
a submarine slide <strong>and</strong> the surface waves which it<br />
generates: Journal <strong>of</strong> Geophysical Research, v. 97,<br />
no. C8, p. 12,731–12,744.<br />
Jiang, Lin, <strong>and</strong> LeBlond, P.H., 1994, Three-dimensional<br />
modeling <strong>of</strong> <strong>tsunami</strong> generation due to a submarine<br />
mudslide: Journal <strong>of</strong> Physical Oceanography, v. 24,<br />
no. 3, p. 559–572.<br />
Johnson, J.M., Satake, Kenji, Holdahl, S.R., <strong>and</strong> Sauber,<br />
Jeanne, 1996, The 1964 Prince William Sound<br />
earthquake—Joint inversion <strong>of</strong> <strong>tsunami</strong> waveforms<br />
<strong>and</strong> geodetic data: Journal <strong>of</strong> Geophysical Research,<br />
v. 101, no. B1, p. 523–532.<br />
Kachadoorian Reuben, 1965, Effects <strong>of</strong> the earthquake<br />
<strong>of</strong> March 27, 1964, at Whittier, Alaska: U.S. Geological<br />
Survey Pr<strong>of</strong>essional Paper 542-B, p. B1–B21,<br />
3 sheets, scale 1:4,800.<br />
Kul ikov, E.A., Rabinovich, A.B., Fine, I.V., Bornhold,<br />
B.D., <strong>and</strong> Thomson, R.E., 1998, Tsunami generation<br />
by l<strong>and</strong>slides at the Pacifi c coast <strong>of</strong> North America<br />
<strong>and</strong> the role <strong>of</strong> tides: Oceanology, v. 38, no. 3,<br />
p. 323–328.<br />
L<strong>and</strong>er, J.F., 1996, Tsunamis affecting Alaska, 1737–<br />
1996: Boulder, Colorado, National Geophysical<br />
Data Center (NGDC), NOAA, Key to Geophysical<br />
Research Documentation v. 31, 195 p.<br />
Leica Geosystem AG, 2002, GPS User manual, Version<br />
4, Leica Geosystems AG, Heerbrugg, Switzerl<strong>and</strong>,<br />
62 p.<br />
Lemke, R.W., 1967, Effects <strong>of</strong> the Earthquake <strong>of</strong> March<br />
27, 1964, at Seward, Alaska: U.S. Geological Survey<br />
Pr<strong>of</strong>essional Paper 542-E, 43 p., 2 sheets, scale<br />
1:63,360.<br />
Lim, E., Eakins, B.W., <strong>and</strong> Wigley, R., 2009, Southern<br />
Alaska coastal relief model—Procedures, Data<br />
Sources, <strong>and</strong> Analysis: National Geophysical Data<br />
Center, NOAA, 25 p., http://www.ngdc.noaa.gov/<br />
mgg/coastal/s_alaska.html.<br />
National Tsunami Hazard Mapping Program (NTHMP),<br />
2010, Guidelines <strong>and</strong> best practices for <strong>tsunami</strong> <strong>inundation</strong><br />
modeling for evacuation planning: National<br />
Oceanic <strong>and</strong> Atmospheric Administration, NTHMP<br />
Mapping & Modeling Subcommittee, ftp://ftp.ngdc.<br />
noaa.gov/pub/outgoing/heather/MMS/2011_02-<br />
National/NTHMP_Modeling_Mapping_Guidelines.<br />
pdf, 7 p.<br />
Nicolsky, D.J., Suleimani, E.N., <strong>and</strong> Hansen, R.A., 2011,<br />
Validation <strong>and</strong> verifi cation <strong>of</strong> a numerical model for<br />
<strong>tsunami</strong> propagation <strong>and</strong> runup: Pure <strong>and</strong> Applied<br />
Geophysics, v. 168, p. 1,199–1,222, http://dx.doi.<br />
org/10.1007/s00024-010-0231-9.<br />
Nishenko, S.P., <strong>and</strong> Jacob, K.H., 1990, Seismic potential<br />
<strong>of</strong> the Queen Charlotte–Alaska–Aleutian seismic<br />
zone: Journal <strong>of</strong> Geophysical Research, v. 95, no.<br />
B3, p. 2,511–2,532.
38 Report <strong>of</strong> Investigations 2011-7<br />
Okada, Yoshimitsu, 1985, Surface deformation due to<br />
shear <strong>and</strong> tensile faults in a half-space: Bulletin <strong>of</strong><br />
the Seismological Society <strong>of</strong> America, v. 75, no. 4,<br />
p. 1,135–1,154.<br />
Page, R.A., Biswas, N.N., Lahr, J.C., <strong>and</strong> Pulpan,<br />
Hans, 1991, Seismicity <strong>of</strong> continental Alaska, in<br />
Slemmons, D.B., Engdahl, E.R., Zoback, M.D.,<br />
<strong>and</strong> Blackwell, D.D., eds., Neotectonics <strong>of</strong> North<br />
America: Boulder, Colorado, Geological Society <strong>of</strong><br />
America, Decade Map Volume 1, p. 47–68.<br />
Plafker, George, 1967, Surface faults on Montague<br />
Isl<strong>and</strong> associated with the 1964 Alaska earthquake:<br />
U.S. Geological Survey Pr<strong>of</strong>essional Paper 543-G,<br />
p. G1–G42.<br />
———1969, Tectonics: U.S. Geological Survey Pr<strong>of</strong>essional<br />
Paper 543-I, p. G1–G74.<br />
Plafker, George, <strong>and</strong> Thatcher, Wayne, 2008, Geological<br />
<strong>and</strong> geophysical evaluation <strong>of</strong> the mechanisms<br />
<strong>of</strong> the Great 1899 Yakutat Bay Earthquakes, in<br />
Freymueller, J.T., Haeussler, P.J., Wesson, R.L., <strong>and</strong><br />
Ekström, Goran, eds., Active tectonics <strong>and</strong> seismic<br />
potential <strong>of</strong> Alaska: Geophysical Monograph Series,<br />
v. 179, p. 215–236, ISBN 978-0-87590-444-3, doi<br />
10.1029/179GM12, AGU code GM1794443.<br />
Plafker, George, Carver, G.A., <strong>and</strong> Clarke, S.H., Jr.,<br />
2000, Seismotectonics <strong>of</strong> the 1964 Alaska earthquake<br />
as an analog for future <strong>tsunami</strong>genic southern<br />
Cascadia subduction earthquakes, in Clague, J.J.,<br />
Atwater, B.F., Wang, Kelin, Wang, M.M., <strong>and</strong> Wong,<br />
I.G, compilers, Program summary <strong>and</strong> abstracts,<br />
Geological Society <strong>of</strong> America Penrose Conference,<br />
Great Cascadia Earthquake Tricentennial: Oregon<br />
Department <strong>of</strong> Geology <strong>and</strong> Mineral Industries<br />
Special Paper 33, p. 96–97.<br />
Plafker, George, Kachadoorian, Reuben, Eckel, E.B.,<br />
<strong>and</strong> Mayo, L.R., 1969, Effects <strong>of</strong> the earthquake<br />
<strong>of</strong> March 27, 1964 on various communities: U.S.<br />
Geological Survey Pr<strong>of</strong>essional Paper 542-G, 50 p.<br />
Priest, G.R., Goldfi nger, Chris, Wang, Kelin, Witter,<br />
R.C., Zhang, Yinglong, <strong>and</strong> Baptista, A.M., 2009,<br />
Confi dence levels for <strong>tsunami</strong>-<strong>inundation</strong> limits in<br />
northern Oregon inferred from a 10,000-year history<br />
<strong>of</strong> great earthquakes at the Cascadia subduction<br />
zone: Natural Hazards, v. 54, no. 1, DOI 10.1007/<br />
s11069-009-9453-5.<br />
Rabinovich, A.B., Thomson, R.E., Bornhold, B.D., Fine,<br />
I.V., <strong>and</strong> Kulikov, E.A., 2003, Numerical modeling<br />
<strong>of</strong> <strong>tsunami</strong>s generated by hypothetical l<strong>and</strong>slides in<br />
the Strait <strong>of</strong> Georgia, British Columbia: Pure <strong>and</strong><br />
Applied Geophysics, v. 160, no. 7, p. 1,273–1,313.<br />
Santini, S., Dragoni, M., <strong>and</strong> Spada, G., 2003, Asperity<br />
distribution <strong>of</strong> the 1964 Great Alaska Earthquake <strong>and</strong><br />
its relation to subsequent seismicity in the region:<br />
Tectonophysics, v. 367, no. 3–4, p. 219–233.<br />
Satake, Kenji, Shimazaki, Kunihiko, Tsuji, Yoshinobu,<br />
<strong>and</strong> Ueda, Kazue, 1996, Time <strong>and</strong> size <strong>of</strong> a giant<br />
earthquake in Cascadia inferred from Japanese <strong>tsunami</strong><br />
records <strong>of</strong> January 1700: Nature, v. 379, no.<br />
6562, p. 246–249.<br />
Satake, Kenji, Wang, Kelin, <strong>and</strong> Atwater, B.F., 2003,<br />
Fault slip <strong>and</strong> seismic moment <strong>of</strong> the 1700 Cascadia<br />
earthquake inferred from Japanese <strong>tsunami</strong> descriptions:<br />
Journal <strong>of</strong> Geophysical Research, v. 108, no.<br />
B11, p. 2,535-2,551, doi:10.1029/2003JB002521.<br />
Savoie, M.A., Savoie, J.M., Trefry, J.H., Semmler, C.M.,<br />
Woodall, D.W., Trocine, R.P., Brooks, J.M., <strong>and</strong><br />
McDonald, Tom, 2006, Port Valdez sediment coring<br />
program—Final 2004 monitoring report: Kinnetic<br />
Laboratories, Inc. in association with Florida Institute<br />
<strong>of</strong> Technology & TDI Brooks International, Inc.,<br />
Contract No. 961.04.1 for Prince William Sound Regional<br />
Citizens’ Advisory Council, Valdez, Alaska,<br />
76 p., http://www.pwsrcac.org/docs/d0024500.pdf.<br />
Shannon, W., <strong>and</strong> Hilts, D., 1973, Submarine l<strong>and</strong>slide<br />
at Seward, in The Great Alaska Earthquake <strong>of</strong> 1964:<br />
Washington, DC, Engineering( National Academy <strong>of</strong><br />
Sciences), p. 144–156.<br />
Shennan, Ian, Barlow, Natasha, <strong>and</strong> Combellick, R.A.,<br />
2008, Paleoseismological records <strong>of</strong> multiple great<br />
earthquakes in south-central Alaska: A 4000-year<br />
record at Girdwood, in, Freymueller, J.T., Haeussler,<br />
P.J., Wesson, R.L, <strong>and</strong> Ekström, G., eds., Active<br />
Tectonics <strong>and</strong> Seismic Potential <strong>of</strong> Alaska: American<br />
Geophysical Union Geophysical Monograph 179,<br />
p. 185–199.<br />
Shennan, Ian, Bruhn, Ronald, <strong>and</strong> Plafker, George, 2009,<br />
Multi-segment earthquakes <strong>and</strong> <strong>tsunami</strong> potential<br />
<strong>of</strong> the Aleutian megathrust: Quaternary Science<br />
Reviews, v. 28, no. 1–2, p. 7–13.<br />
Suito, Hisashi, <strong>and</strong> Freymueller, J.T., 2009, A viscoelastic<br />
<strong>and</strong> afterslip postseismic deformation<br />
model for the 1964 Alaska earthquake: Journal <strong>of</strong><br />
Geophysical Research, v. 114, no. B11, p. 404–426,<br />
doi:10.1029/2008JB005954.<br />
Suleimani, E.N., Combellick, R.A., Marriott, Duncan,<br />
Hansen, R.A., Venturato, A.J., <strong>and</strong> Newman, J.C.,<br />
2005, Tsunami hazard <strong>maps</strong> <strong>of</strong> the Homer <strong>and</strong> Seldovia<br />
areas, Alaska: Alaska Division <strong>of</strong> Geological<br />
& Geophysical Surveys Report <strong>of</strong> Investigations<br />
2005-2, 28 p., 2 sheets, scale 1:12,500.<br />
Suleimani, E.N., Hansen, R.A., Combellick, R.A.,<br />
Carver, G.A., Kamphaus, R.A., Newman, J.C., <strong>and</strong><br />
Venturato, A.J, 2002, Tsunami hazard <strong>maps</strong> <strong>of</strong> the<br />
Kodiak area, Alaska: Alaska Division <strong>of</strong> Geological<br />
& Geophysical Surveys Report <strong>of</strong> Investigations<br />
2002-1, 16 p., 4 sheets, scale 1:12,500.<br />
Synolakis, C.E., <strong>and</strong> Bernard, E.N., 2006, Tsunami<br />
science before <strong>and</strong> beyond Boxing Day 2004, in
Thompson, J.M.T., Heppert, H.E., <strong>and</strong> Sparks,<br />
R.S.J., eds., Extreme natural hazards: Philosophical<br />
Transactions <strong>of</strong> the Royal Society, Mathematical,<br />
Physical, <strong>and</strong> Engineering Sciences, v. 364, no. 1845,<br />
p. 2,231–2,265.<br />
Synolakis, C.E., Bernard, E.N., Titov, V.V., Kânoğlu, U.,<br />
<strong>and</strong> González, F.I., 2007, St<strong>and</strong>ards, criteria, <strong>and</strong> procedures<br />
for NOAA evaluation <strong>of</strong> <strong>tsunami</strong> numerical<br />
models: Seattle, Washington, NOAA/Pacifi c Marine<br />
Environmental Laboratory, Technical Memor<strong>and</strong>um<br />
OAR PMEL-135, 55 p.<br />
Thomson, R.E., Rabinovich, A.B., Kulikov, E.A., Fine,<br />
I.V., <strong>and</strong> Bornhold, B.D., 2001, On numerical simulation<br />
<strong>of</strong> the l<strong>and</strong>slide-generated <strong>tsunami</strong> <strong>of</strong> November<br />
3, 1994 in Skagway Harbor, Alaska, in Hebenstreit,<br />
G.T., ed., Tsunami research at the end <strong>of</strong> a critical<br />
decade: Kluwer, p. 243–282.<br />
Titov, V.V., <strong>and</strong> Synolakis, C.E., 1995, Evolution <strong>and</strong><br />
runup <strong>of</strong> breaking <strong>and</strong> nonbreaking waves using<br />
VTSC-2: Journal <strong>of</strong> Waterway, Port, Coastal <strong>and</strong><br />
Ocean Engineering, v. 121, no. 6, p. 308–316.<br />
———1997, Extreme <strong>inundation</strong> fl ows during the Hokkaido–Nansei–Oki<br />
Tsunami. Geophysical Research<br />
Letters, v. 24, no. 11, p, 1,315–1,318.<br />
Tsunami <strong>inundation</strong> <strong>maps</strong> <strong>of</strong> Whittier <strong>and</strong> <strong>western</strong> Passage Canal, Alaska 39<br />
Tudor, W.J., 1964, Tsunami damage at Kodiak, Alaska,<br />
<strong>and</strong> Crescent City, California, from Alaskan Earthquake<br />
<strong>of</strong> 27 March 1964: Port Hueneme, California,<br />
U.S. Navy Civil Engineering Lab, Technical Note<br />
N-622, 124 p.<br />
Wang, Kelin, Wells, R.E., Mazzotti, Stephane, Hyndman,<br />
R.D., <strong>and</strong> Sagiya, Takeshi, 2003, A revised<br />
dislocation model <strong>of</strong> interseismic deformation <strong>of</strong><br />
the Cascadia subduction zone: Journal <strong>of</strong> Geophysical<br />
Research, v. 108, no. B1, p. 2026–2038,<br />
doi:10.1029/2001JB001227, http://www.agu.org/<br />
pubs/crossref/2003/2001JB001227.shtml.<br />
Wilson, B.W., <strong>and</strong> Tørum, Alf, 1968, The <strong>tsunami</strong> <strong>of</strong> the<br />
Alaskan Earthquake, 1964—Engineering evaluation:<br />
Fort Belvoir, Virginia, U.S. Army Corps <strong>of</strong> Engineers<br />
Coastal Engineering Research Center, Technical<br />
Memor<strong>and</strong>um No. 25, 410 p.<br />
———1972, Effects <strong>of</strong> the <strong>tsunami</strong>s—An engineering<br />
study, in The Great Alaska Earthquake <strong>of</strong> 1964:<br />
Washington, D.C., National Academy <strong>of</strong> Sciences—<br />
Engineering, p. 361–526.
INTENTIONALLY LEFT BLANK
A<br />
60 ° 49′<br />
60 ° 48′<br />
60 ° 47′<br />
B<br />
60° 47′ 30′′<br />
60° 47′ 00′′<br />
60° 46′ 30′′<br />
21<br />
22<br />
23<br />
14<br />
13<br />
12<br />
11<br />
Tsunami <strong>inundation</strong> <strong>maps</strong> <strong>of</strong> Whittier <strong>and</strong> <strong>western</strong> Passage Canal, Alaska 41<br />
17<br />
9<br />
10<br />
APPENDIX A<br />
17<br />
8<br />
Passage Canal<br />
−148 ° 44′ −148 ° 41′ −148 ° 38′ −148 ° 35′ −148 ° 32′<br />
6 20 7<br />
Figure A-1. (A) Locations <strong>of</strong> time series points in Passage Canal. (B) Closer view <strong>of</strong> the area marked by a dashed<br />
rectangle in fi gure A, identifying locations <strong>of</strong> time series points in Passage Canal.<br />
15<br />
16<br />
3 1<br />
2<br />
4 5<br />
−148°43′ −148°42′ −148°41′ −148°40′<br />
24<br />
19<br />
18<br />
25
42 Report <strong>of</strong> Investigations 2011-7 — Appendix A<br />
Water level above ground (meters).<br />
Water level above ground (meters).<br />
Water level above ground (meters).<br />
Water level above ground (meters).<br />
3.5<br />
3<br />
2.5<br />
2<br />
1.5<br />
1<br />
0.5<br />
Point 1<br />
Depot Rd.<br />
Scenario 10, elevation 2.7m (8.9ft)<br />
Scenario 11, elevation 2.7m (8.9ft)<br />
Scenario 12, elevation 2.7m (8.9ft)<br />
Scenario 13, elevation 2.7m (8.9ft)<br />
0<br />
0 1 2 3 4 5 6 7 8 9 10<br />
Time after earthquake (minutes).<br />
9<br />
8<br />
7<br />
6<br />
5<br />
4<br />
3<br />
2<br />
1<br />
0<br />
0 1 2 3 4 5 6 7 8 9 10<br />
Time after earthquake (minutes).<br />
2.5<br />
2<br />
1.5<br />
1<br />
0.5<br />
Point 2<br />
Depot Rd., Whittier Manor<br />
Scenario 10, elevation 3.2m (10.5ft)<br />
Scenario 11, elevation 3.2m (10.5ft)<br />
Scenario 12, elevation 3.2m (10.5ft)<br />
Scenario 13, elevation 3.2m (10.5ft)<br />
0<br />
0 1 2 3 4 5 6 7 8 9 10<br />
Time after earthquake (minutes).<br />
10<br />
8<br />
6<br />
4<br />
2<br />
Point 3<br />
Depot Rd., west<br />
Scenario 10, elevation 2.7m (8.9ft)<br />
Scenario 11, elevation 2.7m (8.9ft)<br />
Scenario 12, elevation 2.7m (8.9ft)<br />
Scenario 13, elevation 2.7m (8.9ft)<br />
Point 4<br />
Depot Rd., east<br />
Scenario 10, elevation 2.5m (8.2ft)<br />
Scenario 11, elevation 2.5m (8.2ft)<br />
Scenario 12, elevation 2.5m (8.2ft)<br />
Scenario 13, elevation 2.5m (8.2ft)<br />
0<br />
0 1 2 3 4 5 6 7 8 9 10<br />
Time after earthquake (minutes).<br />
0<br />
0 1 2 3 4 5 6 7 8 9 10<br />
Time after earthquake (minutes).<br />
Figure A-2. Time series <strong>of</strong> the water level <strong>and</strong> velocity at the selected locations for scenarios 10–13.<br />
Water velocity above ground (meters/second).<br />
Water velocity above ground (meters/second).<br />
Water velocity above ground (meters/second).<br />
Water velocity above ground (meters/second).<br />
3<br />
2.5<br />
2<br />
1.5<br />
1<br />
0.5<br />
9<br />
8<br />
7<br />
6<br />
5<br />
4<br />
3<br />
2<br />
1<br />
Point 1<br />
Depot Rd.<br />
Scenario 10, elevation 2.7m (8.9ft)<br />
Scenario 11, elevation 2.7m (8.9ft)<br />
Scenario 12, elevation 2.7m (8.9ft)<br />
Scenario 13, elevation 2.7m (8.9ft)<br />
Point 2<br />
Depot Rd., Whittier Manor<br />
Scenario 10, elevation 3.2m (10.5ft)<br />
Scenario 11, elevation 3.2m (10.5ft)<br />
Scenario 12, elevation 3.2m (10.5ft)<br />
Scenario 13, elevation 3.2m (10.5ft)<br />
0<br />
0 1 2 3 4 5 6 7 8 9 10<br />
Time after earthquake (minutes).<br />
2<br />
1.5<br />
1<br />
0.5<br />
Point 3<br />
Depot Rd., west<br />
Scenario 10, elevation 2.7m (8.9ft)<br />
Scenario 11, elevation 2.7m (8.9ft)<br />
Scenario 12, elevation 2.7m (8.9ft)<br />
Scenario 13, elevation 2.7m (8.9ft)<br />
0<br />
0 1 2 3 4 5 6 7 8 9 10<br />
Time after earthquake (minutes).<br />
12<br />
10<br />
8<br />
6<br />
4<br />
2<br />
Point 4<br />
Depot Rd., east<br />
Scenario 10, elevation 2.5m (8.2ft)<br />
Scenario 11, elevation 2.5m (8.2ft)<br />
Scenario 12, elevation 2.5m (8.2ft)<br />
Scenario 13, elevation 2.5m (8.2ft)<br />
0<br />
0 1 2 3 4 5 6 7 8 9 10<br />
Time after earthquake (minutes).
Water level above ground (meters).<br />
Water level above ground (meters).<br />
Water level above ground (meters).<br />
Water level above ground (meters).<br />
12<br />
10<br />
8<br />
6<br />
4<br />
2<br />
Point 5<br />
Small harbor<br />
0<br />
0 1 2 3 4 5 6 7 8 9 10<br />
Time after earthquake (minutes).<br />
12<br />
10<br />
8<br />
6<br />
4<br />
2<br />
Tsunami <strong>inundation</strong> <strong>maps</strong> <strong>of</strong> Whittier <strong>and</strong> <strong>western</strong> Passage Canal, Alaska 43<br />
Scenario 10, elevation 1.5m (4.9ft)<br />
Scenario 11, elevation 1.5m (4.9ft)<br />
Scenario 12, elevation 1.5m (4.9ft)<br />
Scenario 13, elevation 1.5m (4.9ft)<br />
Point 6<br />
Whittier Creek, right bank<br />
Scenario 10, elevation 2.5m (8.2ft)<br />
Scenario 11, elevation 2.5m (8.2ft)<br />
Scenario 12, elevation 2.5m (8.2ft)<br />
Scenario 13, elevation 2.5m (8.2ft)<br />
0<br />
0 1 2 3 4 5 6 7 8 9 10<br />
Time after earthquake (minutes).<br />
6<br />
5<br />
4<br />
3<br />
2<br />
1<br />
0<br />
0 1 2 3 4 5 6 7 8 9 10<br />
Time after earthquake (minutes).<br />
7<br />
6<br />
5<br />
4<br />
3<br />
2<br />
1<br />
Point 7<br />
Water breaker<br />
Scenario 10, elevation 2.5m (8.2ft)<br />
Scenario 11, elevation 2.5m (8.2ft)<br />
Scenario 12, elevation 2.5m (8.2ft)<br />
Scenario 13, elevation 2.5m (8.2ft)<br />
Point 8<br />
Whittier Creek, left bank<br />
Scenario 10, elevation 2.5m (8.2ft)<br />
Scenario 11, elevation 2.5m (8.2ft)<br />
Scenario 12, elevation 2.5m (8.2ft)<br />
Scenario 13, elevation 2.5m (8.2ft)<br />
0<br />
0 1 2 3 4 5 6 7 8 9 10<br />
Time after earthquake (minutes).<br />
Water velocity above ground (meters/second).<br />
Water velocity above ground (meters/second).<br />
Water velocity above ground (meters/second).<br />
Water velocity above ground (meters/second).<br />
10<br />
8<br />
6<br />
4<br />
2<br />
Point 5<br />
Small harbor<br />
Scenario 10, elevation 1.5m (4.9ft)<br />
Scenario 11, elevation 1.5m (4.9ft)<br />
Scenario 12, elevation 1.5m (4.9ft)<br />
Scenario 13, elevation 1.5m (4.9ft)<br />
0<br />
0 1 2 3 4 5 6 7 8 9 10<br />
Time after earthquake (minutes).<br />
10<br />
8<br />
6<br />
4<br />
2<br />
Point 6<br />
Whittier Creek, right bank<br />
Scenario 10, elevation 2.5m (8.2ft)<br />
Scenario 11, elevation 2.5m (8.2ft)<br />
Scenario 12, elevation 2.5m (8.2ft)<br />
Scenario 13, elevation 2.5m (8.2ft)<br />
0<br />
0 1 2 3 4 5 6 7 8 9 10<br />
Time after earthquake (minutes).<br />
7<br />
6<br />
5<br />
4<br />
3<br />
2<br />
1<br />
Point 7<br />
Water breaker<br />
Scenario 10, elevation 2.5m (8.2ft)<br />
Scenario 11, elevation 2.5m (8.2ft)<br />
Scenario 12, elevation 2.5m (8.2ft)<br />
Scenario 13, elevation 2.5m (8.2ft)<br />
0<br />
0 1 2 3 4 5 6 7 8 9 10<br />
Time after earthquake (minutes).<br />
6<br />
5<br />
4<br />
3<br />
2<br />
1<br />
Point 8<br />
Whittier Creek, left bank<br />
Scenario 10, elevation 2.5m (8.2ft)<br />
Scenario 11, elevation 2.5m (8.2ft)<br />
Scenario 12, elevation 2.5m (8.2ft)<br />
Scenario 13, elevation 2.5m (8.2ft)<br />
0<br />
0 1 2 3 4 5 6 7 8 9 10<br />
Time after earthquake (minutes).<br />
Figure A-2 (continued). Time series <strong>of</strong> the water level <strong>and</strong> velocity at the selected locations for scenarios 10–13.
44 Report <strong>of</strong> Investigations 2011-7 — Appendix A<br />
Water level above ground (meters).<br />
Water level above ground (meters).<br />
Water level above ground (meters).<br />
Water level above ground (meters).<br />
1<br />
0.5<br />
0<br />
−0.5<br />
Point 9<br />
West Camp Rd.<br />
Scenario 10, elevation 9.0m (29.5ft)<br />
Scenario 11, elevation 9.0m (29.5ft)<br />
Scenario 12, elevation 9.0m (29.5ft)<br />
Scenario 13, elevation 9.0m (29.5ft)<br />
−1<br />
0 1 2 3 4 5 6 7 8 9 10<br />
Time after earthquake (minutes).<br />
0.7<br />
0.6<br />
0.5<br />
0.4<br />
0.3<br />
0.2<br />
0.1<br />
Point 10<br />
West Camp Rd., east<br />
0<br />
0 1 2 3 4 5 6 7 8 9 10<br />
Time after earthquake (minutes).<br />
1<br />
0.5<br />
0<br />
−0.5<br />
Scenario 10, elevation 6.5m (21.3ft)<br />
Scenario 11, elevation 6.5m (21.3ft)<br />
Scenario 12, elevation 6.5m (21.3ft)<br />
Scenario 13, elevation 6.5m (21.3ft)<br />
−1<br />
0 1 2 3 4 5 6 7 8 9 10<br />
Time after earthquake (minutes).<br />
1<br />
0.5<br />
0<br />
−0.5<br />
Point 11<br />
West Camp Rd., west<br />
Scenario 10, elevation 10.0m (32.8ft)<br />
Scenario 11, elevation 10.0m (32.8ft)<br />
Scenario 12, elevation 10.0m (32.8ft)<br />
Scenario 13, elevation 10.0m (32.8ft)<br />
Point 12<br />
Airport runway, west<br />
Scenario 10, elevation 6.0m (19.7ft)<br />
Scenario 11, elevation 6.0m (19.7ft)<br />
Scenario 12, elevation 6.0m (19.7ft)<br />
Scenario 13, elevation 6.0m (19.7ft)<br />
−1<br />
0 1 2 3 4 5 6 7 8 9 10<br />
Time after earthquake (minutes).<br />
Water velocity above ground (meters/second).<br />
Water velocity above ground (meters/second).<br />
Water velocity above ground (meters/second).<br />
Water velocity above ground (meters/second).<br />
1<br />
0.5<br />
0<br />
−0.5<br />
Point 9<br />
West Camp Rd.<br />
Scenario 10, elevation 9.0m (29.5ft)<br />
Scenario 11, elevation 9.0m (29.5ft)<br />
Scenario 12, elevation 9.0m (29.5ft)<br />
Scenario 13, elevation 9.0m (29.5ft)<br />
−1<br />
0 1 2 3 4 5 6 7 8 9 10<br />
Time after earthquake (minutes).<br />
1.5<br />
1<br />
0.5<br />
Point 10<br />
West Camp Rd., east<br />
Scenario 10, elevation 6.5m (21.3ft)<br />
Scenario 11, elevation 6.5m (21.3ft)<br />
Scenario 12, elevation 6.5m (21.3ft)<br />
Scenario 13, elevation 6.5m (21.3ft)<br />
0<br />
0 1 2 3 4 5 6 7 8 9 10<br />
Time after earthquake (minutes).<br />
1<br />
0.5<br />
0<br />
−0.5<br />
Point 11<br />
West Camp Rd., west<br />
Scenario 10, elevation 10.0m (32.8ft)<br />
Scenario 11, elevation 10.0m (32.8ft)<br />
Scenario 12, elevation 10.0m (32.8ft)<br />
Scenario 13, elevation 10.0m (32.8ft)<br />
−1<br />
0 1 2 3 4 5 6 7 8 9 10<br />
Time after earthquake (minutes).<br />
1<br />
0.5<br />
0<br />
−0.5<br />
Point 12<br />
Airport runway, west<br />
Scenario 10, elevation 6.0m (19.7ft)<br />
Scenario 11, elevation 6.0m (19.7ft)<br />
Scenario 12, elevation 6.0m (19.7ft)<br />
Scenario 13, elevation 6.0m (19.7ft)<br />
−1<br />
0 1 2 3 4 5 6 7 8 9 10<br />
Time after earthquake (minutes).<br />
Figure A-2 (continued). Time series <strong>of</strong> the water level <strong>and</strong> velocity at the selected locations for scenarios 10–13.
Water level above ground (meters).<br />
Water level above ground (meters).<br />
Water level above ground (meters).<br />
Water level above ground (meters).<br />
1<br />
0.5<br />
0<br />
−0.5<br />
Point 13<br />
Airport runway<br />
−1<br />
0 1 2 3 4 5 6 7 8 9 10<br />
Time after earthquake (minutes).<br />
3.5<br />
3<br />
2.5<br />
2<br />
1.5<br />
1<br />
0.5<br />
Tsunami <strong>inundation</strong> <strong>maps</strong> <strong>of</strong> Whittier <strong>and</strong> <strong>western</strong> Passage Canal, Alaska 45<br />
Scenario 10, elevation 3.0m (9.8ft)<br />
Scenario 11, elevation 3.0m (9.8ft)<br />
Scenario 12, elevation 3.0m (9.8ft)<br />
Scenario 13, elevation 3.0m (9.8ft)<br />
Point 14<br />
Airport runway, east<br />
Scenario 10, elevation 2.0m (6.6ft)<br />
Scenario 11, elevation 2.0m (6.6ft)<br />
Scenario 12, elevation 2.0m (6.6ft)<br />
Scenario 13, elevation 2.0m (6.6ft)<br />
0<br />
0 1 2 3 4 5 6 7 8 9 10<br />
Time after earthquake (minutes).<br />
3.5<br />
3<br />
2.5<br />
2<br />
1.5<br />
1<br />
0.5<br />
0<br />
0 1 2 3 4 5 6 7 8 9 10<br />
Time after earthquake (minutes).<br />
3.5<br />
3<br />
2.5<br />
2<br />
1.5<br />
1<br />
0.5<br />
Point 15<br />
Harbor parking<br />
Scenario 10, elevation 3.0m (9.8ft)<br />
Scenario 11, elevation 3.0m (9.8ft)<br />
Scenario 12, elevation 3.0m (9.8ft)<br />
Scenario 13, elevation 3.0m (9.8ft)<br />
Point 16<br />
Railroad tracks<br />
Scenario 10, elevation 2.5m (8.2ft)<br />
Scenario 11, elevation 2.5m (8.2ft)<br />
Scenario 12, elevation 2.5m (8.2ft)<br />
Scenario 13, elevation 2.5m (8.2ft)<br />
0<br />
0 1 2 3 4 5 6 7 8 9 10<br />
Time after earthquake (minutes).<br />
Water velocity above ground (meters/second).<br />
Water velocity above ground (meters/second).<br />
Water velocity above ground (meters/second).<br />
1<br />
0.5<br />
0<br />
−0.5<br />
Point 13<br />
Airport runway<br />
Scenario 10, elevation 3.0m (9.8ft)<br />
Scenario 11, elevation 3.0m (9.8ft)<br />
Scenario 12, elevation 3.0m (9.8ft)<br />
Scenario 13, elevation 3.0m (9.8ft)<br />
−1<br />
0 1 2 3 4 5 6 7 8 9 10<br />
Time after earthquake (minutes).<br />
Water velocity above ground (meters/second).<br />
5<br />
4<br />
3<br />
2<br />
1<br />
Point 14<br />
Airport runway, east<br />
Scenario 10, elevation 2.0m (6.6ft)<br />
Scenario 11, elevation 2.0m (6.6ft)<br />
Scenario 12, elevation 2.0m (6.6ft)<br />
Scenario 13, elevation 2.0m (6.6ft)<br />
0<br />
0 1 2 3 4 5 6 7 8 9 10<br />
Time after earthquake (minutes).<br />
4<br />
3.5<br />
3<br />
2.5<br />
2<br />
1.5<br />
1<br />
0.5<br />
Point 15<br />
Harbor parking<br />
Scenario 10, elevation 3.0m (9.8ft)<br />
Scenario 11, elevation 3.0m (9.8ft)<br />
Scenario 12, elevation 3.0m (9.8ft)<br />
Scenario 13, elevation 3.0m (9.8ft)<br />
0<br />
0 1 2 3 4 5 6 7 8 9 10<br />
Time after earthquake (minutes).<br />
4<br />
3.5<br />
3<br />
2.5<br />
2<br />
1.5<br />
1<br />
0.5<br />
Point 16<br />
Railroad tracks<br />
Scenario 10, elevation 2.5m (8.2ft)<br />
Scenario 11, elevation 2.5m (8.2ft)<br />
Scenario 12, elevation 2.5m (8.2ft)<br />
Scenario 13, elevation 2.5m (8.2ft)<br />
0<br />
0 1 2 3 4 5 6 7 8 9 10<br />
Time after earthquake (minutes).<br />
Figure A-2 (continued). Time series <strong>of</strong> the water level <strong>and</strong> velocity at the selected locations for scenarios 10–13.
46 Report <strong>of</strong> Investigations 2011-7 — Appendix A<br />
Sea level (meters).<br />
Sea level (meters).<br />
Sea level (meters).<br />
15<br />
10<br />
5<br />
0<br />
−5<br />
−10<br />
Point 17<br />
Passage Canal<br />
−15<br />
Scenario 10<br />
Scenario 11<br />
−20<br />
Scenario 12<br />
Scenario 13<br />
−25<br />
0 1 2 3 4 5 6 7 8 9 10<br />
Time after earthquake (minutes).<br />
−1.5<br />
0 1 2 3 4 5 6 7 8 9 10<br />
Time after earthquake (minutes).<br />
Sea level (meters).<br />
2<br />
1.5<br />
1<br />
0.5<br />
0<br />
−0.5<br />
−1<br />
1<br />
0.5<br />
0<br />
−0.5<br />
Point 18<br />
Passage Canal, entrance<br />
Scenario 10<br />
Scenario 11<br />
Scenario 12<br />
Scenario 13<br />
−1<br />
0 1 2 3 4 5 6 7 8 9 10<br />
Time after earthquake (minutes).<br />
12<br />
10<br />
8<br />
6<br />
4<br />
2<br />
0<br />
Scenario 10<br />
Scenario 11<br />
Scenario 12<br />
Scenario 13<br />
Point 19<br />
Shotgun Cove, west<br />
Point 20<br />
Whittier harbor<br />
Scenario 10<br />
Scenario 11<br />
Scenario 12<br />
Scenario 13<br />
−2<br />
0 1 2 3 4 5 6 7 8 9 10<br />
Time after earthquake (minutes).<br />
Water current (meters/second).<br />
Water current (meters/second).<br />
Water current (meters/second).<br />
7<br />
6<br />
5<br />
4<br />
3<br />
2<br />
1<br />
Point 17<br />
Passage Canal<br />
Scenario 10<br />
Scenario 11<br />
Scenario 12<br />
Scenario 13<br />
0<br />
0 1 2 3 4 5 6 7 8 9 10<br />
Time after earthquake (minutes).<br />
0.4<br />
0.35<br />
0.3<br />
0.25<br />
0.2<br />
0.15<br />
0.1<br />
0.05<br />
Water current (meters/second).<br />
Point 18<br />
Passage Canal, entrance<br />
Scenario 10<br />
Scenario 11<br />
Scenario 12<br />
Scenario 13<br />
0<br />
0 1 2 3 4 5 6 7 8 9 10<br />
Time after earthquake (minutes).<br />
0.7<br />
0.6<br />
0.5<br />
0.4<br />
0.3<br />
0.2<br />
0.1<br />
Scenario 10<br />
Scenario 11<br />
Scenario 12<br />
Scenario 13<br />
Point 19<br />
Shotgun Cove, west<br />
0<br />
0 1 2 3 4 5 6 7 8 9 10<br />
Time after earthquake (minutes).<br />
8<br />
7<br />
6<br />
5<br />
4<br />
3<br />
2<br />
1<br />
Point 20<br />
Whittier harbor<br />
Scenario 10<br />
Scenario 11<br />
Scenario 12<br />
Scenario 13<br />
0<br />
0 1 2 3 4 5 6 7 8 9 10<br />
Time after earthquake (minutes).<br />
Figure A-2 (continued). Time series <strong>of</strong> the water level <strong>and</strong> velocity at the selected locations for scenarios 10–13.
Water level above ground (meters).<br />
Water level above ground (meters).<br />
Water level above ground (meters).<br />
Sea level (meters).<br />
1<br />
0.5<br />
0<br />
−0.5<br />
Point 21<br />
Learnard glacial moraine<br />
−1<br />
0 1 2 3 4 5 6 7 8 9 10<br />
Time after earthquake (minutes).<br />
1<br />
0.5<br />
0<br />
−0.5<br />
Tsunami <strong>inundation</strong> <strong>maps</strong> <strong>of</strong> Whittier <strong>and</strong> <strong>western</strong> Passage Canal, Alaska 47<br />
Scenario 10, elevation 4.3m (14.1ft)<br />
Scenario 11, elevation 4.3m (14.1ft)<br />
Scenario 12, elevation 4.3m (14.1ft)<br />
Scenario 13, elevation 4.3m (14.1ft)<br />
Point 22<br />
Learnard glacial moraine<br />
−1<br />
0 1 2 3 4 5 6 7 8 9 10<br />
Time after earthquake (minutes).<br />
1<br />
0.5<br />
0<br />
−0.5<br />
Scenario 10, elevation 19.3m (63.2ft)<br />
Scenario 11, elevation 19.3m (63.2ft)<br />
Scenario 12, elevation 19.3m (63.2ft)<br />
Scenario 13, elevation 19.3m (63.2ft)<br />
−1<br />
0 1 2 3 4 5 6 7 8 9 10<br />
Time after earthquake (minutes).<br />
1<br />
0.5<br />
0<br />
−0.5<br />
−1<br />
Scenario 10<br />
Scenario 11<br />
Scenario 12<br />
Scenario 13<br />
Point 23<br />
Passage Canal, coast<br />
Scenario 10, elevation 4.3m (14.0ft)<br />
Scenario 11, elevation 4.3m (14.0ft)<br />
Scenario 12, elevation 4.3m (14.0ft)<br />
Scenario 13, elevation 4.3m (14.0ft)<br />
Point 24<br />
Shotgun Cove, south<br />
−1.5<br />
0 1 2 3 4 5 6 7 8 9 10<br />
Time after earthquake (minutes).<br />
Water velocity above ground (meters/second).<br />
Water velocity above ground (meters/second).<br />
Water velocity above ground (meters/second).<br />
Water current (meters/second).<br />
1<br />
0.5<br />
0<br />
−0.5<br />
Point 21<br />
Learnard glacial moraine<br />
Scenario 10, elevation 4.3m (14.1ft)<br />
Scenario 11, elevation 4.3m (14.1ft)<br />
Scenario 12, elevation 4.3m (14.1ft)<br />
Scenario 13, elevation 4.3m (14.1ft)<br />
−1<br />
0 1 2 3 4 5 6 7 8 9 10<br />
Time after earthquake (minutes).<br />
1<br />
0.5<br />
0<br />
−0.5<br />
Point 22<br />
Learnard glacial moraine<br />
Scenario 10, elevation 19.3m (63.2ft)<br />
Scenario 11, elevation 19.3m (63.2ft)<br />
Scenario 12, elevation 19.3m (63.2ft)<br />
Scenario 13, elevation 19.3m (63.2ft)<br />
−1<br />
0 1 2 3 4 5 6 7 8 9 10<br />
Time after earthquake (minutes).<br />
1<br />
0.5<br />
0<br />
−0.5<br />
Point 23<br />
Passage Canal, coast<br />
Scenario 10, elevation 4.3m (14.0ft)<br />
Scenario 11, elevation 4.3m (14.0ft)<br />
Scenario 12, elevation 4.3m (14.0ft)<br />
Scenario 13, elevation 4.3m (14.0ft)<br />
−1<br />
0 1 2 3 4 5 6 7 8 9 10<br />
Time after earthquake (minutes).<br />
1.8<br />
1.6<br />
1.4<br />
1.2<br />
1<br />
0.8<br />
0.6<br />
0.4<br />
0.2<br />
Scenario 10<br />
Scenario 11<br />
Scenario 12<br />
Scenario 13<br />
Point 24<br />
Shotgun Cove, south<br />
0<br />
0 1 2 3 4 5 6 7 8 9 10<br />
Time after earthquake (minutes).<br />
Figure A-2 (continued). Time series <strong>of</strong> the water level <strong>and</strong> velocity at the selected locations for scenarios 10–13.
48 Report <strong>of</strong> Investigations 2011-7 — Appendix A<br />
Sea level (meters).<br />
2<br />
1.5<br />
1<br />
0.5<br />
0<br />
−0.5<br />
Point 25<br />
Shotgun Cove, east<br />
−1 Scenario 10<br />
Scenario 11<br />
−1.5 Scenario 12<br />
Scenario 13<br />
−2<br />
0 1 2 3 4 5 6 7 8 9 10<br />
Time after earthquake (minutes).<br />
Water current (meters/second).<br />
1.8<br />
1.6<br />
1.4<br />
1.2<br />
1<br />
0.8<br />
0.6<br />
0.4<br />
0.2<br />
Scenario 10<br />
Scenario 11<br />
Scenario 12<br />
Scenario 13<br />
Point 25<br />
Shotgun Cove, east<br />
0<br />
0 1 2 3 4 5 6 7 8 9 10<br />
Time after earthquake (minutes).<br />
Figure A-2 (continued). Time series <strong>of</strong> the water level <strong>and</strong> velocity at the selected locations for scenarios 10–13.
Water level above ground (meters).<br />
Water level above ground (meters).<br />
Water level above ground (meters).<br />
Water level above ground (meters).<br />
1.4<br />
1.2<br />
1<br />
0.8<br />
0.6<br />
0.4<br />
0.2<br />
Point 1<br />
Depot Rd.<br />
0<br />
0 2 4 6 8 10 12<br />
Time after earthquake (hours).<br />
1<br />
0.8<br />
0.6<br />
0.4<br />
0.2<br />
Tsunami <strong>inundation</strong> <strong>maps</strong> <strong>of</strong> Whittier <strong>and</strong> <strong>western</strong> Passage Canal, Alaska 49<br />
Scenario 1, elevation 1.5m (5.0ft)<br />
Scenario 2, elevation 1.6m (5.3ft)<br />
Scenario 3, elevation 1.5m (4.9ft)<br />
Scenario 5, elevation 2.7m (8.9ft)<br />
0<br />
0 2 4 6 8 10 12<br />
Time after earthquake (hours).<br />
1.4<br />
1.2<br />
1<br />
0.8<br />
0.6<br />
0.4<br />
0.2<br />
Point 2<br />
Depot Rd., Whittier Manor<br />
Scenario 1, elevation 1.8m (6.0ft)<br />
Scenario 2, elevation 1.9m (6.3ft)<br />
Scenario 3, elevation 1.8m (5.9ft)<br />
Scenario 5, elevation 3.0m (9.8ft)<br />
0<br />
0 2 4 6 8 10 12<br />
Time after earthquake (hours).<br />
1.4<br />
1.2<br />
1<br />
0.8<br />
0.6<br />
0.4<br />
0.2<br />
Point 3<br />
Depot Rd., west<br />
Scenario 1, elevation 1.5m (5.0ft)<br />
Scenario 2, elevation 1.6m (5.3ft)<br />
Scenario 3, elevation 1.5m (4.9ft)<br />
Scenario 5, elevation 2.7m (8.9ft)<br />
Point 4<br />
Depot Rd., east<br />
Scenario 1, elevation 1.6m (5.3ft)<br />
Scenario 2, elevation 1.7m (5.6ft)<br />
Scenario 3, elevation 1.6m (5.2ft)<br />
Scenario 5, elevation 2.8m (9.2ft)<br />
0<br />
0 2 4 6 8 10 12<br />
Time after earthquake (hours).<br />
0<br />
0 2 4 6 8 10 12<br />
Time after earthquake (hours).<br />
Figure A-3. Time series <strong>of</strong> water level <strong>and</strong> velocity at selected locations for scenarios 1, 2, 3, <strong>and</strong> 5.<br />
Water velocity above ground (meters/second).<br />
Water velocity above ground (meters/second).<br />
Water velocity above ground (meters/second).<br />
Water velocity above ground (meters/second).<br />
1.8<br />
1.6<br />
1.4<br />
1.2<br />
1<br />
0.8<br />
0.6<br />
0.4<br />
0.2<br />
1.4<br />
1.2<br />
1<br />
0.8<br />
0.6<br />
0.4<br />
0.2<br />
Point 1<br />
Depot Rd.<br />
Scenario 1, elevation 1.5m (5.0ft)<br />
Scenario 2, elevation 1.6m (5.3ft)<br />
Scenario 3, elevation 1.5m (4.9ft)<br />
Scenario 5, elevation 2.7m (8.9ft)<br />
Point 2<br />
Depot Rd., Whittier Manor<br />
Scenario 1, elevation 1.8m (6.0ft)<br />
Scenario 2, elevation 1.9m (6.3ft)<br />
Scenario 3, elevation 1.8m (5.9ft)<br />
Scenario 5, elevation 3.0m (9.8ft)<br />
0<br />
0 2 4 6 8 10 12<br />
Time after earthquake (hours).<br />
1.4<br />
1.2<br />
1<br />
0.8<br />
0.6<br />
0.4<br />
0.2<br />
Point 3<br />
Depot Rd., west<br />
Scenario 1, elevation 1.5m (5.0ft)<br />
Scenario 2, elevation 1.6m (5.3ft)<br />
Scenario 3, elevation 1.5m (4.9ft)<br />
Scenario 5, elevation 2.7m (8.9ft)<br />
0<br />
0 2 4 6 8 10 12<br />
Time after earthquake (hours).<br />
1.4<br />
1.2<br />
1<br />
0.8<br />
0.6<br />
0.4<br />
0.2<br />
Point 4<br />
Depot Rd., east<br />
Scenario 1, elevation 1.6m (5.3ft)<br />
Scenario 2, elevation 1.7m (5.6ft)<br />
Scenario 3, elevation 1.6m (5.2ft)<br />
Scenario 5, elevation 2.8m (9.2ft)<br />
0<br />
0 2 4 6 8 10 12<br />
Time after earthquake (hours).
50 Report <strong>of</strong> Investigations 2011-7 — Appendix A<br />
Water level above ground (meters).<br />
Water level above ground (meters).<br />
Water level above ground (meters).<br />
Water level above ground (meters).<br />
1.4<br />
1.2<br />
1<br />
0.8<br />
0.6<br />
0.4<br />
0.2<br />
Point 5<br />
Small harbor<br />
Scenario 1, elevation 1.6m (5.3ft)<br />
Scenario 2, elevation 1.7m (5.6ft)<br />
Scenario 3, elevation 1.6m (5.2ft)<br />
Scenario 5, elevation 2.8m (9.2ft)<br />
0<br />
0 2 4 6 8 10 12<br />
Time after earthquake (hours).<br />
1.5<br />
1<br />
0.5<br />
0<br />
0 2 4 6 8 10 12<br />
Time after earthquake (hours).<br />
1.5<br />
1<br />
0.5<br />
Point 6<br />
Whittier Creek, right bank<br />
Scenario 1, elevation 1.3m (4.2ft)<br />
Scenario 2, elevation 1.4m (4.6ft)<br />
Scenario 3, elevation 1.2m (4.1ft)<br />
Scenario 5, elevation 2.5m (8.2ft)<br />
0<br />
0 2 4 6 8 10 12<br />
Time after earthquake (hours).<br />
1.5<br />
1<br />
0.5<br />
Point 7<br />
Water breaker<br />
Scenario 1, elevation 1.3m (4.2ft)<br />
Scenario 2, elevation 1.4m (4.6ft)<br />
Scenario 3, elevation 1.3m (4.1ft)<br />
Scenario 5, elevation 2.5m (8.2ft)<br />
Point 8<br />
Whittier Creek, left bank<br />
Scenario 1, elevation 1.3m (4.1ft)<br />
Scenario 2, elevation 1.4m (4.6ft)<br />
Scenario 3, elevation 1.2m (4.0ft)<br />
Scenario 5, elevation 2.5m (8.2ft)<br />
0<br />
0 2 4 6 8 10 12<br />
Time after earthquake (hours).<br />
Water velocity above ground (meters/second).<br />
Water velocity above ground (meters/second).<br />
Water velocity above ground (meters/second).<br />
Water velocity above ground (meters/second).<br />
0.9<br />
0.8<br />
0.7<br />
0.6<br />
0.5<br />
0.4<br />
0.3<br />
0.2<br />
0.1<br />
Point 5<br />
Small harbor<br />
Scenario 1, elevation 1.6m (5.3ft)<br />
Scenario 2, elevation 1.7m (5.6ft)<br />
Scenario 3, elevation 1.6m (5.2ft)<br />
Scenario 5, elevation 2.8m (9.2ft)<br />
0<br />
0 2 4 6 8 10 12<br />
Time after earthquake (hours).<br />
1.5<br />
1<br />
0.5<br />
Point 6<br />
Whittier Creek, right bank<br />
Scenario 1, elevation 1.3m (4.2ft)<br />
Scenario 2, elevation 1.4m (4.6ft)<br />
Scenario 3, elevation 1.2m (4.1ft)<br />
Scenario 5, elevation 2.5m (8.2ft)<br />
0<br />
0 2 4 6 8 10 12<br />
Time after earthquake (hours).<br />
0.9<br />
0.8<br />
0.7<br />
0.6<br />
0.5<br />
0.4<br />
0.3<br />
0.2<br />
0.1<br />
Point 7<br />
Water breaker<br />
Scenario 1, elevation 1.3m (4.2ft)<br />
Scenario 2, elevation 1.4m (4.6ft)<br />
Scenario 3, elevation 1.3m (4.1ft)<br />
Scenario 5, elevation 2.5m (8.2ft)<br />
0<br />
0 2 4 6 8 10 12<br />
Time after earthquake (hours).<br />
1.4<br />
1.2<br />
1<br />
0.8<br />
0.6<br />
0.4<br />
0.2<br />
Point 8<br />
Whittier Creek, left bank<br />
Scenario 1, elevation 1.3m (4.1ft)<br />
Scenario 2, elevation 1.4m (4.6ft)<br />
Scenario 3, elevation 1.2m (4.0ft)<br />
Scenario 5, elevation 2.5m (8.2ft)<br />
0<br />
0 2 4 6 8 10 12<br />
Time after earthquake (hours).<br />
Figure A-3 (continued). Time series <strong>of</strong> water level <strong>and</strong> velocity at selected locations for scenarios 1, 2, 3, <strong>and</strong> 5.
Water level above ground (meters).<br />
Water level above ground (meters).<br />
Water level above ground (meters).<br />
Water level above ground (meters).<br />
1<br />
0.5<br />
0<br />
−0.5<br />
Point 9<br />
West Camp Rd.<br />
−1<br />
0 2 4 6 8 10 12<br />
Time after earthquake (hours).<br />
1<br />
0.5<br />
0<br />
−0.5<br />
Tsunami <strong>inundation</strong> <strong>maps</strong> <strong>of</strong> Whittier <strong>and</strong> <strong>western</strong> Passage Canal, Alaska 51<br />
Scenario 1, elevation 7.8m (25.4ft)<br />
Scenario 2, elevation 7.9m (25.9ft)<br />
Scenario 3, elevation 7.7m (25.3ft)<br />
Scenario 5, elevation 9.0m (29.5ft)<br />
Point 10<br />
West Camp Rd., east<br />
−1<br />
0 2 4 6 8 10 12<br />
Time after earthquake (hours).<br />
1<br />
0.5<br />
0<br />
−0.5<br />
Scenario 1, elevation 5.8m (18.9ft)<br />
Scenario 2, elevation 5.9m (19.3ft)<br />
Scenario 3, elevation 5.7m (18.7ft)<br />
Scenario 5, elevation 7.0m (23.0ft)<br />
−1<br />
0 2 4 6 8 10 12<br />
Time after earthquake (hours).<br />
1<br />
0.5<br />
0<br />
−0.5<br />
Point 11<br />
West Camp Rd., west<br />
Scenario 1, elevation 8.8m (28.7ft)<br />
Scenario 2, elevation 8.9m (29.2ft)<br />
Scenario 3, elevation 8.7m (28.6ft)<br />
Scenario 5, elevation 10.0m (32.8ft)<br />
Point 12<br />
Airport runway, west<br />
Scenario 1, elevation 5.7m (18.8ft)<br />
Scenario 2, elevation 5.9m (19.3ft)<br />
Scenario 3, elevation 5.7m (18.6ft)<br />
Scenario 5, elevation 7.0m (23.0ft)<br />
−1<br />
0 2 4 6 8 10 12<br />
Time after earthquake (hours).<br />
Water velocity above ground (meters/second).<br />
Water velocity above ground (meters/second).<br />
Water velocity above ground (meters/second).<br />
Water velocity above ground (meters/second).<br />
1<br />
0.5<br />
0<br />
−0.5<br />
Point 9<br />
West Camp Rd.<br />
Scenario 1, elevation 7.8m (25.4ft)<br />
Scenario 2, elevation 7.9m (25.9ft)<br />
Scenario 3, elevation 7.7m (25.3ft)<br />
Scenario 5, elevation 9.0m (29.5ft)<br />
−1<br />
0 2 4 6 8 10 12<br />
Time after earthquake (hours).<br />
1<br />
0.5<br />
0<br />
−0.5<br />
Point 10<br />
West Camp Rd., east<br />
Scenario 1, elevation 5.8m (18.9ft)<br />
Scenario 2, elevation 5.9m (19.3ft)<br />
Scenario 3, elevation 5.7m (18.7ft)<br />
Scenario 5, elevation 7.0m (23.0ft)<br />
−1<br />
0 2 4 6 8 10 12<br />
Time after earthquake (hours).<br />
1<br />
0.5<br />
0<br />
−0.5<br />
Point 11<br />
West Camp Rd., west<br />
Scenario 1, elevation 8.8m (28.7ft)<br />
Scenario 2, elevation 8.9m (29.2ft)<br />
Scenario 3, elevation 8.7m (28.6ft)<br />
Scenario 5, elevation 10.0m (32.8ft)<br />
−1<br />
0 2 4 6 8 10 12<br />
Time after earthquake (hours).<br />
1<br />
0.5<br />
0<br />
−0.5<br />
Point 12<br />
Airport runway, west<br />
Scenario 1, elevation 5.7m (18.8ft)<br />
Scenario 2, elevation 5.9m (19.3ft)<br />
Scenario 3, elevation 5.7m (18.6ft)<br />
Scenario 5, elevation 7.0m (23.0ft)<br />
−1<br />
0 2 4 6 8 10 12<br />
Time after earthquake (hours).<br />
Figure A-3 (continued). Time series <strong>of</strong> water level <strong>and</strong> velocity at selected locations for scenarios 1, 2, 3, <strong>and</strong> 5.
52 Report <strong>of</strong> Investigations 2011-7 — Appendix A<br />
Water level above ground (meters).<br />
Water level above ground (meters).<br />
Water level above ground (meters).<br />
Water level above ground (meters).<br />
1.4<br />
1.2<br />
1<br />
0.8<br />
0.6<br />
0.4<br />
0.2<br />
Point 13<br />
Airport runway<br />
Scenario 1, elevation 1.7m (5.6ft)<br />
Scenario 2, elevation 1.9m (6.2ft)<br />
Scenario 3, elevation 1.7m (5.5ft)<br />
Scenario 5, elevation 3.0m (9.8ft)<br />
0<br />
0 2 4 6 8 10 12<br />
Time after earthquake (hours).<br />
2.5<br />
2<br />
1.5<br />
1<br />
0.5<br />
0<br />
0 2 4 6 8 10 12<br />
Time after earthquake (hours).<br />
1<br />
0.8<br />
0.6<br />
0.4<br />
0.2<br />
Point 14<br />
Airport runway, east<br />
Scenario 1, elevation 0.7m (2.3ft)<br />
Scenario 2, elevation 0.9m (2.9ft)<br />
Scenario 3, elevation 0.7m (2.2ft)<br />
Scenario 5, elevation 2.0m (6.6ft)<br />
0<br />
0 2 4 6 8 10 12<br />
Time after earthquake (hours).<br />
1.4<br />
1.2<br />
1<br />
0.8<br />
0.6<br />
0.4<br />
0.2<br />
Point 15<br />
Harbor parking<br />
Scenario 1, elevation 1.8m (5.9ft)<br />
Scenario 2, elevation 1.9m (6.2ft)<br />
Scenario 3, elevation 1.8m (5.8ft)<br />
Scenario 5, elevation 3.0m (9.8ft)<br />
Point 16<br />
Railroad tracks<br />
Scenario 1, elevation 1.6m (5.2ft)<br />
Scenario 2, elevation 1.7m (5.5ft)<br />
Scenario 3, elevation 1.6m (5.1ft)<br />
Scenario 5, elevation 2.8m (9.1ft)<br />
0<br />
0 2 4 6 8 10 12<br />
Time after earthquake (hours).<br />
Water velocity above ground (meters/second).<br />
Water velocity above ground (meters/second).<br />
Water velocity above ground (meters/second).<br />
Water velocity above ground (meters/second).<br />
1.8<br />
1.6<br />
1.4<br />
1.2<br />
1<br />
0.8<br />
0.6<br />
0.4<br />
0.2<br />
Point 13<br />
Airport runway<br />
Scenario 1, elevation 1.7m (5.6ft)<br />
Scenario 2, elevation 1.9m (6.2ft)<br />
Scenario 3, elevation 1.7m (5.5ft)<br />
Scenario 5, elevation 3.0m (9.8ft)<br />
0<br />
0 2 4 6 8 10 12<br />
Time after earthquake (hours).<br />
1.4<br />
1.2<br />
1<br />
0.8<br />
0.6<br />
0.4<br />
0.2<br />
Point 14<br />
Airport runway, east<br />
Scenario 1, elevation 0.7m (2.3ft)<br />
Scenario 2, elevation 0.9m (2.9ft)<br />
Scenario 3, elevation 0.7m (2.2ft)<br />
Scenario 5, elevation 2.0m (6.6ft)<br />
0<br />
0 2 4 6 8 10 12<br />
Time after earthquake (hours).<br />
1.8<br />
1.6<br />
1.4<br />
1.2<br />
1<br />
0.8<br />
0.6<br />
0.4<br />
0.2<br />
Point 15<br />
Harbor parking<br />
Scenario 1, elevation 1.8m (5.9ft)<br />
Scenario 2, elevation 1.9m (6.2ft)<br />
Scenario 3, elevation 1.8m (5.8ft)<br />
Scenario 5, elevation 3.0m (9.8ft)<br />
0<br />
0 2 4 6 8 10 12<br />
Time after earthquake (hours).<br />
1.8<br />
1.6<br />
1.4<br />
1.2<br />
1<br />
0.8<br />
0.6<br />
0.4<br />
0.2<br />
Point 16<br />
Railroad tracks<br />
Scenario 1, elevation 1.6m (5.2ft)<br />
Scenario 2, elevation 1.7m (5.5ft)<br />
Scenario 3, elevation 1.6m (5.1ft)<br />
Scenario 5, elevation 2.8m (9.1ft)<br />
0<br />
0 2 4 6 8 10 12<br />
Time after earthquake (hours).<br />
Figure A-3 (continued). Time series <strong>of</strong> water level <strong>and</strong> velocity at selected locations for scenarios 1, 2, 3, <strong>and</strong> 5.
Sea level (meters).<br />
Sea level (meters).<br />
Sea level (meters).<br />
Sea level (meters).<br />
5<br />
4<br />
3<br />
2<br />
1<br />
0<br />
Point 17<br />
Passage Canal<br />
−1<br />
Final level: Scenario 1<br />
Final level: Scenario 2<br />
Final level: Scenario 3<br />
Final level: Scenario 5<br />
−2<br />
0 2 4 6 8 10 12<br />
Time after earthquake (hours).<br />
4<br />
3<br />
2<br />
1<br />
0<br />
Point 18<br />
Passage Canal, entrance<br />
Tsunami <strong>inundation</strong> <strong>maps</strong> <strong>of</strong> Whittier <strong>and</strong> <strong>western</strong> Passage Canal, Alaska 53<br />
Scenario 1<br />
Scenario 2<br />
Scenario 3<br />
Scenario 5<br />
Scenario 1<br />
Scenario 2<br />
Scenario 3<br />
Scenario 5<br />
Final level: Scenario 1<br />
−1<br />
Final level: Scenario 2<br />
Final level: Scenario 3<br />
Final level: Scenario 5<br />
−2<br />
0 2 4 6 8 10 12<br />
Time after earthquake (hours).<br />
4<br />
3<br />
2<br />
1<br />
0<br />
Final level: Scenario 1<br />
−1<br />
Final level: Scenario 2<br />
Final level: Scenario 3<br />
Final level: Scenario 5<br />
−2<br />
0 2 4 6 8 10 12<br />
Time after earthquake (hours).<br />
4<br />
3<br />
2<br />
1<br />
0<br />
Point 19<br />
Shotgun Cove, west<br />
Point 20<br />
Whittier harbor<br />
Scenario 1<br />
Scenario 2<br />
Scenario 3<br />
Scenario 5<br />
Scenario 1<br />
Scenario 2<br />
Scenario 3<br />
Scenario 5<br />
Final level: Scenario 1<br />
−1<br />
Final level: Scenario 2<br />
Final level: Scenario 3<br />
Final level: Scenario 5<br />
−2<br />
0 2 4 6 8 10 12<br />
Time after earthquake (hours).<br />
Water current (meters/second).<br />
Water current (meters/second).<br />
Water current (meters/second).<br />
Water current (meters/second).<br />
0.07<br />
0.06<br />
0.05<br />
0.04<br />
0.03<br />
0.02<br />
0.01<br />
Point 17<br />
Passage Canal<br />
Scenario 1<br />
Scenario 2<br />
Scenario 3<br />
Scenario 5<br />
0<br />
0 2 4 6 8 10 12<br />
Time after earthquake (hours).<br />
0.5<br />
0.4<br />
0.3<br />
0.2<br />
0.1<br />
Point 18<br />
Passage Canal, entrance<br />
Scenario 1<br />
Scenario 2<br />
Scenario 3<br />
Scenario 5<br />
0<br />
0 2 4 6 8 10 12<br />
Time after earthquake (hours).<br />
0.25<br />
0.2<br />
0.15<br />
0.1<br />
0.05<br />
Point 19<br />
Shotgun Cove, west<br />
Scenario 1<br />
Scenario 2<br />
Scenario 3<br />
Scenario 5<br />
0<br />
0 2 4 6 8 10 12<br />
Time after earthquake (hours).<br />
0.45<br />
0.4<br />
0.35<br />
0.3<br />
0.25<br />
0.2<br />
0.15<br />
0.1<br />
0.05<br />
Point 20<br />
Whittier harbor<br />
Scenario 1<br />
Scenario 2<br />
Scenario 3<br />
Scenario 5<br />
0<br />
0 2 4 6 8 10 12<br />
Time after earthquake (hours).<br />
Figure A-3 (continued). Time series <strong>of</strong> water level <strong>and</strong> velocity at selected locations for scenarios 1, 2, 3, <strong>and</strong> 5.
54 Report <strong>of</strong> Investigations 2011-7 — Appendix A<br />
Water level above ground (meters).<br />
Water level above ground (meters).<br />
Water level above ground (meters).<br />
Sea level (meters).<br />
1<br />
0.5<br />
0<br />
−0.5<br />
Point 21<br />
Learnard glacial moraine<br />
Scenario 1, elevation 4.2m (13.7ft)<br />
Scenario 2, elevation 4.4m (14.6ft)<br />
Scenario 3, elevation 4.1m (13.6ft)<br />
Scenario 5, elevation 5.5m (18.2ft)<br />
−1<br />
0 2 4 6 8 10 12<br />
Time after earthquake (hours).<br />
1<br />
0.5<br />
0<br />
−0.5<br />
Point 22<br />
Learnard glacial moraine<br />
Scenario 1, elevation 19.1m (62.7ft)<br />
Scenario 2, elevation 19.4m (63.5ft)<br />
Scenario 3, elevation 19.1m (62.5ft)<br />
Scenario 5, elevation 20.5m (67.1ft)<br />
−1<br />
0 2 4 6 8 10 12<br />
Time after earthquake (hours).<br />
1<br />
0.5<br />
0<br />
−0.5<br />
−1<br />
0 2 4 6 8 10 12<br />
Time after earthquake (hours).<br />
4<br />
3<br />
2<br />
1<br />
0<br />
Point 23<br />
Passage Canal, coast<br />
Scenario 1, elevation 4.0m (13.2ft)<br />
Scenario 2, elevation 4.2m (13.9ft)<br />
Scenario 3, elevation 4.0m (13.0ft)<br />
Scenario 5, elevation 5.3m (17.5ft)<br />
Point 24<br />
Shotgun Cove, south<br />
Scenario 1<br />
Scenario 2<br />
Scenario 3<br />
Scenario 5<br />
Final level: Scenario 1<br />
−1<br />
Final level: Scenario 2<br />
Final level: Scenario 3<br />
Final level: Scenario 5<br />
−2<br />
0 2 4 6 8 10 12<br />
Time after earthquake (hours).<br />
Water velocity above ground (meters/second).<br />
Water velocity above ground (meters/second).<br />
Water velocity above ground (meters/second).<br />
Water current (meters/second).<br />
1<br />
0.5<br />
0<br />
−0.5<br />
Point 21<br />
Learnard glacial moraine<br />
Scenario 1, elevation 4.2m (13.7ft)<br />
Scenario 2, elevation 4.4m (14.6ft)<br />
Scenario 3, elevation 4.1m (13.6ft)<br />
Scenario 5, elevation 5.5m (18.2ft)<br />
−1<br />
0 2 4 6 8 10 12<br />
Time after earthquake (hours).<br />
1<br />
0.5<br />
0<br />
−0.5<br />
Point 22<br />
Learnard glacial moraine<br />
Scenario 1, elevation 19.1m (62.7ft)<br />
Scenario 2, elevation 19.4m (63.5ft)<br />
Scenario 3, elevation 19.1m (62.5ft)<br />
Scenario 5, elevation 20.5m (67.1ft)<br />
−1<br />
0 2 4 6 8 10 12<br />
Time after earthquake (hours).<br />
1<br />
0.5<br />
0<br />
−0.5<br />
Point 23<br />
Passage Canal, coast<br />
Scenario 1, elevation 4.0m (13.2ft)<br />
Scenario 2, elevation 4.2m (13.9ft)<br />
Scenario 3, elevation 4.0m (13.0ft)<br />
Scenario 5, elevation 5.3m (17.5ft)<br />
−1<br />
0 2 4 6 8 10 12<br />
Time after earthquake (hours).<br />
1.6<br />
1.4<br />
1.2<br />
1<br />
0.8<br />
0.6<br />
0.4<br />
0.2<br />
Point 24<br />
Shotgun Cove, south<br />
Scenario 1<br />
Scenario 2<br />
Scenario 3<br />
Scenario 5<br />
0<br />
0 2 4 6 8 10 12<br />
Time after earthquake (hours).<br />
Figure A-3 (continued). Time series <strong>of</strong> water level <strong>and</strong> velocity at selected locations for scenarios 1, 2, 3, <strong>and</strong> 5.
Sea level (meters).<br />
4<br />
3<br />
2<br />
1<br />
0<br />
Point 25<br />
Shotgun Cove, east<br />
Final level: Scenario 1<br />
−1<br />
Final level: Scenario 2<br />
Final level: Scenario 3<br />
Final level: Scenario 5<br />
−2<br />
0 2 4 6 8 10 12<br />
Time after earthquake (hours).<br />
Tsunami <strong>inundation</strong> <strong>maps</strong> <strong>of</strong> Whittier <strong>and</strong> <strong>western</strong> Passage Canal, Alaska 55<br />
Scenario 1<br />
Scenario 2<br />
Scenario 3<br />
Scenario 5<br />
Water current (meters/second).<br />
0.5<br />
0.4<br />
0.3<br />
0.2<br />
0.1<br />
Point 25<br />
Shotgun Cove, east<br />
Scenario 1<br />
Scenario 2<br />
Scenario 3<br />
Scenario 5<br />
0<br />
0 2 4 6 8 10 12<br />
Time after earthquake (hours).<br />
Figure A-3 (continued). Time series <strong>of</strong> water level <strong>and</strong> velocity at selected locations for scenarios 1, 2, 3, <strong>and</strong> 5.
INTENTIONALLY LEFT BLANK
Tsunami <strong>inundation</strong> <strong>maps</strong> <strong>of</strong> Whittier <strong>and</strong> <strong>western</strong> Passage Canal, Alaska 57<br />
APPENDIX B<br />
Potential rockfall-generated <strong>tsunami</strong> at Whittier, Alaska<br />
by<br />
D.J. Nicolsky 1 , G.J. Wolken 2 , R.A. Combellick 2 , <strong>and</strong> R.A. Hansen 1<br />
Introduction<br />
During summer 2011, scientists from the Alaska Division <strong>of</strong> Geological & Geophysical Surveys (DGGS)<br />
conducted geologic-hazards fi eldwork around Passage Canal <strong>and</strong> discovered a number <strong>of</strong> mass-movement features,<br />
including several rockfalls along the steep slopes <strong>of</strong> Passage Canal. A large subaerial rockfall entering into Passage<br />
Canal has the potential to generate a local <strong>tsunami</strong> that could impact the community <strong>of</strong> Whittier <strong>and</strong> damage critical<br />
infrastructure.<br />
The destructive effects <strong>of</strong> mass-movement-generated <strong>tsunami</strong>s have been previously identifi ed in south-central<br />
<strong>and</strong> southeastern Alaska. The best known <strong>and</strong> largest subaerial mass-movement-generated <strong>tsunami</strong> <strong>of</strong> historic<br />
time occurred in Lituya Bay, Alaska, on June 9, 1958, when a magnitude 7.9 earthquake occurred on the nearby<br />
Fairweather fault <strong>and</strong> produced an estimated 30 million m 3 (1,050 million ft 3 ) rockfall that rapidly entered the water<br />
<strong>and</strong> initiated a <strong>tsunami</strong> with the highest wave ever recorded (524 m/1,700 ft) (Miller, 1960).<br />
In light <strong>of</strong> recent fi eld observations indicating the potential for a large subaerial rockfall into Passage Canal,<br />
<strong>and</strong> to provide guidance to local emergency management agencies in <strong>tsunami</strong> hazard assessment, we append this<br />
brief report that considers an additional hypothetical rockfall-generated <strong>tsunami</strong> scenario in Passage Canal.<br />
Aerial <strong>and</strong> fi eld observations<br />
A large bedrock fracture with a downhill-facing scarp was identifi ed above the north shore <strong>of</strong> Passage Canal<br />
(fi gs. B-1 <strong>and</strong> B-2). The fracture is located above an active rockfall, characterized by intermittent toppling <strong>of</strong> rock<br />
Figure B-1: 2010 SPOT satellite image <strong>of</strong> <strong>western</strong> Passage Canal <strong>and</strong> Whittier, Alaska. The red box indicates the<br />
location <strong>of</strong> the main rockfall <strong>and</strong> bedrock fracture.<br />
1 Alaska Earthquake Information Center, Geophysical Institute, University <strong>of</strong> Alaska, P.O. Box 757320, Fairbanks, Alaska 99775-7320<br />
2 Alaska Division <strong>of</strong> Geological & Geophysical Surveys, 3354 College Rd., Fairbanks, Alaska 99709-3707
58 Report <strong>of</strong> Investigations 2011-7 — Appendix B<br />
Figure B-2: Photograph <strong>of</strong> the main rockfall <strong>and</strong> fracture above the north shore <strong>of</strong> Passage Canal. The yellow line<br />
shows the active scarp <strong>of</strong> the rockfall, the red line shows the position <strong>of</strong> the bedrock fracture, <strong>and</strong> the dashed<br />
white box indicates the location <strong>of</strong> the photographs in fi gure B-4.<br />
debris ranging from small fragments to boulders up to 3 m (10 ft) in diameter. The fracture exhibits relatively less<br />
weathering <strong>and</strong> oxidation compared to surrounding rocks <strong>and</strong> remains free <strong>of</strong> vegetation (fi g. B-3), suggesting a<br />
relatively recent formation. Although no exact age is known, analysis <strong>of</strong> historic aerial photographs <strong>and</strong> satellite<br />
imagery indicates that the scarp occurred between 1950 <strong>and</strong> 1978.<br />
The bedrock fracture is approximately 55 m (180 ft) above the active rockfall scarp, or approximately 120<br />
m (400 ft) above sea level. It is mostly obscured by dense vegetation <strong>and</strong> is only visible from the air, mostly in<br />
areas <strong>of</strong> snow-avalanche scars. Views <strong>of</strong> the fracture from the air <strong>and</strong> ground are shown in fi gure B-3. Combined<br />
ground <strong>and</strong> aerial observations indicate that the fracture width ranges from 1.75 to 2.25 m (5.7–7.4 ft) <strong>and</strong> its<br />
length is about 160 m (520 ft). While the full length <strong>of</strong> the fracture remains unknown, the estimated surface area<br />
between the active rockfall scarp <strong>and</strong> observed fracture is near 6,200 m 2 (67,000 ft 2 ). The fracture has an arcuate<br />
convex-up form, suggesting that its origin could be related to the mechanisms infl uencing the active rockfall below.<br />
No other cracks are visible between the fracture <strong>and</strong> active rockfall scarp, indicating that the bedrock block below<br />
the fracture may have detached rigidly in response to the removal <strong>of</strong> lateral support from the mountain slope<br />
(glacier debuttressing), possibly in combination with external stimuli, such as seismic activity, rapid snowmelt,<br />
<strong>and</strong> intense rainfall.<br />
We emphasize that the fi eld observations <strong>of</strong> the depth <strong>of</strong> the fracture, <strong>and</strong> hence the total thickness <strong>of</strong> the<br />
material that can fail, are inconclusive. The fracture is located in a broad snow-avalanche zone where rock <strong>and</strong><br />
vegetation are regularly transported down slope, resulting in avalanche debris lodged in the fracture. The debris<br />
forms an intermittent false “fl oor” at a 2 m (7 ft) depth, obscuring the true depth. On the basis <strong>of</strong> these surface<br />
measurements, it is estimated that a volume <strong>of</strong> the potential rockfall is considerably less than that <strong>of</strong> the 1958<br />
Lituya Bay rockfall.
Tsunami <strong>inundation</strong> <strong>maps</strong> <strong>of</strong> Whittier <strong>and</strong> <strong>western</strong> Passage Canal, Alaska 59<br />
Figure B-3: Photograph <strong>of</strong> the bedrock fracture from the air (A) <strong>and</strong> the ground (B). Red arrows in A show the location <strong>of</strong> the fracture; red arrow in B identifi es a<br />
person for scale.
60 Report <strong>of</strong> Investigations 2011-7 — Appendix B<br />
Methodology <strong>and</strong> data<br />
Our ability to accurately model effects <strong>of</strong> a potential rapid subaerial mass failure into Passage Canal <strong>and</strong><br />
the subsequent impact <strong>of</strong> the rockfall-generated <strong>tsunami</strong> on Whittier depends on our knowledge <strong>of</strong> the type <strong>and</strong><br />
geometry <strong>of</strong> the mass movement <strong>and</strong> the local bedrock geology. Dense vegetation covers the slope on which the<br />
fracture is located; as a result, the total length <strong>and</strong> geometry <strong>of</strong> the fracture is currently unknown. Moreover, in the<br />
absence <strong>of</strong> drilling <strong>and</strong> seismic pr<strong>of</strong>i ling, the volume <strong>of</strong> the detached ground material is undetermined. Thus, the<br />
rockfall-generated <strong>tsunami</strong> scenario presented below represents our best estimate based on the currently available<br />
information.<br />
Hypothetical rockfall <strong>tsunami</strong> source<br />
An aerial view <strong>of</strong> the rockfall is shown in fi gure B-4. The red line in this fi gure marks the hypothesized extent<br />
<strong>of</strong> the potential rockfall. Based on fi eld observations, we assume that the upper limit <strong>of</strong> the potential rockfall is<br />
constrained by the bedrock fracture (fi gs. B-2 <strong>and</strong> B-3). The lateral extent <strong>of</strong> the potential rockfall was assumed<br />
based on extension <strong>of</strong> the arcuate form <strong>of</strong> the fracture. Note that the upper limit coincides with the surveyed extent<br />
<strong>of</strong> the fracture, the location <strong>of</strong> which is shown by a series <strong>of</strong> white triangles representing GPS measurements. The<br />
lower boundary <strong>of</strong> the rockfall is assumed here to be located well below the water surface. The green line dissects<br />
the area roughly in half <strong>and</strong> is used to illustrate hypothetical failure surfaces along the transect XY. Because the<br />
subsurface geologic data are missing, we calculated two hypothetical failure scenarios in order to give a range <strong>of</strong><br />
variability in the modeled run-up.<br />
In fi gure B-5, Cases A (red) <strong>and</strong> B (green) represent failure curves along the transect XY. The upper boundary<br />
<strong>of</strong> the rockfall is placed at the fracture, or ~ 120 m (400 ft) above the water, while the lower boundary is assumed to<br />
be 60 m (200 ft) below the water surface. We estimate that in Case A the total volume <strong>of</strong> the hypothetical rockfall<br />
is approximately 1.2 million m 3 (42 million ft 3 ), while in Case B the estimated volume is 1.8 million m 3 (63 million<br />
ft 3 ). We emphasize that these volumes are rough estimates, <strong>and</strong> further research is necessary to refi ne these values.<br />
Numerical modeling<br />
Modeling <strong>of</strong> waves generated by a rapid failure <strong>of</strong> the fjord slope presents a major diffi culty in the <strong>tsunami</strong>hazard<br />
assessment. An impact <strong>of</strong> the rockfall on the water surface results in a turbulent splash <strong>and</strong> consequent<br />
mixing <strong>of</strong> the granular fl ow with water. As the rockfall material submerges, a non-linear interaction <strong>of</strong> the sliding<br />
rockfall material with water further shapes the generated <strong>tsunami</strong>.<br />
Typically, there are several regions with distinct <strong>tsunami</strong> features considered around the rockfall. In the<br />
splash zone, a turbulent <strong>and</strong> chaotic water behavior (Fritz, 2002) can be modeled up to a certain extent by the 3-D<br />
Navier–Stokes equations coupled with an appropriate model <strong>of</strong> the slide (Heinrich, 1992; Heinrich <strong>and</strong> others,<br />
1998). The choice <strong>of</strong> slide model depends on the type <strong>of</strong> the ground material <strong>and</strong> its rheology. Beyond the splash<br />
zone, in the so-called near-fi eld zone, chaotic waves evolve into a well defi ned wave that propagates away from<br />
the slide. Finally, the far-fi eld zone is characterized by a steady partitioning <strong>of</strong> the kinematic <strong>and</strong> potential energy<br />
<strong>and</strong> by a well defi ned wave form.<br />
Identifying these zones is a complicated task <strong>and</strong> involves both theoretical <strong>and</strong> experimental studies (Mei,<br />
1983; Fritz, 2002; Walder <strong>and</strong> others, 2006). On other h<strong>and</strong>, if the splash zone is much smaller than the distance<br />
to a location where the run-up needs to be assessed, then it is common to assume that the splash zone is a ‘black<br />
box’ (Walder <strong>and</strong> others, 2006). The water wave is thought to be emerging from the ‘black box’ with well defi ned<br />
characteristics, that is, the wave exiting the splash zone is approximated by a soliton (Watts <strong>and</strong> Waythomas, 2003;<br />
Waythomas <strong>and</strong> others, 2006) or a parabola (Wieczorek <strong>and</strong> others, 2007). The initial wave height is parameterized<br />
by its slide volume, density, thickness, <strong>and</strong> velocity when the slide plunges into the water.<br />
Instead <strong>of</strong> determining an initial wave pr<strong>of</strong>i le (for example, the shape <strong>of</strong> the soliton), we assume that, to a<br />
certain extent, the rockfall can be approximated by a viscous slide that generates a <strong>tsunami</strong>. The dynamics <strong>of</strong> the<br />
sub-aerial part <strong>of</strong> the rockfall are modeled incorrectly, but the errors introduced are probably no greater than those<br />
introduced if the initial wave pr<strong>of</strong>i le were specifi ed as mentioned above. The simulated wave height 15 seconds<br />
after the failure, estimated for Case B, is shown in fi gure B-6. In a cross-section, the computed wave resembles a<br />
soliton <strong>and</strong> most <strong>of</strong> its energy is directed perpendicular to the shore. According to numerical modeling experiments,<br />
the rockfall is almost completely submerged 15 seconds after the failure <strong>and</strong> its further interaction with water<br />
is simulated by a viscous slide model coupled with the long-wave approximation for water waves. The model<br />
description 3 is provided in Section “Numerical model <strong>of</strong> l<strong>and</strong>slide-generated <strong>tsunami</strong> waves.” We emphasize that<br />
along with the numerical modeling assumptions in the splash zone, geometry <strong>and</strong> confi guration <strong>of</strong> the rockfall<br />
introduces most <strong>of</strong> the uncertainties in the presented modeling.<br />
3 The rockfall density is assumed to be 2,700 kg/m 3 (170 lb/ft 3 ).
Tsunami <strong>inundation</strong> <strong>maps</strong> <strong>of</strong> Whittier <strong>and</strong> <strong>western</strong> Passage Canal, Alaska 61<br />
The potential <strong>tsunami</strong> can reach Whittier in approximately one <strong>and</strong> one-half minute after the failure. The<br />
wave height in Passage Canal at Point 17, which is just outside <strong>of</strong> the Whittier harbor, is estimated to be about 2 m<br />
(7 ft). Most <strong>of</strong> the <strong>inundation</strong> is localized in the eastern part <strong>of</strong> the city near the small harbor. However, according<br />
to numerical experiments, the wave breakers are over-topped <strong>and</strong> a limited <strong>inundation</strong> within the harbor parking<br />
area is also expected. The modeled extents <strong>of</strong> the <strong>inundation</strong> in Rockfalls A <strong>and</strong> B are shown in fi gure B-7, by red<br />
<strong>and</strong> green lines, respectively. The sea level dynamics <strong>and</strong> water velocities at the inundated locations are plotted in<br />
fi gure B-8. The maximum wave height is approximately 3 m (10 ft) at Point 5. The waves can reach 1.5 m (5 ft)<br />
in the Whittier harbor, but subside after several erratic oscillations.<br />
60°48'30"N<br />
60°48'15"N<br />
60°48'0"N<br />
148°40'0"W<br />
148°40'0"W<br />
X<br />
0 50 100 200 Meters<br />
0 0.05 0.1 0.2 Miles<br />
148°39'30"W<br />
148°39'30"W<br />
GPS measurements <strong>of</strong> the fracture<br />
Boundary <strong>of</strong> the potential rockfall<br />
Location <strong>of</strong> the cross-section<br />
Estimated rockfall thickness<br />
0 100 m<br />
(330 ft)<br />
Y<br />
148°39'0"W<br />
60°48'15"N<br />
60°48'0"N<br />
148°39'0"W<br />
Figure B-4: Aerial view <strong>of</strong> the study area with the red line showing an extent <strong>of</strong> the potential rockfall. GPS locations<br />
<strong>of</strong> a visible part <strong>of</strong> the fracture are marked by white triangles. The green line shows a transect, along<br />
which two cases <strong>of</strong> the hypothetical failure surfaces are proposed (see fi gure B-5). The thickness <strong>of</strong> the rockfall,<br />
estimated for Case B, is shown on top <strong>of</strong> the image. The maximum thickness is approximately 70 m (230 ft)<br />
near the fracture.
62 Report <strong>of</strong> Investigations 2011-7 — Appendix B<br />
Elevation above the sea level, m<br />
200<br />
100<br />
0<br />
−100<br />
A<br />
B<br />
Rockfall Case A<br />
Rockfall Case B<br />
X Y<br />
Figure B-5: Failure surfaces along the transect XY plotted by a green line in fi gure B-4.<br />
o<br />
o<br />
Figure B-6: Numerically modeled wave leaving the splash zone 15 seconds after<br />
the rockfall failure. The extent <strong>of</strong> the rockfall is marked by a red line. The blue<br />
lines correspond to 0 <strong>and</strong> 10 m (33 ft) elevations above the sea level. The DEM<br />
corresponds to the present-day MHHW datum. For the sake <strong>of</strong> visualization, the<br />
elevations are cut at the 200 m (660 ft) level.<br />
o<br />
o
Tsunami <strong>inundation</strong> <strong>maps</strong> <strong>of</strong> Whittier <strong>and</strong> <strong>western</strong> Passage Canal, Alaska 63<br />
Sources <strong>of</strong> errors <strong>and</strong> uncertainties<br />
The hydrodynamic model used to calculate <strong>tsunami</strong> propagation <strong>and</strong> run-up is a nonlinear, fl ux-formulated,<br />
shallow water model (Nicolsky <strong>and</strong> others, 2011). It passed the validation <strong>and</strong> verifi cation tests required for<br />
models used in production <strong>of</strong> <strong>tsunami</strong> <strong>inundation</strong> <strong>maps</strong> (Synolakis <strong>and</strong> others, 2007). In a series <strong>of</strong> papers, several<br />
numerical methods, based on Boussinesq-type approximation, were developed (Madsen <strong>and</strong> others 1991; Kirby<br />
<strong>and</strong> others 1998). However, the advantage <strong>of</strong> the latter models over classical shallow-water equations in matching<br />
fi eld observations is an active area <strong>of</strong> research (Lynett <strong>and</strong> others, 2003; Tappin <strong>and</strong> others 2008).<br />
Volume <strong>and</strong> confi guration <strong>of</strong> the potential slope failure, dynamics <strong>of</strong> the rockfall, as well as the rheological<br />
properties <strong>of</strong> the sliding material are the largest uncertainties in the presented <strong>tsunami</strong> modeling study. Thus,<br />
additional in situ measurements <strong>and</strong> future modeling efforts are required to address these uncertainties.<br />
References Cited<br />
Fritz, H.M., 2002, Initial phase <strong>of</strong> l<strong>and</strong>slide generated impulse waves: Zürich, Switzerl<strong>and</strong>, Swiss Federal Institute<br />
<strong>of</strong> Technology (ETH), Ph.D. dissertation.<br />
Heinrich, Philippe, 1992, Nonlinear water waves generated by submarine <strong>and</strong> aerial l<strong>and</strong>slides: Journal <strong>of</strong> Waterway,<br />
Port, Coastal, <strong>and</strong> Ocean Engineering, v. 118, p. 249–266.<br />
Heinrich, Philippe, Mangeney, Anne, Guibourg, S<strong>and</strong>rine, Rocher, Roger, Boudon, Georges, <strong>and</strong> Cheminee, Jean-<br />
Louis, 1998, Simulation <strong>of</strong> water waves generated by a potential debris avalanche in Montserrat, Lesser<br />
Antilles: Geophysical Research Letters, v. 25, no. 19, p. 3,697–3,700.<br />
Kirby, J.T., Wei, G., Chen, Q., Kennedy, A.B., <strong>and</strong> Dalrymple, R.A., 1998, FUNWAVE 1.0, Fully nonlinear<br />
Boussinesq wave model; Documentation <strong>and</strong> user’s manual: Report CACR-98-06, Center for Applied Coastal<br />
Research, Department <strong>of</strong> Civil <strong>and</strong> Environmental Engineering, University <strong>of</strong> Delaware.<br />
Lynett, P.J., Borrero, J.C., Liu, P.L.F., <strong>and</strong> Synolakis, C.E., 2003, Field survey <strong>and</strong> numerical simulations—A<br />
review <strong>of</strong> the 1998 Papua New Guinea <strong>tsunami</strong>, in Bardet, Jean-Pierre, Synolakis, C.E., Davies, H.L.,<br />
Imamura, Fumihiko, <strong>and</strong> Okal, E.A., eds., L<strong>and</strong>slide <strong>tsunami</strong>s; Recent fi ndings <strong>and</strong> research directions: Basel,<br />
Switzerl<strong>and</strong>, Birkhaeuser, Pure <strong>and</strong> Applied Geophysics, v. 160, no. 10–11, p. 2,119–2,146.<br />
Madsen, P.A., Murray, Russel, <strong>and</strong> Sorensen, O.R., 1991. A new form <strong>of</strong> the boussinesq equations with improved<br />
linear dispersion characteristics: Coastal Engineering, v. 15, no. 4, p. 371–388.<br />
Mei, C.C., 1983, The Applied Dynamics <strong>of</strong> Ocean Surface Waves: John Wiley & Sons, 760 p.<br />
Miller, D.J., 1960, Giant Waves in Lituya Bay, Alaska: U.S. Geological Survey Pr<strong>of</strong>essional Paper 354-C, p. 51–86,<br />
1 sheet, scale 1:50,000.<br />
Nicolsky, D.J., Suleimani, E.N., <strong>and</strong> Hansen, R.A., 2011, Validation <strong>and</strong> verifi cation <strong>of</strong> a numerical model<br />
for <strong>tsunami</strong> propagation <strong>and</strong> runup: Pure <strong>and</strong> Applied Geophysics, v. 168, p. 1,199–1,222, http://dx.doi.<br />
org/10.1007/s00024-010-0231-9.<br />
Synolakis, C.E., Bernard, E.N., Titov, V.V., Kânoğlu, U., <strong>and</strong> González, F.I., 2007, St<strong>and</strong>ards, criteria, <strong>and</strong><br />
procedures for NOAA evaluation <strong>of</strong> <strong>tsunami</strong> numerical models: Seattle, Washington, NOAA/Pacifi c Marine<br />
Environmental Laboratory, Technical Memor<strong>and</strong>um OAR PMEL-135, 55 p.<br />
Tappin, D.R., Watts, Philip, <strong>and</strong> Grilli, S.T., 2008, The Papua New Guinea <strong>tsunami</strong> <strong>of</strong> 17 July 1998—Anatomy <strong>of</strong><br />
a catastrophic event: Natural Hazards <strong>and</strong> Earth System Sciences, v. 8, no. 2, p. 243–266.<br />
Walder, J.S., Watts, P., <strong>and</strong> Waythomas, C.F., 2006, Case study: Mapping <strong>tsunami</strong> hazards associated with debris<br />
fl ow into a reservoir: Journal <strong>of</strong> Hydraulic Engineering, v. 132, no. 1, p 1–11.<br />
Watts, P., <strong>and</strong> Waythomas, C.F., 2003, Theoretical analysis <strong>of</strong> <strong>tsunami</strong> generation by pyroclastic fl ows: Journal <strong>of</strong><br />
Geophysical Research, B, Solid Earth <strong>and</strong> Planets, v. 108, p. 21.<br />
Waythomas, C.F., Watts, P., <strong>and</strong> Walder, J.S., 2006, Numerical simulation <strong>of</strong> <strong>tsunami</strong> generation by cold volcanic<br />
mass fl ows at Augustine Volcano, Alaska. Natural Hazards <strong>and</strong> Earth System Science, v. 6, no. 5, p. 671–685.<br />
Wieczorek, G.F., Geist, E.L., Motyka, R.J., <strong>and</strong> Jakob, M., 2007, Hazard assessment <strong>of</strong> the Tidal Inlet l<strong>and</strong>slide<br />
<strong>and</strong> potential subsequent <strong>tsunami</strong>, Glacier Bay National Park, Alaska: L<strong>and</strong>slides, v. 4, p. 205–215.
148°40'30"W<br />
148°42'0"W<br />
Rockfall A, 1.8 million m3 Rockfall B, 1.2 million m3 64 Report <strong>of</strong> Investigations 2011-7 — Appendix B<br />
60°47'30"N<br />
Observed 1964 <strong>inundation</strong><br />
Present-day MHHW shoreline<br />
60°47'30"N<br />
0 125 250 500 Meters<br />
0 0.125 0.25 0.5 Miles<br />
SCALE 1:14,000<br />
60°47'0"N<br />
60°47'0"N<br />
60°46'30"N<br />
60°46'30"N<br />
148°40'30"W<br />
148°42'0"W<br />
Figure B-7: Modeled potential <strong>inundation</strong> by the rockfall-generated waves, for two different cases. The volume in Rockfall A is 1.8 million m3 (63 million ft3 ) <strong>and</strong> in<br />
Rockfall B is 1.2 million m3 (42 million ft3 ). The DEM corresponds to the present-day MHHW datum. Because <strong>of</strong> the steep topography, <strong>inundation</strong> areas for several<br />
<strong>tsunami</strong> scenarios have a common boundary, <strong>and</strong> the plotted extents <strong>of</strong> the <strong>inundation</strong> areas may overlay each other.
Water level above ground (meters).<br />
Water level above ground (meters).<br />
Sea level (meters).<br />
Sea level (meters).<br />
2.5<br />
2<br />
1.5<br />
1<br />
0.5<br />
Point 4<br />
Depot Rd., east<br />
0<br />
0 1 2 3 4 5 6 7 8 9 10<br />
Time after failure (minutes).<br />
3<br />
2.5<br />
2<br />
1.5<br />
1<br />
0.5<br />
Tsunami <strong>inundation</strong> <strong>maps</strong> <strong>of</strong> Whittier <strong>and</strong> <strong>western</strong> Passage Canal, Alaska 65<br />
Rockfall A, elevation 2.5m, (8.2ft)<br />
Rockfall B, elevation 2.5m, (8.2ft)<br />
0<br />
0 1 2 3 4 5 6 7 8 9 10<br />
Time after failure (minutes).<br />
2<br />
1.5<br />
1<br />
0.5<br />
0<br />
−0.5<br />
Point 5<br />
Small harbor<br />
Rockfall A, elevation 1.5m, (4.9ft)<br />
Rockfall B, elevation 1.5m, (4.9ft)<br />
−1<br />
0 1 2 3 4 5 6 7 8 9 10<br />
Time after failure (minutes).<br />
2<br />
1.5<br />
1<br />
0.5<br />
0<br />
−0.5<br />
Point 17<br />
Passage Canal<br />
Point 20<br />
Whittier harbor<br />
Rockfall A<br />
Rockfall B<br />
Rockfall A<br />
Rockfall B<br />
−1<br />
0 1 2 3 4 5 6 7 8 9 10<br />
Time after failure (minutes).<br />
Water velocity above ground (meters/second).<br />
Water velocity above ground (meters/second).<br />
Water current (meters/second).<br />
Water current (meters/second).<br />
4.5<br />
4<br />
3.5<br />
3<br />
2.5<br />
2<br />
1.5<br />
1<br />
0.5<br />
Point 4<br />
Depot Rd., east<br />
Rockfall A, elevation 2.5m, (8.2ft)<br />
Rockfall B, elevation 2.5m, (8.2ft)<br />
0<br />
0 1 2 3 4 5 6 7 8 9 10<br />
Time after failure (minutes).<br />
3<br />
2.5<br />
2<br />
1.5<br />
1<br />
0.5<br />
Point 5<br />
Small harbor<br />
Rockfall A, elevation 1.5m, (4.9ft)<br />
Rockfall B, elevation 1.5m, (4.9ft)<br />
0<br />
0 1 2 3 4 5 6 7 8 9 10<br />
Time after failure (minutes).<br />
0.45<br />
0.4<br />
0.35<br />
0.3<br />
0.25<br />
0.2<br />
0.15<br />
0.1<br />
0.05<br />
Point 17<br />
Passage Canal<br />
Rockfall A<br />
Rockfall B<br />
0<br />
0 1 2 3 4 5 6 7 8 9 10<br />
Time after failure (minutes).<br />
1.4<br />
1.2<br />
1<br />
0.8<br />
0.6<br />
0.4<br />
0.2<br />
Point 20<br />
Whittier harbor<br />
Rockfall A<br />
Rockfall B<br />
0<br />
0 1 2 3 4 5 6 7 8 9 10<br />
Time after failure (minutes).<br />
Figure B-8: Time series <strong>of</strong> the water level <strong>and</strong> velocity at the selected points in Rockfalls A <strong>and</strong> B. Location <strong>of</strong> the<br />
points are shown in fi gure A-1.