art13 - saramet 257-264 - Farmacia
art13 - saramet 257-264 - Farmacia
art13 - saramet 257-264 - Farmacia

Create successful ePaper yourself
Turn your PDF publications into a flip-book with our unique Google optimized e-Paper software.
260<br />
FARMACIA, 2011, Vol.59, 2<br />
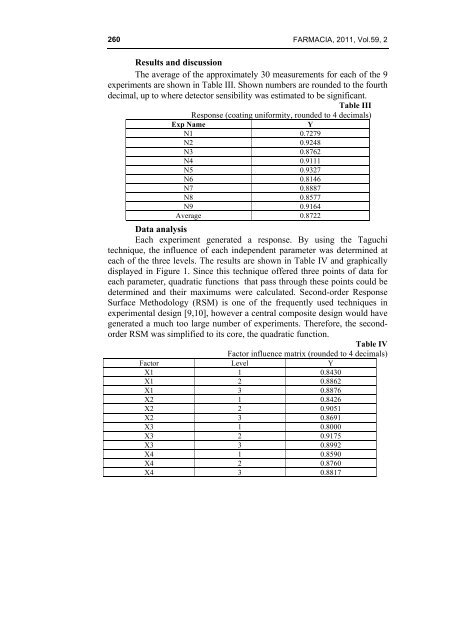
Results and discussion<br />
The average of the approximately 30 measurements for each of the 9<br />
experiments are shown in Table III. Shown numbers are rounded to the fourth<br />
decimal, up to where detector sensibility was estimated to be significant.<br />
Table III<br />
Response (coating uniformity, rounded to 4 decimals)<br />
Exp Name Y<br />
N1 0.7279<br />
N2 0.9248<br />
N3 0.8762<br />
N4 0.9111<br />
N5 0.9327<br />
N6 0.8146<br />
N7 0.8887<br />
N8 0.8577<br />
N9 0.9164<br />
Average 0.8722<br />
Data analysis<br />
Each experiment generated a response. By using the Taguchi<br />
technique, the influence of each independent parameter was determined at<br />
each of the three levels. The results are shown in Table IV and graphically<br />
displayed in Figure 1. Since this technique offered three points of data for<br />
each parameter, quadratic functions that pass through these points could be<br />
determined and their maximums were calculated. Second-order Response<br />
Surface Methodology (RSM) is one of the frequently used techniques in<br />
experimental design [9,10], however a central composite design would have<br />
generated a much too large number of experiments. Therefore, the secondorder<br />
RSM was simplified to its core, the quadratic function.<br />
Table IV<br />
Factor influence matrix (rounded to 4 decimals)<br />
Factor Level Y<br />
X1 1 0.8430<br />
X1 2 0.8862<br />
X1 3 0.8876<br />
X2 1 0.8426<br />
X2 2 0.9051<br />
X2 3 0.8691<br />
X3 1 0.8000<br />
X3 2 0.9175<br />
X3 3 0.8992<br />
X4 1 0.8590<br />
X4 2 0.8760<br />
X4 3 0.8817